
Abstract
Sun-induced chlorophyll fluorescence (SIF) provides an opportunity to study terrestrial ecosystem photosynthesis dynamics. However, the current coarse spatiotemporal satellite SIF products are challenging for mechanistic interpretations of SIF signals. Long-term ground SIF and vegetation indices (VIs) are important for satellite SIF validation and mechanistic understanding of the relationship between SIF and photosynthesis when combined with leaf- and canopy-level auxiliary measurements. In this study, we present and analyze a total of 15 site-years of ground far-red SIF (SIF at 760 nm, SIF760) and VIs datasets from soybean, corn, and miscanthus grown in the U.S. Corn Belt from 2016 to 2021. We introduce a comprehensive data processing protocol, including different retrieval methods, calibration coefficient adjustment, and nadir SIF footprint upscaling to match the eddy covariance footprint. This long-term ground far-red SIF and VIs dataset provides important and first-hand data for far-red SIF interpretation and understanding the mechanistic relationship between far-red SIF and canopy photosynthesis across various crop species and environmental conditions.
Background & Summary
Chlorophyll fluorescence is the emission of light in the spectral range of 650–850 nm from the excited states of chlorophyll-a molecules in competition with photochemistry and heat dissipation1. It is tightly linked to photosynthesis from the molecular to canopy levels2,3. Detecting fluorescence is challenging due to its small percentage in the reflected radiance signal under natural sunlight (~1-2%)4. Pulse-amplitude modulated (PAM) fluorescence techniques with active light sources have long been used to induce fluorescence and are further used as a probe to study photosynthesis in the laboratory and natural fields1,5. However, active PAM measurements require close contact with leaves, which has limited its applications to the subcellular and leaf levels6. The feasibility of remotely detecting passive fluorescence, that is, sun-induced chlorophyll fluorescence (SIF), has extended the possibilities to monitor vegetation dynamics at the ecosystem, regional and global scales7,8. The first global terrestrial satellite SIF product was retrieved from meteorological satellites in 20119. Afterward, a growing number of spaceborne SIF retrievals have been developed10,11,12,13, which have stimulated a wide range of SIF applications such as gross primary production (GPP) estimation14,15,16, crop productivity estimation17,18,19, and detection of various stress effects20,21,22.
These satellite technology developments have also spurred interest in ground remote sensing of SIF23,24. Ground SIF can facilitate the interpretation of SIF and its relationship with photosynthesis at leaf and canopy levels since satellite SIF usually have coarse spatial and limited temporal resolutions. Benchmark data of GPP is usually estimated from eddy covariance (EC) towers which measure the carbon, water vapor, and energy flux exchanges between terrestrial ecosystems and the atmosphere25. EC techniques capture ecosystem CO2 fluxes across a range of temporal scales from half hours to years, and samples footprints along the longitudinal dimensions ranging between a hundred meters and several kilometers depending on the tower setup, turbulent conditions, and underlying surface conditions26. Currently available satellite SIF products with coarse spatiotemporal resolution (e.g., 7 km × 3.5 km at nadir and nearly daily for TROPOspheric Monitoring Instrument (TROPOMI)) hinders the direct comparison between satellite SIF and ground GPP due to their sampling footprint mismatch. Ground remote sensing is capable of collecting SIF from minutes to days and sampling areas from several meters to hundreds of meters27, which is more comparable to ground GPP than satellite products. Therefore, ground SIF and vegetation indices (VIs) are crucial for bridging the measurement gap between flux measurements and satellite data. First, the high temporal resolution of ground SIF and VIs allows the investigation of diurnal relationships between SIF and GPP as well as their relationship under different environmental conditions28,29,30. Second, the spatial comparability between ground sensing and GPP is beneficial for exploring species-specific SIF-GPP relationships and mechanistic SIF-GPP relationships when combined with leaf-level measurements31,32,33,34. Additionally, ground sensing of SIF and VIs can be used as validation of satellite remote sensing products35. Various studies have shown the advantages of ground spectral measurements in connecting vegetation optical properties to EC flux measurements36,37.
Over the last several years, a number of spectral systems have been developed and deployed in the field for collecting automatic and continuous observations of canopy SIF and VIs, e.g., FluoSpec238, FLOX (JB Hyperspectral Devices), Photospec39, FAME40, SIFSpec41 and SIFprism42. These systems are either bi-hemispherical systems that samples canopy radiance from 180° field of view (FOV) with the use of a cosine corrector (e.g., FAME and SIFprism), or hemispherical-directional systems which sample canopy radiance using a bare fiber with FOV ~25° (e.g., FluoSpec2 and Photospec). Each system is usually equipped with two spectrometers. One spectrometer with high-spectral resolution and signal-to-noise (SNR) ratio (e.g., QEPRO from Ocean Optics, Inc., Dunedin, FL, USA) is for SIF retrieval, and the other one covers visible to the near-infrared band for VIs estimation (e.g., HR2000 + from Ocean Optics). Ground spectral observations can be collected near EC towers to facilitate the direct investigation of SIF-VIs-GPP relationships and validation of satellite products. Numerous studies have investigated ground SIF and its relationship with stress and canopy photosynthesis, but most of them only focus on one single site, single growing season, and/or single species/ecosystem31,32,43. Additionally, although a few communities have integrated optical sampling with EC flux measurements, such as SpecNet (http://specnet.info)44, EUROSPEC (https://eurospec.eu)37 and ChinaSpec (http://chinaspec.nju.edu.cn)45, the SIF and concurrent VIs data availability is still limited across multiple years and sites.
In this paper, we present a dataset with 15 site-years of ground far-red SIF and VIs (including normalized difference vegetation index (NDVI), enhanced vegetation index (EVI), near-infrared of vegetation (NIRv), red edge chlorophyll index (CIrededge), green chlorophyll index (CIgreen) and photochemical reflectance index (PRI)) across multiple crop sites in the U.S. Corn Belt collected from 2016 to 2021. A FluoSpec2 system was used to collect the spectral data automatically and continuously in each growing season. The six VIs were chosen to reflect different aspects of terrestrial vegetation. Specifically, NDVI, EVI, and NIRv are mainly related to canopy structure, such as fraction of vegetation cover, leaf area index, and canopy architecture46,47,48. CIrededge and CIgreen are two widely used chlorophyll indices49, and PRI is related to the photosynthetic radiation use efficiency and non-photochemical quenching (NPQ)50. Sampled crop species include corn (C4 plant), soybean (C3 plant), and miscanthus (C4 plant). Corn and soybean are essential annual row crops which are widely used as human food, livestock feed, and raw materials in industry. Miscanthus is a promising perennial crop for bioenergy production attributed to its significant carbon sequestration, large biomass, and high nutrient use efficiency51. All the sites contain corresponding EC flux and meteorological data, which is beneficial for the direct exploration of SIF-VIs-GPP relationships across different crop species under different environmental conditions. The aim of this paper is to: (i) describe the instrumentation, data collection, and data processes for far-red SIF and VIs; and (ii) perform analyses of crop far-red SIF, VIs, as well as SIF-VIs relationships as an indirect validation of the dataset. The paper also aims to invite any researcher interested to proceed with further analysis of the data, which are made available in a public repository. The spectral system, field deployment, data collection and data processes, including different far-red SIF retrievals, radiometric calibration coefficient adjustments, upscaling nadir SIF to EC footprint, and VIs estimation, are described in Methods section. In Data Records and Technical Validation section, the retrieved far-red SIF, estimated VI, as well as the relationship between SIF and VIs across corn, soybean, and miscanthus, are presented.
Methods
Spectral system description
FluoSpec2, a hemispherical-directional system, was used for spectral data collection38,52. It consists of two paths, with each path equipped with one spectrometer, one splitting fiber, one inline shutter, and two fibers for downwelling irradiance and upwelling radiance collection, respectively (Fig. 1). The data collected by the two paths were used for far-red SIF retrieval and VIs estimation, respectively. For far-red SIF data collection, the spectrometer, QEPRO, covered wavelengths from 730–780 nm with a Full Width Half Maximum (FWHM) of 0.15 nm. For VIs estimation, the HR2000 + spectrometer with a wavelength coverage of 350–1100 nm and FWHM 1.1 nm was used (Ocean Optics). One cosine corrector (CC3, Ocean Optics) was attached to the irradiance fiber to achieve a FOV of 180° while a bare fiber with a FOV of 25° was installed at the nadir for canopy radiance collection. Two spectrometers were connected to a laptop to conduct automatic data collection. The spectral system, except the fibers, was placed in an enclosure with temperature controlled by an air conditioner. The target temperature was set to 25 °C. A temperature and humidity sensor (THC-4) was used to monitor the change in temperature and humidity continuously. Desiccant bags were added into the enclosure periodically to ensure the relative humidity (RH) was below 70%.
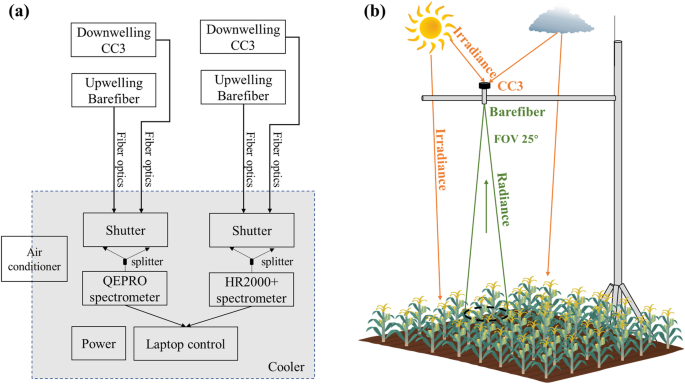
Schematic layout and deployment of FluoSpe2. (a) Schematic diagram of a FluoSpe2 system; (b) Conceptual field deployment of a FluoSpe2 system. FOV: field of view.
Field system setups
At each site-year, the FluoSpec2 system was installed close to the EC tower to integrate with EC flux measurements. All of our sites were planted with one of the following crops: corn, soybean (Soy), or miscanthus (Mis). Considering that the maximum canopy height for those crops is below 3 m, a simple tripod with a bracket or a scaffold was used to hold the fibers at the height of 5 m, at which the spectral target area is ~2.2 meters in diameter on the ground (Fig. 2). When crops are fully grown, the spectral target area is around ~1.8 meters in diameter for soybean (maximum height ~ 1 m) and ~1.1 meters in diameter for corn and miscanthus (maximum height ~2.5 m). FluoSpec2 system was installed at seven sites in the U.S. Corn Belt near planting and uninstalled after harvest to collect whole growing-season data (Table 1). Two of the sites were in Lincoln, Nebraska (US-Ne2 and US-Ne3), and the other five sites were in Champaign, Illinois (US-UiB, US-UiC, Reifsteck, Rund, and Reinhart). Except for US-UiB where miscanthus emerged each year after the establishment in 2010, other sites were either corn-soybean rotation or corn-corn-soybean rotation. US-Ne2 was an irrigated site while other sites were rainfed. Fertilizers were applied for corn and miscanthus at all the sites. Detailed site information is summarized in Table 1. US-Ne2, US-Ne3, US-UiB, and US-UiC are registered on the AmeriFlux site (https://ameriflux.lbl.gov/), where EC and meteorological data can be freely downloaded. Reifsteck, Rund, and Reinhart sites are private farms, and EC and meteorological data can be obtained upon the request of PIs.

Field sites of our long-term ground measurements and some examples of field setups of FluoSpec2 systems.
Data collection
FluoSpec Manager, a software written in Visual Basic with libraries provided by Ocean Optics was installed on the laptop to control the automatic irradiance and radiance data collection at 5-minute intervals38. The integrating time for each spectrum was optimized by the algorithm in FluoSpec Manager with the target maximum digital number (DN) of 120000 for QEPRO and 12000 for HR2000+, respectively. For each 5-min interval, data was collected in the following sequence: HR2000+ irradiance – HR2000+ radiance – HR2000+ irradiance – QEPRO irradiance – QEPRO radiance – QEPRO irradiance. The dark current for QEPRO was collected after each observation with the same integrating time as the observation through controlling the internal shutter of QEPRO. For HR2000+, the dark signal was collected using OceanView (Ocean Optics) under various integrating times during the nighttime period, and the dark signal with a similar integrating time as the observation was used to match with each observation. From 2016 to 2021, a total of 15 site-years data were collected with eight site-years corn, five site-years soybeans, and two site-years miscanthus. For each site-year, corn and soybean were planted during April or May and harvested in September or October. Miscanthus emerged in March and was harvested in the following year in February or March. Detailed information about the data availability at each site-year is summarized in Table 2.
In-field radiometric calibration was conducted on all the fibers connected to the upward cosine corrector and downward bare fiber when FluoSpec2 was assembled. First, A homogenous light source with known intensity (a tungsten–halogen light source, HL-3P-CAL, Ocean Optics) was used to calibrate the upward cosine corrector through the OceanView “absolute irradiance” module. Second, for the downward bare fiber pointing to the canopy, a cross-validation method was used. Specifically, when the skies were sunny and the solar zenith angle was not high (local time between 10 am to 3 pm), the four fibers were installed in a way that the calibrated cosine correctors pointed to the sky, and the downward bare fibers pointed to a spectralon panel with known reflectance (Labsphere, Inc., NH, USA) at the same time; then the calibrated irradiance path was used to cross-calibrate the radiance path. No shadow on the spectralon panel was allowed in the footprint of the downward bare fibers when conducting the calibration. At least three times in-field calibrations were conducted during the growing season. The calibration coefficients for HR2000+ were stable across the whole growing season while for QEPRO they showed variations. The calibration coefficient for which the retrieved far-red SIF value was closest to zero for all the collected spectralon panels’ data was used to obtain absolute irradiance and radiance for QEPRO and HR2000+ based on the assumption that spectralon panels did not emit fluorescence.
Collected solar irradiance and canopy radiance data from QEPRO and HR2000+ were used for far-red SIF retrieval and VIs estimation, respectively. For each site year, different SIF retrieval algorithms were first used to derive raw SIF at 760 nm (SIF760). Radiometric calibration coefficients were then adjusted to account for the calibrating light source degradation across years. Calibration-corrected SIF760 was finally upscaled to match the EC footprint. Different VIs were estimated from the visible to near-infrared band reflectance calculated from HR2000+ irradiance and radiance. Considering the large uncertainty of SIF760 data under low light conditions, only SIF760 and VIs data collected from local time 8 am to 6 pm when the solar zenith angle was smaller than 90° were used. A flowchart of data processing at each site-year is summarized in Fig. 3. The processed half-hourly SIF760 and VIs are available at the on Oak Ridge National Laboratory Distributed Active Archive Center (ORNL DAAC) data repository https://doi.org/10.3334/ORNLDAAC/213653.

Flowchart of data processing at each site-year. sFLD: standard Fraunhofer line depth; 3FLD: three-band Fraunhofer line depth; iFLD: improved Fraunhofer line depth; SFM-nonlinear: spectral fitting method with the assumption of non-linear variation of fluorescence and reflectance over the absorption band; SFM-linear: spectral fitting method with the assumption of linear variation of fluorescence and reflectance over the absorption band; fcal-corr-QEPRO: the calibration adjustment factor for SIF; EC: eddy covariance; \(Rati{o}_{ECfootprint,SIFpixel}\): the ratio between EC footprint weighted VI and SIF tower located pixel VI.
SIF retrieval methods
SIF adds a weak signal to the reflected solar radiation, which results in two contributions to the upwelling radiance (L). Most retrieval algorithms for ground SIF are based on the Fraunhofer line depth (FLD) principle and the spectral fitting method (SFM). FLD approaches exploit the reduced downwelling irradiance (E) inside the oxygen absorption bands (O2A and O2B) reaching the surface, which results in an increase in the relative contribution of SIF to L. Several FLD methods are commonly used in ground SIF retrieval, including standard FLD (sFLD), three bands FLD (3FLD), and improved FLD (iFLD). All of them rely on the measurements of E and L inside and outside the absorption window (λin and λout). Here, we specifically focus on the O2A absorption window (760 nm) considering the wavelength coverage of QEPRO. The upwelling radiance inside and outside the O2A band (L(λin), L(λout)) is a function of reflectance (R(λin), R(λout)), irradiance (E(λin), E(λout)) and SIF (SIF(λin), SIF(λout)) inside and outside the absorption band, respectively:
For sFLD which assumes that the R and SIF are the same inside and outside the absorption band (\(R\left({\lambda }_{in}\right)=R\left({\lambda }_{out}\right)\)), \(SIF\left({\lambda }_{in}\right)=SIF\left({\lambda }_{out}\right)\)), SIF can be derived as follows:
As a more advanced method than sFLD, 3FLD assumes that R and F change linearly over the absorption window. Therefore, the single reference outside band used in sFLD (λout) is replaced by the average of two bands of the left and right shoulders of the absorption line. However, non-linear variation of R and SIF could result in inaccurate SIF estimates. Therefore, iFLD uses two correction factors (αR and αF) to account for the non-linear change of R and F over the absorption window54. Instead of two or three bands, iFLD utilizes the whole R and E spectral information to estimate αR and αF. Specifically, they are estimated by the apparent reflectance (Rapp) which is contaminated with fluorescence signal as follows:
where Rapp(λout) is the apparent reflectance outside the absorption band, and \({R}_{app}\widetilde{\left({\lambda }_{in}\right)}\) is the apparent reflectance inside the absorption band which is obtained from the non-linear interpolation of the apparent reflectance using the continuouss reflectance spectrum at the left and right shoulders. Analogously, \(E\widetilde{\left({\lambda }_{in}\right)}\) is obtained by the interpolation of the irradiance. SIF is calculated as follows:
Different from FLD-based approaches, SFM method aims to decouple SIF and reflectance from radiance observations through general mathematical representations of canopy SIF and R within the narrow absorption windows centered at 760 nm. The parameterization of functions for SIF and R is optimized by the least-square optimization process with observed radiance as a reference. Both linear and non-linear functions can be used to represent SIF and R. Here, we tried both the linear method, which assumed that SIF and R both linearly changed with wavelength52, and the non-linear method, for which a Gaussian function was used to model SIF and a cubic spline function was used to model R55. For the linear model:
For the non-linear model, R was approximated by a cubic spline function and SIF was modelled as follows:
Parameters a, b, c, d of the linear method and a′, b′ and c′ of the non-linear method were optimized to match the observed L. When λ is set as 760 nm, SIF760 is estimated. The values of these five-method estimated SIF760 were all presented as well as their comparison. SIF760 was retrieved at the raw 5-minute interval. SIF760 values below 0 or above 5 were discarded as outliers. Raw 5-minute SIF760 was averaged to half-hourly timestamp to match the EC data when more than four data points were available during the half-hourly period. The standard error of 5-minute SIF760 within the half hour was regarded as the uncertainty of each method retrieved SIF760. Detailed information about the selection of wavelength outside the absorption feature, as well as the absorption windows, can be found in55.
Radiometric calibration coefficient adjustment for SIF
To account for the degradation of the light source used for irradiance calibration, a cross-calibration method was used to adjust the change of radiometric calibration coefficients across years. Although the light source could be used for 50 hours based on the manufacturer, we still noticed a pattern of degradation across the years within 50 hours. This light source signal degradation would affect the estimation of SIF760 since SIF760 is an absolute light signal, while it does not affect the calculation of VIs since VIs are derived from reflectance, which is a ratio. To adjust for the degradation effect, for each site-year, we first calculated the photosynthetic active radiation (PAR) from HR2000+ by integrating the irradiance from 400 to 700 nm, then we compared HR2000+ -based PAR with a LiCor quantum sensor that was well calibrated, from which a first correction factor was obtained. Second, we compared the near-infrared irradiance from 730 to 780 nm between QEPRO and HR2000+, from which a second corrector factor was obtained. Last, the product of the first correction factor and the second correction factor was used as the final radiometric calibration coefficient adjustment factor for QEPRO (fcal-corr-QEPRO). Figure 4 shows an example of how to obtain fcal-corr-QEPRO at US-Ne2 2017 corn. Figure 5 shows the interannual variation of fcal-corr-QEPRO from 2016 to 2019 with the first light source and from 2020 to 2021 with the second one, from which an obvious degradation pattern is observed, indicated by the further increase in fcal-corr-QEPRO deviating from 1 with the used year increase. Calibration-corrected SIF760 was obtained by multiplying this fcal-corr-QEPRO to the retrieved raw SIF760.

An example showing the calculation of the calibration adjustment factor for SIF760 (fcal-corr-QEPRO) at US-Ne2 2017 corn. (a) the relationship between PAR calculated from HR2000 + spectrometer and measured PAR from LiCor quantum sensor; (b) the relationship between near-infrared irradiance integrated from 730 nm calculated from QEPRO spectrometer and that from HR2000 + . Red lines are fitted linear regression lines without intercept.

The variation of the calibration adjustment factor for SIF760 (fcal-corr-QEPRO) from 2016 to 2021. The first calibrated light source is used for irradiance calibration from 2016 to 2019, and the second one is used from 2020 to 2021.
Footprint upscaling for in-situ nadir SIF to match GPP footprint
Considering that EC footprint covers a larger area compared to nadir SIF760 and that EC footprint changes with wind direction while SIF760 target area is fixed during the data collection, we propose a method to upscale nadir SIF760 to EC footprint through high spatiotemporal satellite VIs. The rational base for this upscaling is that the product of NIRv and PAR could explain the majority of the spatiotemporal variations in SIF76056,57. PlanetScope satellite provides the surface reflectance at daily timestamp with a 3 m spatial resolution58, from which daily NIRv was calculated and used for upscaling SIF760 to EC footprint. To further reduce the soil background impact on NIRv, soil adjusted NIRv (SANIRv) was further calculated following the method in59 and used for SIF760 footprint upscaling. EC footprint models were run at half-hourly timestamps to obtain the footprint weights (wi) of each 3 m × 3 m pixel within 2 km × 2 km centered at the EC tower. SIF760 tower location was represented by one 3 m × 3 m pixel. The upscaled SIF760 was calculated based on the following equations:
where SANIRvEC footprint is calculated by the sum of the product of SANIRv (\(SANIR{v}_{i}\)) and footprint weight (wi) at each pixel i across all the pixels within the EC footprint N. SANIRvSIF pixel is the SANIRv value at the SIF tower located pixel. With the assumption that PAR did not vary within the EC footprint, i.e., \(PA{R}_{ECfootprint}=PA{R}_{ECfootprint}\), \(Rati{o}_{ECfootprint,SIFpixel}\) was calculated as the ratio of \(SANIR{v}_{ECfootprint}\) to \(SANIR{v}_{SIFpixel}\). This method also assumed that far-red fluorescence yield did not change within the EC footprint. The Simple Analytical Footprint model on Eulerian coordinates (SAFE) developed by60 was used to calculate the EC footprint weights. This upscaling was not conducted at the US-UiC 2016 soybean and US-Ne3 2019 corn sites due to the unavailability of PlanetScope data in 2016 and the missing inputs for the EC footprint model at the US-Ne3 2019 corn site. More details about the footprint upscaling process and related uncertainties can be found in Wu et al.61.
Vegetation indices estimation and SIF decomposition analysis
Several commonly used VIs including NDVI, EVI, NIRv, CIrededge, CIgreen and PRI were estimated from the hyperspectral reflectance collected by HR2000+. The reflectance beyond 800 nm was noisy, therefore, reflectance from 770 to 780 nm was used as the near-infrared reflectance. The equations for VIs calculation were shown as follows:
Raw 5-minute reflectance (R) was first averaged to half-hourly timestamp and then used for VIs calculation in order to obtain half-hourly VIs.
Based on the light use efficiency framework, SIF can be decomposed into fraction of absorbed photosynthetic active radiation (fPAR), PAR, fluorescence yield of the canopy (ΦF, canopy), escape probability from the canopy (fesc), as demonstrated in Eq. (20):
fPAR at most of the site-years were derived from in situ PAR measurements, except US-UiC 2016 soybean, US-UiC 2017 corn and US-UiC 2018 corn. Specifically, incoming PAR (PARin) and surface reflected PAR (PARout) were measured by point quantum sensors (LI-190; LICOR Bioscience, NE, USA). Transmitted PAR (PARtrans) was measured by line quantum sensors (LI-191; LICOR Bioscience) placed about 2 cm above the ground. fPARMeas and APARMeas were derived as follows:
For US-Ne2 and US-Ne3, PAR reflected by soil (PARsoil) was additionally measured by line quantum sensors facing downward. Therefore, for those two sites, fPARMeas was calculated as:
For the three site-years without PARtrans measurements, fPAR was estimated by the red edge normalized difference vegetation index (Rededge NDVI):32,52,62
This VI method for fPAR calculation was not applied at the miscanthus site since it was developed for corn and soybean.
fesc was estimated by fPAR and NIRv proposed by Zeng et al.63:
ΦF, canopy was derived from the following equation:
We quantified the contributions of fPAR, PAR, ΦF, canopy, and fesc to the variations of SIF using the relative importance method proposed by Lindeman, Merenda, and Gold (LMG)64,65 which decomposed the determination coefficient of linear regression (R2) to the contributions of each regressor. Considering the different fPAR estimation methods as well as different data availability of each site-year across the growing season (Table 2), we only focused on the peak growing season which was defined as the period when NDVI was larger than 85% of the maximum NDVI for each site-year across the growing season. The relationship between SIF760 and each VI as well as between SIF760 and the product of PAR and each VI were investigated for each species. The daytime average of SIF760 and VIs were calculated on days when more than 75% percent of the half-hourly data were available from 8 am to 6 pm local time.
Data Records
The entire dataset is saved in one csv file with data gathered from 2016 to 2021 and is available at the on ORNL DAAC data repository https://doi.org/10.3334/ORNLDAAC/213653. This dataset is openly shared, without restriction, in accordance with the Earth Observing System Data and Information System (EOSDIS) Data Use and Citation Policy (https://daac.ornl.gov/about/#citation_policy). Each row of the csv is an observation, and each column is a variable. The full dataset (SIF_VegIndices_Illinois_Nebraska_Halfhour.csv) has 37501 rows and 32 columns with the variable name shown at the first row.
-
site: sites where the data was collected, as shown in Table 1.
-
year: the year when the data was collected.
-
species: the crop type of the site-year.
-
latitude: the latitude of the site.
-
longitude: the longitude of the site.
-
timestamp_start: the start date and time of each data record shown as US Central Standard Time (CST).
-
timestamp_end: the end date and time of each data record shown as US Central Standard Time (CST).
-
doy: the day of year of each data record.
-
SIF_sFLD_raw: the raw SIF760 retrieved from irradiance and radiance using the sFLD method with unit mw m−2 nm−1 sr−1.
-
SIF_sFLD_raw_stderror: the standard error of sFLD-retrieved SIF760.
-
SIF_3FLD_raw: the raw SIF760 retrieved from irradiance and radiance using the 3FLD method with unit mw m−2 nm−1 sr−1.
-
SIF_3FLD_raw_stderror: the standard error of 3FLD-retrieved SIF760.
-
SIF_iFLD_raw: the raw SIF760 retrieved from irradiance and radiance using the iFLD method with unit mw m−2 nm−1 sr−1.
-
SIF_iFLD_raw_stderror: the standard error of iFLD-retrieved SIF760.
-
SIF_SFM_nonlinear_raw: the raw SIF760 retrieved from irradiance and radiance using the SFM method and non-linear assumption with unit mw m−2 nm−1 sr−1.
-
SIF_SFM_nonlinear_raw_stderror: the standard error of SFM-retrieved SIF760 with non-linear assumption.
-
SIF_SFM_linear_raw: the raw SIF760 retrieved from irradiance and radiance using the SFM method and linear assumption with unit mw m−2 nm−1 sr−1.
-
SIF_SFM_linear_raw_stderror: the standard error of SFM-retrieved SIF760 with linear assumption.
-
f_cal_corr_QEPRO: the radiometric calibration adjustment factor for SIF760
-
ratio_Ecfootprint_SIFpixel: the ratio EC footprint weighted SANIRv to SIF tower pixel SANIRv
-
PAR: PAR measured by quantum sensor with unit umol m−2 s−1.
-
FPAR_VI: FPAR calculated by Rededge NDVI.
-
APAR_VI: the product of FPAR_VI and PAR with unit umol m−2 s−1.
-
FPAR_measured: measured FPAR using quantum sensors.
-
APAR_measured: the product of FPAR_measured and PAR with unit umol m−2 s−1.
-
NDVI: normalized difference vegetation index
-
EVI: enhanced vegetation index
-
NIRv: near-infrared reflectance of vegetation
-
CI_red_edge: red edge chlorophyll index
-
CI_green: green chlorophyll index
-
PRI: photochemical reflection index
-
enclosure_temp: the temperature of the enclosure where the spectral system was located with unit °C.
Each data record is shown at half-hourly timestamp. −9999 is filled when no record is available.
Technical Validation
The following subsections show quality validation of the dataset53. Since direct validation of ground SIF760 is not available, we characterized the quality of SIF760 by comparing SIF760 from different methods, comparing the seasonal variations of SIF760 and VIs at each site-year, comparing the peak-season SIF760 and VIs magnitude across different species, comparing the relationship between SIF760 and different VIs, and decomposing peak-season SIF760 into structural (fPAR), radiation (PAR) and physiological (\({{\Phi }}_{F,canopy}\)) components.
Comparison of SIF760 retrievals from different methods
The enclosure temperatures at some site-years were not well controlled at 25 °C due to the high summer temperatures at our sites (air temperature up to 35 °C); therefore, we specifically compared the SIF retrievals under different enclosure temperatures. Four representative site-years were selected to cover the three species as well as different enclosure temperature ranges: US-UiC 2017 corn, US-UiC 2018 Corn, US-Ne3 2018 soy, and US-UiB 2019 Mis. When the enclosure temperature was well controlled at around 25 °C, the five methods retrieved SIF760 showed similar diurnal patterns although sFLD and 3FLD retrieved SIF760 tended to show higher values, and SFM retrieved SIF760 showed the lowest values compared to other methods under sunny days (Fig. 6a-d,f). However, on days when the enclosure temperature was above 25 °C, for corn and soybean, the two SFM methods retrieved SIF760 increased with the increase of enclosure temperature in the afternoon (Fig. 6e,g), and this pattern was not obvious in miscanthus, possibly due to the lower enclosure temperature compared to the US-UiC 2017 corn and US-Ne3 2019 soybean.

The diurnal variations of retrieved SIF760 from five methods (colored lines) and enclosure temperature (black lines) at eight representative days. The upper panel represents days when enclosure temperatures are well controlled, while the bottom panel represents days when enclosure temperatures fluctuate substantially except for US-UiC 2018 when enclosure temperature is well controlled across the whole data period.
At the seasonal scale, five methods retrieved SIF760 were strongly correlated with each other with R2 above 0.93 when the enclosure temperature was overall well controlled at around 25 °C, e.g., US-UiC 2018 corn and US-UiB 2019 miscanthus (Fig. 7), which indirectly demonstrated the reliability of our retrieved SIF76053. At the site-years with enclosure temperature reaching above 30 °C, e.g., US-UiC 2017 corn and US-Ne3 2018 soybean, FLD-based SIF760 were still strongly correlated with each other. However, SFM-based SIF760 increased with enclosure temperature which degraded the relationship between SFM-based SIF760 and iFLD-based SIF760 (Fig. 7i,m,k,o). SFM-based SIF760 with linear assumptions of SIF and R always showed the lowest correlation with other methods-based SIF760, indicating that linear assumptions of SIF and R might bring more uncertainties in SIF760 retrieval compared to other methods. Additionally, these results demonstrated that SFM-based methods were more sensitive to enclosure temperature compared to FLD-based methods, which can be explained by their algorithms. For FLD-based methods, both irradiance and radiance were used for SIF760 calculations as numerators and denominators. Enclosure temperature seemed to have similar effects on the spectrum shifts of irradiance and radiance, which cancelled each other when estimating SIF760 (Eqs. 3–6). However, for SFM-based methods, only the radiance and reflectance spectrums were used for fitting, therefore the spectral shift of radiance caused by enclosure temperature directly affected the SIF760 estimation. Based on these results, we recommend using FLD-based SIF760 when the enclosure temperature is not stable. Considering that iFLD method is more advanced compared to sFLD and 3FLD, iFLD-based SIF760 was used for further validation analysis.

The relationship between different method retrieved SIF760 under different enclosure temperatures. The relationship between iFLD SIF760 and sFLD SIF760 (first row), between iFLD SIF760 and 3FLD SIF760 (second row), between iFLD SIF760 and SFM-nonlinear SIF760 (third row), and between iFLD SIF760 and SFM-linear SIF760 (fourth row) at US-UiC 2017 corn (first column), US-UiC 2018 corn (second column), US-Ne3 2018 soy (third column) and US-UiB 2019 Mis (fourth column). Colormap represents enclosure temperature. Black lines are 1:1 line.
Variations of SIF760 in corn, soybean and miscanthus
Radiometric calibration coefficient adjustment decreased the SIF760 magnitude for site-years from 2017 to 2019 due to their lower than 1 adjustment factor (Figs. 8, 9). It also decreased the variations of SIF760 across different site-years within the same species (Fig. 9). This highlights the importance of this calibration correction since fewer variations of SIF760 within the same species are more reasonable when the environmental conditions are similar across different years. Calibration correction did not change the seasonal pattern of SIF760 at each site-year because the same adjustment factor was applied to all the data over the season. For all crops, SIF760 was near-zero at the start and end of the growing season and increased with the growth of crops and the maximum SIF760 were reached at the peak season. Upscaling nadir SIF760 to EC footprint had a marginal effect on the magnitude and seasonal pattern of SIF760 at all site-years, largely due to the relatively homogeneous field conditions in croplands (Figs. 8, 9). Overall, soybean showed slightly higher SIF760 compared to corn and miscanthus, indicated by the higher medium SIF760 during the peak growing season shown in Fig. 9. This pattern was consistent among raw SIF760, calibration-corrected SIF760 and footprint-upscaled SIF760. Considering that corn had higher GPP compared to soybean, the slightly lower SIF760 combining with higher GPP in corn resulted in different SIF760 – GPP relationships between corn and soybean reported in a previous study66.

Seasonal variation of daytime average SIF760 from local time 8 am to 6 pm at each site-year. Grey, blue, and red circles represent raw iFLD SIF760, calibration corrected iFLD SIF760, and calibration + footprint corrected iFLD SIF760.

Histogram and Gaussian kernel estimate (KDE) density of peak season half-hourly raw iFLD SIF760 (grey), calibration corrected iFLD SIF760 (blue) and calibration + footprint corrected SIF760 (red) in (a) corn, (b) soybean, and (c) miscanthus.
Variations of VIs in corn, soybean and miscanthus
The six VIs showed overall similar seasonal patterns at each site-year, with lower values shown at the early and late growing seasons and higher values at the peak season, consistent with the seasonal pattern of SIF760 (Fig. 10). NDVI showed a saturated pattern at the peak season. CIrededege and CIgreen showed similar but larger seasonal variations compared to the other VIs with CIgreen being noisier than CIrededge. Canopy PRI was strongly affected by canopy structure at the seasonal scale; therefore, it showed similar seasonal patterns as EVI and NIRv. Among the three species, soybean showed overall higher peak-season NDVI, NIRv, EVI, and PRI, and corn and miscanthus showed similar magnitudes for these four VIs (Fig. 11). This pattern was consistent with SIF760 that higher peak-season SIF760 was found in soybean compared to corn and miscanthus. For CIrededge, corn showed the highest magnitude followed by soybean and miscanthus. Since CIrededge was calculated with 720–730 nm, the relationship between CIrededge and canopy chlorophyll content was generic for corn and soybean, therefore, higher CIrededge in corn indicated higher canopy chlorophyll content in corn49. For CIgreen, the magnitude ranged as soybean > corn > miscanthus. Among the three species, the magnitude of peak-season SIF760 was consistent with that of peak-season NDVI, NIRv, and EVI, demonstrating the dominance of the canopy structure on the SIF760 signal at crop sites. The overall consistent pattern of SIF760 and VIs among corn, soybean and miscanthus indirectly justified the reliability of our retrieved SIF760 and VIs53.

Seasonal variations of daytime average VIs from 8 am to 6 pm at each site-year. Different VIs are represented by different colours, with NDVI by grey circles, EVI by blue circles, NIRv by yellow circles, CIrededge divided by 10 by green circles, CIgreen divided by 10 by cyan circles, and PRI by red circles. CIrededge and CIgreen were divided by 10 to match the magnitude of the other VIs.

Boxplot of peak season half-hourly NDVI, EVI, NIRv, CIrededge divided by 10, CIgreen divided by 10, and PRI in corn (orange), soybean (yellow), and miscanthus (green).
Relationships between VIs, APAR and SIF760
Previous studies have demonstrated the dominant role of canopy structure and PAR in interpretating canopy SIF760 signal31,67. To further validate our SIF760 and VIs dataset53, we examined the relationship between SIF760 and VIs as well as between SIF760 and VI × PAR, and decomposed peak-season SIF760 into structural, radiation and physiological information. As expected, SIF760 and VIs were poorly correlated at the half-hourly scale, with R2 ranging from 0.20 to 0.40 across three species and six VIs (Fig. 12). Averaging to the daily scale (daytime average) improved the correlation between SIF760 and VIs with R2 ranging from 0.39 to 0.51. Incorporating PAR information substantially improved the correlation between SIF760 and VIs at both half-hourly and daily scales with R2 ranging from 0.56 to 0.88 (Fig. 12). The product of PAR and three structural VIs (NDVI, EVI, and NIRv) showed the highest correlations with SIF760, followed by the product of PAR and two chlorophyll indices (CIrededge, CIgreen), while the product of PRI and PAR showed the lowest correlation with SIF760. This demonstrates the importance of structural information in SIF760 at crop sites, as reported in previous studies31,33. NIRv did not outperform NDVI and EVI in terms of the correlation with SIF760, largely because NDVI and EVI were ratios that were less affected by the calibration process across different site-years while NIRv relied on the near-infrared absolute reflectance which showed larger variations across different site-years. The strong relationship between SIF760 and the product of structural VIs and PAR further indirectly supported the credibility of our SIF760 and VIs dataset53.

Relationship between calibration corrected iFLD SIF760, VI and the product of VI and PAR (VI × PAR) in corn, soybean, and miscanthus. All data available for the same species are combined for this analysis.
Peak-season half-hourly SIF760 was dominated by APAR for all three species(Fig. 13), consistent with the results reported in earlier studies31,33. The slightly lower R2 in miscanthus was due to the SIF760 midday depression under high vapor pressure deficit (VPD), air temperature and PAR conditions30. During the peak season when the canopy structure was stable, the contributions of fPAR and fesc to half-hourly SIF760 signal were marginal (Fig. 14). PAR and ΦF, canopy explained 52–62% and 24–31% of half-hourly SIF760 variations across three species, respectively. This confirmed the contribution of physiological variation to the SIF760 signal in cropland, and this physiological component of SIF760 is important to capture the early and short-term crop response to stresses68. A recent study utilizing part of this SIF760, and VIs dataset has found that ΦF, canopy has the advantage of capturing the physiological responses of crops to water deficit and high temperature over structural proxies such as NIRv57.

Relationship between peak-season half-hourly APAR and calibration corrected iFLD SIF760 in (a) corn, (b) soybean, and (c) miscanthus. APAR is calculated from VI (Rededge NDVI) in corn and soybean (APARVI), while APAR is measured in miscanthus (APARMeas).

The relative importance of PAR, fPAR, fesc, and ΦF, canopy to peak season calibration-corrected iFLD SIF760 for corn, soybean, and miscanthus calculated from the LMG method.
In conclusion, the collective evidence from all the indirect validation methods employed supports the high quality of our dataset. These validation techniques, encompassing various analytical approaches and comparisons, have collectively corroborated the reliability of the data53 we have gathered.
Usage Notes
To facilitate the effective reuse of our shared far-red SIF and VIs dataset53 by other researchers, we provide the following guidelines:
-
(1)
We recommend the use of the iFLD-based SIF760 retrieval for our dataset. This recommendation is based on our findings that FLD-based SIF760 retrieval exhibits lesser sensitivity to enclosure temperature variations compared to the SFM-based retrieval, and the iFLD method demonstrates enhanced sophistication over the sFLD and the 3FLD.
-
(2)
Adjusting the radiometric coefficients caused by the degradation of calibrating light source through cross-validation was essential to provide a consistent and less variable SIF760 estimate across different site-years.
-
(3)
Upscaling ground nadir SIF760 to eddy covariance flux footprint may not be necessary in the context of our dataset. This is due to the relatively homogeneous field conditions typical of cropland environments.
-
(4)
This dataset could serve as valuable ground validation for satellite products, as well as for modelling related to both radiative transfer and ecosystem dynamics. Additionally, this dataset can be combined with ancillary measurements at leaf and canopy scales to improve the interpretation and understanding of the SIF signal as well as the relationship between SIF and photosynthesis.
Code availability
The code implementation was done in Matlab (2017a). The functions for far-red SIF and VIs estimation used in this study are available at https://github.com/wugh16/SIF_VI_process_functions.git. The far-red SIF and VIs data is available at https://doi.org/10.3334/ORNLDAAC/213653.
References
Baker, N. R. Chlorophyll Fluorescence: A Probe of Photosynthesis In Vivo. Annu. Rev. Plant Biol. 59, 89–113 (2008).
Porcar-Castell, A. et al. Linking chlorophyll a fluorescence to photosynthesis for remote sensing applications: Mechanisms and challenges. J. Exp. Bot. 65, 4065–4095 (2014).
Porcar-Castell, A. et al. Chlorophyll a fluorescence illuminates a path connecting plant molecular biology to Earth-system science. Nat. Plants 7, 998–1009 (2021).
Meroni, M. et al. Remote sensing of solar-induced chlorophyll fl uorescence: Review of methods and applications. 113, 2037–2051 (2009).
Maxwell, K. & Johnson, G. N. Chlorophyll fluorescence—a practical guide. J. Exp. Bot. 51, 659–668 (2000).
Murchie, E. H. & Lawson, T. Chlorophyll fluorescence analysis: A guide to good practice and understanding some new applications. J. Exp. Bot. 64, 3983–3998 (2013).
Mohammed, G. H. et al. Remote sensing of solar-induced chlorophyll fluorescence (SIF) in vegetation: 50 years of progress. Remote Sens. Environ. 231, 111177 (2019).
Frankenberg, C. & Berry, J. Solar Induced Chlorophyll Fluorescence: Origins, Relation to Photosynthesis and Retrieval. Comprehensive Remote Sensing (Elsevier, 2018).
Frankenberg, C. et al. New global observations of the terrestrial carbon cycle from GOSAT: Patterns of plant fluorescence with gross primary productivity. Geophys. Res. Lett. 38, 1–22 (2011).
Joiner, J. et al. Global monitoring of terrestrial chlorophyll fluorescence from moderate-spectral-resolution near-infrared satellite measurements: methodology, simulations, and application to GOME-2. Atmos. Meas. Tech. 6, 2803–2823 (2013).
Sun, Y. et al. OCO-2 advances photosynthesis observation from space via solar-induced chlorophyll fluorescence. Science (80-.). 358, eaam5747 (2017).
Köhler, P., Guanter, L. & Joiner, J. A linear method for the retrieval of sun-induced chlorophyll fluorescence from GOME-2 and SCIAMACHY data. Atmos. Meas. Tech. 8, 2589–2608 (2015).
Köhler, P. et al. Global Retrievals of Solar-Induced Chlorophyll Fluorescence With TROPOMI: First Results and Intersensor Comparison to OCO-2. Geophys. Res. Lett. 45, 456–463 (2018).
Guanter, L. et al. Global and time-resolved monitoring of crop photosynthesis with chlorophyll fluorescence. Proc. Natl. Acad. Sci. 111, E1327–E1333 (2014).
Li, X. et al. Solar-induced chlorophyll fluorescence is strongly correlated with terrestrial photosynthesis for a wide variety of biomes: First global analysis based on OCO-2 and flux tower observations. Glob. Chang. Biol. 24, 3990–4008 (2018).
Zhang, Z. et al. Reduction of structural impacts and distinction of photosynthetic pathways in a global estimation of GPP from space-borne solar-induced chlorophyll fluorescence. Remote Sens. Environ. 240, 111722 (2020).
Guan, K. et al. Improving the monitoring of crop productivity using spaceborne solar-induced fluorescence. Glob. Chang. Biol. 22, 716–726 (2016).
He, L. et al. From the Ground to Space: Using Solar-Induced Chlorophyll Fluorescence to Estimate Crop Productivity. Geophys. Res. Lett. 47, 1–12 (2020).
Peng, B. et al. Assessing the benefit of satellite-based Solar-Induced Chlorophyll Fluorescence in crop yield prediction. Int. J. Appl. Earth Obs. Geoinf. 90, 102126 (2020).
Sun, Y. et al. Drought onset mechanisms revealed by satellite solar-induced chlorophyll fluorescence: Insights from two contrasting extreme events. J. Geophys. Res. Biogeosciences 120, 2427–2440 (2015).
Song, L. et al. Satellite sun‐induced chlorophyll fluorescence detects early response of winter wheat to heat stress in the Indian Indo‐Gangetic Plains. Glob. Chang. Biol. 24, 4023–4037 (2018).
Kimm, H. et al. Quantifying high-temperature stress on soybean canopy photosynthesis: The unique role of sun-induced chlorophyll fluorescence. Glob. Chang. Biol. 27, 2403–2415 (2021).
Pacheco-Labrador, J. et al. Sun-induced chlorophyll fluorescence I: Instrumental considerations for proximal spectroradiometers. Remote Sens. 11, (2019).
Aasen, H. et al. Sun-induced chlorophyll fluorescence II: Review of passive measurement setups, protocols, and their application at the leaf to canopy level. Remote Sens. 11, (2019).
Baldocchi, D. D. Assessing the eddy covariance technique for evaluating carbon dioxide exchange rates of ecosystems: Past, present and future. Glob. Chang. Biol. 9, 479–492 (2003).
Chu, H. et al. Representativeness of Eddy-Covariance flux footprints for areas surrounding AmeriFlux sites. Agric. For. Meteorol. 301–302, 108350 (2021).
Liu, X., Liu, L., Hu, J. & Du, S. Modeling the footprint and equivalent radiance transfer path length for tower-based hemispherical observations of chlorophyll fluorescence. Sensors (Switzerland) 17, 1–15 (2017).
Yang, X. et al. Solar-induced chlorophyll fluorescence that correlates with canopy photosynthesis on diurnal and seasonal scales in a temperate deciduous forest. Geophys. Res. Lett. 42, (2015).
Paul-Limoges, E. et al. Effect of environmental conditions on sun-induced fluorescence in a mixed forest and a cropland. Remote Sens. Environ. 219, 310–323 (2018).
Wu, G. et al. Attributing differences of solar-induced chlorophyll fluorescence (SIF)-gross primary production (GPP) relationships between two C4 crops: corn and miscanthus. Agric. For. Meteorol. 323, 109046 (2022).
Yang, K. et al. Sun-induced chlorophyll fluorescence is more strongly related to absorbed light than to photosynthesis at half-hourly resolution in a rice paddy. Remote Sens. Environ. 216, 658–673 (2018).
Yang, P., van der Tol, C., Campbell, P. K. E. & Middleton, E. M. Unraveling the physical and physiological basis for the solar- induced chlorophyll fluorescence and photosynthesis relationship using continuous leaf and canopy measurements of a corn crop. Biogeosciences 18, 441–465 (2021).
Dechant, B. et al. Canopy structure explains the relationship between photosynthesis and sun-induced chlorophyll fluorescence in crops. Remote Sens. Environ. 241, (2020).
Wu, G. et al. Difference in seasonal peak timing of soybean far-red SIF and GPP explained by canopy structure and chlorophyll content. Remote Sens. Environ. 279, 113104 (2022).
Wang, C. et al. Satellite footprint data from OCO-2 and TROPOMI reveal significant spatio-temporal and inter-vegetation type variabilities of solar-induced fluorescence yield in the U.S. Midwest. Remote Sens. Environ. 241, 111728 (2020).
Cogliati, S. et al. Continuous and long-term measurements of reflectance and sun-induced chlorophyll fluorescence by using novel automated field spectroscopy systems. Remote Sens. Environ. 164, 270–281 (2015).
Porcar-Castell, A. et al. EUROSPEC: At the interface between remote-sensing and ecosystem CO2 flux measurements in Europe. Biogeosciences 12, 6103–6124 (2015).
Yang, X. et al. FluoSpec 2—an automated field spectroscopy system to monitor canopy solar-induced fluorescence. Sensors (Switzerland) 18, (2018).
Grossmann, K. et al. Remote Sensing of Environment PhotoSpec: A new instrument to measure spatially distributed red and far- red Solar-Induced Chlorophyll Fluorescence. Remote Sens. Environ. 216, 311–327 (2018).
Gu, L., Wood, J. D., Chang, C. Y. Y. Y.-Y., Sun, Y. & Riggs, J. S. Advancing Terrestrial Ecosystem Science With a Novel Automated Measurement System for Sun-Induced Chlorophyll Fluorescence for Integration With Eddy Covariance Flux. Networks. J. Geophys. Res. Biogeosciences 124, 127–146 (2019).
Du, S. et al. SIFSpec: Measuring Solar-Induced Chlorophyll Fluorescence Observations for Remote Sensing of Photosynthesis. Sensors 19, 3009 (2019). 2019, Vol. 19, Page 3009.
Zhang, Q., Zhang, X., Li, Z., Wu, Y. & Zhang, Y. Comparison of Bi-Hemispherical and Hemispherical-Conical Configurations for In Situ Measurements of Solar-Induced Chlorophyll Fluorescence. Remote Sens. 11, 2642 (2019). 2019, Vol. 11, Page 2642.
Li, Z. et al. Solar-induced chlorophyll fluorescence and its link to canopy photosynthesis in maize from continuous ground measurements. Remote Sens. Environ. 236, (2020).
Gamon, J. A. et al. Spectral Network (SpecNet)-What is it and why do we need it? Remote Sens. Environ. 103, 227–235 (2006).
Zhang, Y. Y. et al. ChinaSpec: A Network for Long-Term Ground-Based Measurements of Solar-Induced Fluorescence in China. J. Geophys. Res. Biogeosciences 126, (2021).
Rouse, J., Haas, R. H., Schell, J. A. & Deering, D. Monitoring vegetation systems in the great plains with ERTS. in In 3rd ERTS Symposium, NASA 309–317 (1973).
Huete, A. R., Liu, H. Q. & Batchily, K. & Van Leeuwen, W. A comparison of vegetation indices over a global set of TM images for EOS-MODIS. Remote Sens. Environ. 59, 440–451 (1997).
Badgley, G., Field, C. B. & Berry, J. A. Canopy near-infrared reflectance and terrestrial photosynthesis. Sci. Adv. 3, 1602244 (2017).
Gitelson, A. A., Viña, A., Ciganda, V., Rundquist, D. C. & Arkebauer, T. J. Remote estimation of canopy chlorophyll content in crops. Geophys. Res. Lett. 32, (2005).
Gamon, J. A., Serrano, L. & Surfus, J. S. The photochemical reflectance index: An optical indicator of photosynthetic radiation use efficiency across species, functional types, and nutrient levels. Oecologia 112, 492–501 (1997).
Heaton, E. A. et al. Miscanthus. A Promising Biomass Crop. in Advances in Botanical Research vol. 56 75–137 (2010).
Miao, G. et al. Sun-Induced Chlorophyll Fluorescence, Photosynthesis, and Light Use Efficiency of a Soybean Field from Seasonally Continuous Measurements. J. Geophys. Res. Biogeosciences 123, 610–623 (2018).
Wu, G., Guan, K., Kimm, H., Miao, G. & Jiang. C. SIF and Vegetation Indices in the US Midwestern Agroecosystems, 2016-2021. ORNL Distributed Active Archive Center https://doi.org/10.3334/ORNLDAAC/2136 (2023).
Alonso, L. et al. Improved Fraunhofer Line Discrimination Method for Vegetation Fluorescence Quantification. IEEE Geosci. Remote Sens. Lett. 5, 620–624 (2008).
Cendrero-Mateo, M. P. et al. Sun-induced chlorophyll fluorescence III: Benchmarking retrieval methods and sensor characteristics for proximal sensing. Remote Sens. 11, 962 (2019).
Dechant, B. et al. NIRVP: A robust structural proxy for sun-induced chlorophyll fluorescence and photosynthesis across scales. Remote Sens. Environ. 268, (2022).
Kimm, H. et al. A physiological signal derived from sun-induced chlorophyll fluorescence quantifies crop physiological response to environmental stresses in the U.S. Corn Belt. Environ. Res. Lett. 16, 124051 (2021).
Houborg, R. & McCabe, M. F. High-Resolution NDVI from Planet’s Constellation of Earth Observing Nano-Satellites: A New Data Source for Precision Agriculture. Remote Sens. 8, 768 (2016). 2016, Vol. 8, Page 768.
Jiang, C., Guan, K., Wu, G., Peng, B. & Wang, S. A daily, 250 m, and real-time gross primary productivity product (2000 – present) covering the Contiguous United States. Earth Syst. Sci. Data 1786, (2020).
Chen, B. et al. Assessing tower flux footprint climatology and scaling between remotely sensed and eddy covariance measurements. Boundary-Layer Meteorol. 130, 137–167 (2009).
Wu, G. et al. Can upscaling ground nadir SIF to eddy covariance footprint improve the relationship between SIF and GPP in croplands? Agric. For. Meteorol. 338, 109532 (2023).
Viña, A. & Gitelson, A. A. New developments in the remote estimation of the fraction of absorbed photosynthetically active radiation in crops. Geophys. Res. Lett. 32, 1–4 (2005).
Zeng, Y. et al. A practical approach for estimating the escape ratio of near-infrared solar-induced chlorophyll fluorescence. Remote Sens. Environ. 232, 111209 (2019).
Grömping, U. Estimators of relative importance in linear regression based on variance decomposition. Am. Stat. 61, 139–147 (2007).
Miao, G. et al. Varying Contributions of Drivers to the Relationship Between Canopy Photosynthesis and Far-Red Sun-Induced Fluorescence for Two Maize Sites at Different Temporal Scales. J. Geophys. Res. Biogeosciences 125, 1–17 (2020).
Liu, L., Guan, L. & Liu, X. Directly estimating diurnal changes in GPP for C3 and C4 crops using far-red sun-induced chlorophyll fluorescence. Agric. For. Meteorol. 232, 1–9 (2017).
Dechant, B. et al. Canopy structure explains the relationship between photosynthesis and sun-induced chlorophyll fluorescence in crops. (2019).
Berger, K. et al. Multi-sensor spectral synergies for crop stress detection and monitoring in the optical domain: A review. Remote Sens. Environ. 280, 113198 (2022).
Acknowledgements
G.W., K.G., and H.K., acknowledge the support from NASA New Investigator Award and NASA Carbon Monitoring System program managed by the NASA Terrestrial Ecology Program. GW and KG are supported by NASA Future Investigators in NASA Earth and Space Science and Technology (FINESST) Program. G.W., K.G. and C.J. acknowledge the support from the DOE Center for Advanced Bioenergy and Bioproducts Innovation (U.S. Department of Energy, Office of Science, Office of Biological and Environmental Research under Award Number DE-SC0018420). K.G. and C.J. acknowledge the support from the Advanced Research Projects Agency–Energy (ARPA-E), US Department of Energy, under award number DE-AR0001382. We thank Dr. Andy Suyker for the Nebraska field sites management and support, and Dr. Carl Bernacchi for the Illinois field sites support. We thank M. Pilar Cendrero-Mateo for sharing code for SIF retrieval using 3FLD, iFLD and SFM-nonlinear.
Author information
Authors and Affiliations
Contributions
K.G. managed the overall project, organized field work and design. G.W., H.K., and G.M. collected the data. G.W. and C.J. processed the data. X.Y. designed the spectral system. G.W. wrote the first draft and all authors contributed to the revision of the manuscript and data interpretation.
Corresponding author
Ethics declarations
Competing interests
The authors declare no competing interests.
Additional information
Publisher’s note Springer Nature remains neutral with regard to jurisdictional claims in published maps and institutional affiliations.
Rights and permissions
Open Access This article is licensed under a Creative Commons Attribution 4.0 International License, which permits use, sharing, adaptation, distribution and reproduction in any medium or format, as long as you give appropriate credit to the original author(s) and the source, provide a link to the Creative Commons licence, and indicate if changes were made. The images or other third party material in this article are included in the article’s Creative Commons licence, unless indicated otherwise in a credit line to the material. If material is not included in the article’s Creative Commons licence and your intended use is not permitted by statutory regulation or exceeds the permitted use, you will need to obtain permission directly from the copyright holder. To view a copy of this licence, visit http://creativecommons.org/licenses/by/4.0/.
About this article

Cite this article
Wu, G., Guan, K., Kimm, H. et al. Ground far-red sun-induced chlorophyll fluorescence and vegetation indices in the US Midwestern agroecosystems. Sci Data 11, 228 (2024). https://doi.org/10.1038/s41597-024-03004-w
Received:
Accepted:
Published:
DOI: https://doi.org/10.1038/s41597-024-03004-w
