
Abstract
The science of science has attracted growing research interests, partly due to the increasing availability of large-scale datasets capturing the innerworkings of science. These datasets, and the numerous linkages among them, enable researchers to ask a range of fascinating questions about how science works and where innovation occurs. Yet as datasets grow, it becomes increasingly difficult to track available sources and linkages across datasets. Here we present SciSciNet, a large-scale open data lake for the science of science research, covering over 134M scientific publications and millions of external linkages to funding and public uses. We offer detailed documentation of pre-processing steps and analytical choices in constructing the data lake. We further supplement the data lake by computing frequently used measures in the literature, illustrating how researchers may contribute collectively to enriching the data lake. Overall, this data lake serves as an initial but useful resource for the field, by lowering the barrier to entry, reducing duplication of efforts in data processing and measurements, improving the robustness and replicability of empirical claims, and broadening the diversity and representation of ideas in the field.
Background & Summary
Modern databases capturing the innerworkings of science have been growing exponentially over the past decades, offering new opportunities to study scientific production and use at larger scales and finer resolution than previously possible. Fuelled in part by the increasing availability of large-scale datasets, the science of science community turns scientific methods on science itself1,2,3,4,5,6, helping us understand in a quantitative fashion a range of important questions that are central to scientific progress—and of great interest to scientists themselves—from the evolution of individual scientific careers7,8,9,10,11,12,13,14,15,16,17,18 to collaborations19,20,21,22,23,24,25 and science institutions26,27,28 to the evolution of science2,3,5,29,30,31,32,33,34 to the nature of scientific progress and impact35,36,37,38,39,40,41,42,43,44,45,46,47,48,49,50,51,52,53,54,–55.
Scholarly big data have flourished over the past decade, with several large-scale initiatives providing researchers free access to data. For example, CiteSeerX56, one of the earliest digital library search engines, offers a large-scale scientific library focusing on the literature in computer and information science. Building on a series of advanced data mining techniques, AMiner57 indexes and integrates a wide range of data about academic social networks58. Crossref (https://www.crossref.org/)59, as well as other initiatives in the open metadata community, have collected metadata such as Digital Object Identifier (DOI) in each publication record and linked them to a broad body of event data covering scholarly discussions. OpenAlex (https://openalex.org/)60, based on Microsoft Academic Graph (MAG)61,62,63, aims to build a large-scale open catalog for the global research system, incorporating scholarly entities and their connections across multiple datasets. In addition to data on scientific publications and citations capturing within-science dynamics, researchers have also tracked interactions between science and other socioeconomic spheres by tracing, for example, how science is referenced in patented inventions64,65,66, regarding both front-page and in-text citations from patents to publications67,68. Table 1 summarizes several exemplary datasets commonly used in the science of science literature, with information on their coverage and accessibility.
The rapid growth of the science of science community69,70,71, combined with its interdisciplinary nature, raises several key challenges confronting researchers in the field. First, it becomes increasingly difficult to keep track of available datasets and their potential linkages across disparate sources, raising the question of whether there are research questions that are underexplored simply due to a lack of awareness of the data. Second, as data and their linkages become more complex, there are substantial data pre-processing steps involved prior to analyses. Many of these steps are often too detailed to document in publications, with researchers making their own analytical choices when processing the data. Third, as tools and techniques used in the science of science grow in sophistication, measurements on these datasets can be computationally involved, requiring substantial investment of time and resources to compute these measures.
All these challenges highlight the need for a common data resource designed for research purposes, which could benefit the community in several important ways. First, it provides a large-scale empirical basis for research, helping to strengthen the level of evidence supporting new findings as well as increase the replicability and robustness of these findings. Second, it helps to reduce duplication of efforts across the community in data preprocessing and common measurements. Third, by compiling various datasets, linkages, and measurements, the data resource significantly lowers the barrier to entry, hence has the potential to broaden the diversity and representation of new ideas in the field.
To support these needs in the community, we present SciSciNet, a large-scale open data lake for the science of science research. The data lake not only incorporates databases that capture scientific publications, researchers, and institutions, but also tracks their linkages to related entities, ranging from upstream funding sources like NIH and NSF to downstream public uses, including references of scientific publications in patents, clinical trials, and media and social media mentions (see Fig. 1 and Table 2 for more details of entities and their relationships). Building on this collection of linked databases, we further calculate a series of commonly used measurements in the science of science, providing benchmark measures to facilitate further investigations while illustrating how researchers can further contribute collectively to the data lake. Finally, we validate the data lake using multiple approaches, including internal data validation, cross-database verification, as well as reproducing canonical results in the literature.

The entity relationship diagram of SciSciNet. SciSciNet includes “SciSciNet_Papers” as the main data table, with linkages to other tables capturing data from a range of sources. For clarity, here we show a subset of the tables (see Data Records section for a more comprehensive view of the tables). PK represents primary key, and FK represents foreign key.
The data lake, SciSciNet, is freely available at Figshare72. At the core of the data lake is the Microsoft Academic Graph (MAG) dataset61,62,63. The MAG data is one of the largest and most comprehensive bibliometrics data in the world, and a popular dataset for the science of science research. However, MAG was sunset by Microsoft at the end of 2021. Since then, there have also been several important efforts in the community to ensure the continuity of data and services. For example, there are mirror datasets73 available online for MAG, and the OpenAlex (https://openalex.org) initiative builds on the MAG data, and not only makes it open to all but also provides continuous updates60. While these efforts have minimized potential disruptions, the sunsetting of MAG has also accelerated the need to construct open data resources designed for research purposes. Indeed, large-scale systematic datasets for the science of science mostly come in the form of raw data, which requires further data pre-processing and filtering operations to extract fine-grained research data with high quality. It usually takes substantial efforts and expertise to clean the data, and many of these steps are often too detailed to document in publications, with researchers making their own analytical choices. It thus suggests that there is value in constructing an open data lake, which aims to continue to extend the usefulness of MAG, with substantial data pre-processing steps documented. Moreover, the data lake links together several disparate sources and pre-computed measures commonly used in the literature, serving as an open data resource for researchers interested in the quantitative studies of science and innovation.
Importantly, the curated data lake is not meant to be exhaustive; rather it represents an initial step toward a common data resource to which researchers across the community can collectively contribute. Indeed, as more data and measurements in the science of science become available, researchers can help to contribute to the continuous improvement of this data lake by adding new data, measurements, and linkages, thereby further increasing the utility of the data lake. For example, if a new paper reports a new measurement, the authors could publish a data file linking the new measurement with SciSciNet IDs, which would make it much easier for future researchers to build on their work.
Methods
Data selection and curation from MAG
The Microsoft Academic Graph (MAG) dataset61,62,63 covers a wide range of publication records, authors, institutions, and citation records among publications. MAG has a rich set of prominent features, including the application of advanced machine learning algorithms to classify fields of study in large-scale publication records, identify paper families, and disambiguate authors and affiliations. Here we use the edition released on December 6th, 2021 by MAG, in total covering 270,694,050 publication records.
The extensive nature of the MAG data highlights a common challenge. Indeed, using the raw data for research often requires substantial pre-processing and data-cleaning steps to arrive at a research-ready database. For example, one may need to perform a series of data selection and curation operations, including the selection of scientific publications with reliable sources, aggregation of family papers, and redistribution of citation and reference counts. After going through these steps, one may generate a curated publication data table, which serves as the primary scientific publication data table in SciSciNet (Table 3, “SciSciNet_Papers”). However, each of these steps requires us to make specific analytical choices, but given the detailed nature of these steps, the specific choices made through these steps have remained difficult to document through research publications.
Here we document in detail the various procedures we took in constructing the data lake. From the original publication data in MAG, we use MAG Paper ID as the primary key, and consider a subset of main attributes, including DOI (Digital Object Identifier), document type and publication year. As we are mainly interested in scientific publications within MAG, we first remove paper records whose document type is marked as patent. We also remove those with neither document type nor DOI information. Each scientific publication in the database may be represented by different entities (e.g., preprint and conference), indicated as a paper “family” in MAG. To avoid duplication, we aggregate all papers in the same family into one primary paper. We also do not include retracted papers in the primary paper table in SciSciNet. Instead, we include records of retracted papers and affiliated papers in paper families in another data table “SciSciNet_PaperDetails” (Table 8) linked to the primary paper table, recording information of DOIs, titles, original venue names, and original counts for citations and references in MAG. Following these steps, the primary data table “SciSciNet_Papers” contains 134,129,188 publication records with unique primary paper ids, including 90,764,813 journal papers, 4,629,342 books, 3,932,366 book chapters, 5,123,597 conference papers, 145,594 datasets, 3,083,949 repositories, 5,998,509 thesis papers, and 20,451,018 other papers with DOI information.
For consistency, we recalculate the citation and reference counts within the subset of 134 M primary papers, such that each citation or reference record is also included in this subset and can be found in “SciSciNet_PaperReferences” (Table 5). For papers in the same family, we aggregate their citations and references into the primary paper and drop duplicated citation pairs. Building on the updated citations, we recalculate the number of references and citations for each primary paper.
MAG also contains information of authors, institutions, and fields. While author disambiguation58,74,75,76,77,78,79 remains a major challenge, we adopt the author disambiguation method from MAG and create an author table, which offers a baseline for future studies of individual careers. We also supplement the author table with empirical name-gender associations to support gender research80, drawing from work by Van Buskirk et al.80; this allows us to build “SciSciNet_Authors_Gender” (Table 9) with 134,197,162 author records including their full names.
For fields, we use the fields of study records from MAG and focus on the records related to the selected primary papers (19 Level-0 fields and 292 Level-1 fields, Table 6). We incorporate this information into two tables, the “SciSciNet_PaperAuthorAffiliations” (Table 4) and “SciSciNet_PaperFields” (Table 7), with 413,869,501 and 277,494,994 records, respectively.
We further use the information of “PaperExtendedAttributes” table from MAG to construct high-quality linkages between MAG Paper ID and PubMed Identifier (PMID). We drop duplicate links by only keeping the MAG primary paper record (if one PMID was linked to multiple MAG Paper IDs) or the latest updated PubMed record (if one MAG Paper ID was linked to multiple PMIDs), obtaining 31,230,206 primary MAG Paper ID-PMID linkages (95.6% of the original records) to further support linkage with external sources.
Together, the resulting SciSciNet includes 134,129,188 publications (Table 3), 134,197,162 authors (Table 9), 26,998 institutions (Table 10), 49,066 journals (Tables 21), 4,551 conference series (Tables 22), 19 top-level fields of study, 292 subfields (Table 6), and the internal links between them, including 1,588,739,703 paper-references records (Table 5), 413,869,501 paper-author-affiliations records (Table 4), and 277,494,994 paper-fields records (Table 7).
Linking publication data with external sources
While the main paper table captures citation relationships among scientific publications, there has been growing interest in studying how science interacts with other socioeconomic institutions35,36,41,55,81,82. Here, we further trace references of scientific publications in data sources that go beyond publication datasets, tracking the linkage between papers to their upstream funding supports and downstream uses in public domains. Specifically, here we link papers to the grants they acknowledge in NSF and NIH, as well as public uses of science by tracking references of scientific publications in patents, clinical trials, and news and social media.
NIH funding
The National Institutes of Health (NIH) is the largest public funder for biomedical research in the world. The recent decade has witnessed increasing interest in understanding the role of NIH funding for the advancement of biomedicine81,82 and its impact on individual career development83,84. NIH ExPORTER provides bulk NIH RePORTER (https://report.nih.gov/) data on research projects funded by the NIH and other major HHS operating divisions. The database also provides link tables (updated on May 16, 2021) that connects funded projects with resulting publications over the past four decades.
To construct the funded project-paper linkages between SciSciNet Paper ID and NIH Project Number, we use the PMID of MAG papers (from our previously curated “PaperExtendedAttributes” table based on MAG) as the intermediate key, matching more than 98.9% of the original NIH link table records to primary Paper ID in SciSciNet. After dropping duplicate records, we end up with a collection of 6,013,187 records (Table 11), linking 2,636,061 scientific papers (identified by primary MAG Paper IDs) to 379,014 NIH projects (identified by core NIH-funded project numbers).
NSF funding
Beyond biomedical research, the National Science Foundation (NSF) funds approximately 25% of all federally supported basic research conducted by the United States’ colleges and universities across virtually all fields of science and engineering. NSF provides downloadable information on research projects it has funded, including awardee, total award amount, investigator, and so forth, but no information on funded research publications. While Federal RePORTER offers downloadable files on NSF awards with links to supported publications (662,072 NSF award-publication records by 2019), it only covers a limited time period and has been retired by March 2022. To obtain a more comprehensive coverage of records linking NSF awards to supported papers, we crawl the webpages of all NSF awards to retrieve information on their resulting publications. In particular, we first created a comprehensive list of all NSF award numbers from https://www.nsf.gov/awardsearch/download.jsp. We then iterate over this list to download the entire webpage document of each NSF award (from the URL https://www.nsf.gov/awardsearch/showAward?AWD_ID = [Award number]), and use “Publications as a result of this research” column to identify scientific publications related to this award. We then extract paper titles and relevant information provided by using the Python library ElementTree to navigate and parse the webpage document structurally. We end up collecting 489,446 NSF awards since 1959 (Table 20), including linkages between 131,545 awards and 1,350,915 scientific publications.
To process information crawled from NSF.gov, which is presented as raw text strings, we design a text-based multi-level matching process to link NSF awards to SciSciNet scientific publications:
-
(1)
For records with DOI information in the raw texts of funded research publications, we perform an exact match with SciSciNet primary papers through DOI. If the DOI in an NSF publication record matched that of one primary paper, we create a linkage between the NSF Award Number and the primary Paper ID. We matched 458,463 records from NSF awards to SciSciNet primary papers, where each DOI appeared only once in the entire primary paper table, thus enabling association with a unique Paper ID (exact match). After dropping duplicates where the same DOI appears repeatedly in the same NSF award, we yield 350,611 records (26.0%) from NSF awards to SciSciNet primary papers.
-
(2)
To process the rest of the records, we then use the title information of each article for further matching. After extracting the title from NSF records and performing a standardization procedure (e.g., converting each letter into lowercase and removing punctuation marks, extra spaces, tabs, and newline characters), our exact matches between paper titles in the NSF award data and SciSciNet primary paper data yield 246,701 unique matches (18.3% in total) in this step.
-
(3)
We further develop a search engine for records that have not been matched in the preceding steps. Here we use Elasticsearch, a free and open search and analytics engine, to index detailed information (paper title, author, journal or conference name, and publication year) of all SciSciNet primary papers. We then feed raw texts of the crawled NSF publications into the system and obtain results with the top two highest scores associated with the indexed primary papers. Similar to a previous study55, we use scores of the second matched primary papers as a null model, and then identify the first matched primary paper as a match if its score is significantly higher than the right-tail cutoff of the second score distribution (P = 0.05). Following this procedure, we match the remaining 467,159 records (34.6%) from the two previous steps with significantly higher scores (Fig. 2a). Note that this procedure likely represents a conservative strategy that prioritizes precision over recall. Manually inspecting the rest of potential matchings, we find that those with large differences between the top two Z-scores (Fig. 2b) are also likely to be correct matches. To this end, we also include these heuristic links, together with the difference of their Z-scores, as fuzzy matching linkages between SciSciNet papers and NSF awards.
Fig. 2 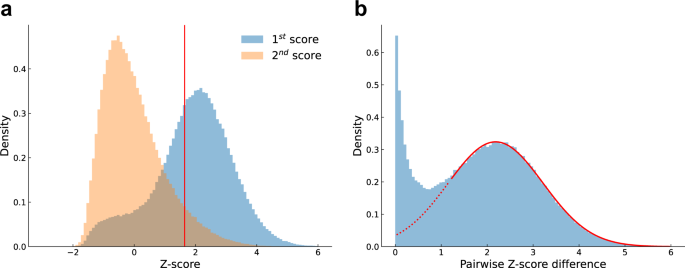
Matching NSF reference string to MAG records. (a) Distribution of Z-scores for papers matched in ElasticSearch with the first and second highest scores. The vertical red line denotes the right-tail cutoff of the second score distribution (P = 0.05). (b) Distribution of pairwise Z-score differences for papers matched in search engine but with the first score no higher than the right-tail cutoff of the second score distribution (P = 0.05).
-
(4)
We further supplement these matchings with information from Crossref data dump, an independent dataset that links publications to over 30 K funders including NSF. We collect all paper-grant pairs where the funder is identified as NSF. We then use the raw grant number from Crossref and link paper records between Crossref and SciSciNet using DOIs. We obtain 305,314 records after cleaning, including 196,509 SciSciNet primary papers with DOIs matching to 83,162 NSF awards.

By combining records collected from all these steps, we collect 1,130,641 unique linkages with high confidence levels and 178,877 additional possible linkages from fuzzy matches (Table 12). Together these links connect 148,148 NSF awards and 929,258 SciSciNet primary papers.
Patent citations to science
The process in which knowledge transfers from science to marketplace applications has received much attention in science and innovation literature35,41,85,86,87,88. The United States Patent and Trademark Office (USPTO) makes patenting activity data publicly accessible, with the PatentsView platform providing extensive metadata including as related to patent assignees, inventors, and lawyers, along with patents’ internal citations and full-text information. The European Patent Office (EPO) also provides open access to patent data containing rich attributes.
Building on recent advances in linking papers to patents35,67,68, Marx and Fuegi developed a large-scale dataset of over 40 M citations from USPTO and EPO patents to scientific publications in MAG. Using this corpus (Version v34 as of December 24, 2021), we merge 392 K patent citation received by affiliated MAG papers to their respective primary IDs in the same paper family. Dropping possible duplicate records with the same pair of primary Paper ID and Patent ID results in 38,740,313 paper-patent citation pairs between 2,360,587 patents from USPTO and EPO and 4,627,035 primary papers in SciSciNet (Table 15).
Clinical trials citations to science
Understanding bench-to-bed-side translation is essential for biomedical research81,89. ClinicalTrials.gov provides publicly available clinical study records covering 50 U.S. states and 220 countries, sourced from the U.S. National Library of Medicine. The Clinical Trials Transformation Initiative (CTTI) makes available clinical trials data through a database for Aggregate Analysis of ClinicalTrials.gov (AACT), an aggregated relational database helping researchers better study drugs, policies, publications, and other related items to clinical trials.
Overall, the data covers 686,524 records linking clinical trials to background or result papers (as of January 26th, 2022). We select 480,893 records with papers as reference background supporting clinical trials, of which 451,357 records contain 63,281 unique trials matching to 345,797 reference papers with PMIDs. Similar to the process of linking scientific publications to NIH-funded projects, we again establish linkages between SciSciNet primary Paper ID and NCT Number (National Clinical Trial Number) via PMID, aided by the curated “PaperExtendedAttributes” table as the intermediary. After standardizing the data format of the intermediate index PMID to merge publications and clinical trials, we obtain 438,220 paper-clinical linkages between 61,447 NCT clinical trials and 337,430 SciSciNet primary papers (Table 13).
News and social mentions of science
Understanding how science is mentioned in media has been another important research direction in the science of science community44,90. The Newsfeed mentions in Crossref Event Data link scientific papers in Crossref59 with DOIs to news articles or blog posts in RSS and Atom feeds, providing access to the latest scientific news mentions from multiple sources, including Scientific American, The Guardian, Vox, The New York Times, and others. Also, Twitter mentions in Crossref Event Data link scientific papers to tweets created by Twitter users, offering an opportunity to explore scientific mentions in Twitter.
We use the Crossref Event API to collect 947,160 records between 325,396 scientific publications and 387,578 webpages from news blogs or posts (from April 5th, 2017 to January 16th, 2022) and 59,593,281 records between 4,661,465 scientific publications and 58,099,519 tweets (from February 7th, 2017 to January 17th, 2022).
For both news media and social media mentions, we further link Crossref’s publication records to SciSciNet’s primary papers. To do so, we first normalize the DOI format of these data records and converted all alphabetic characters to lowercase. We use normalized DOI as the intermediate index, as detailed below:
For news media mentions, we construct linkages between primary Paper ID and Newsfeed Object ID (i.e., the webpage of news articles or blog posts) by inner joining normalized DOIs. We successfully link 899,323 records from scientific publications to news webpages in the Newsfeed list, accounting for 94.9% of the total records. The same news mention may be collected multiple times. After removing duplicate records, we end up with 595,241 records, linking 307,959 papers to 370,065 webpages from Newsfeed (Table 17).
Similarly, for social media mentions, we connect primary Paper IDs with Tweet IDs through inner joining normalized DOIs, yielding 56,121,135 records, more than 94% of the total records. After dropping duplicate records, we keep 55,846,550 records, linking 4,329,443 papers to 53,053,505 tweets (Table 16).
We also provide metadata of paper-news linkages, including the mention time and the detailed mention information in Newsfeed, to better support future research on this topic (Table 18). Similarly, we also offer the metadata of paper-tweet links, including the mention time and the original collected Tweet ID so that interested researchers can merge with further information from Twitter using the Tweet ID (Table 19).
Nobel Prize data from the dataset of publication records for Nobel laureates
We integrate a recent dataset by Li et al.91 in the data lake, containing the publication records of Nobel laureates in science from 1900 to 2016, including both Nobel prize-winning works and other papers produced in their careers. After mapping affiliated MAG Paper IDs to primary ones, we obtain 87,316 publication records of Nobel laureates in SciSciNet primary paper Table (20,434 in physics, 38,133 in chemistry, and 28,749 in physiology/medicine, Table 14).
Calculation of commonly used measurements
Using the constructed dataset, we further calculate a range of commonly used measurements of scientific ideas, impacts, careers, and collaborations. Interested readers can find more details and validations of these measurements in the literature15,19,20,46,47,48,92,93,94,95,96,97,98.
Publication-level
The number of researchers and institutions in a scientific paper
Building on team science literature19,27, we calculate the number of authors and the number of institutions for each paper as recorded in our data lake. We group papers by primary Paper ID in the selected “SciSciNet_PaperAuthorAffiliations” table and aggregate the unique counts of Author IDs and Affiliation IDs as the number of researchers (team size) and institutions, respectively.
Five-year citations (c 5), ten-year citations (c 10), normalized citation (c f), and hit paper
The number of citations of a paper evolves over time46,48,99,100. Here we calculate c5 and c10, defined as the number of citations a paper received within 5 years and 10 years of publication, respectively. For the primary papers, we calculate c5 for all papers published up to 2016 (As the last version of MAG publication data is available until 2021) by counting the number of citation pairs with time difference less than or equal to 5 years. Similarly, we calculate c10 for all papers published up to 2011.
To compare citation counts across disciplines and time, Radicchi et al.48 proposed the relative citation indicator cf, as the total number of citations c divided by the average number of citations c0 in the same field and the same year. Here we calculate the normalized citation indicator for each categorized paper in both top-level fields and subfields, known as Level-0 fields (19 in total) and Level-1 fields (292 in total) categorized by MAG, respectively. Note that each paper may be associated with multiple fields, hence here we report calculated normalized citations for each paper-field pair in the “SciSciNet_PaperFields” data table.
Another citation-based measure widely used in the science of science literature16,19,83 is “hit papers”, defined as papers in the top 5% of citations within the same field and year. Similar to our calculation of cf, we use the same grouping by fields and years, and identify all papers with citations greater than the top 5% citation threshold. We also perform similar operations for the top 1% and top 10% hit papers.
Citation dynamics
A model developed by Wang, Song, and Barabási (the WSB model)46 captures the long-term citation dynamics of individual papers after incorporating three fundamental mechanisms, including preferential attachment, aging, and fitness. The model predicts the cumulative citations received by paper i at time t after publication: \({c}_{i}^{t}=m\left[{e}^{{{\rm{\lambda }}}_{i}\Phi \left(\frac{lnt-{{\rm{\mu }}}_{i}}{{{\rm{\sigma }}}_{i}}\right)}-1\right]\), where Φ(x) is the standard cumulative normal distribution of x, m captures the average number of references per paper, and μi, σi, and λi indicate the immediacy, longevity, and fitness parameters characterizing paper i, respectively.
We implement the WSB model with prior for papers published in the fields of math and physics. Following the method proposed by Shen et al.92, we adopt the Bayesian approach to calculate the conjugate prior, which follows a gamma distribution. The method allows us to better predict the long-term impact through the posterior estimation of λi, while helping to avoid potential overfitting problems. Fitting this model to empirical data, we compute the immediacy μi, the longevity σi, and the ultimate impact \({c}_{{\rm{i}}}^{\infty }={\rm{m}}\left[{e}^{{{\rm{\lambda }}}_{i}}-1\right]\) for all math and physics papers with at least 10 citations within 10 years after publication (published no later than 2011). To facilitate research on citation dynamics across different fields48, we have also used the same procedure to fit the citation sequences for papers that have received at least 10 citations within 10 years across all fields of study from the 1960s to the 1990s.
Sleeping beauty coefficient
Sometimes it may take years or even decades for papers to gain attention from the scientific community, a phenomenon known as the “Sleeping Beauty” in science93. The sleeping beauty coefficient B is defined as \({\rm{B}}={\sum }_{t=0}^{{t}_{m}}\frac{\frac{{c}_{{t}_{m}}-{c}_{0}}{{t}_{m}}\cdot t+{c}_{0}-{c}_{t}}{{\rm{\max }}\left(1,{c}_{t}\right)}\), where the paper receives its maximum yearly citation \({c}_{{t}_{m}}\) in year tm and c0 in the year of publication. Here we calculate the sleeping beauty coefficient from yearly citation records of a paper. We match the publication years for each citing-cited paper pair published in journals and then aggregate yearly citations since publication for each cited paper. Next, we group the “SciSciNet_PaperReferences” table by each cited paper and compute the coefficient B, along with the awakening time. As a result, we obtain 52,699,363 records with sleeping beauty coefficients for journal articles with at least one citation.
Novelty and conventionality
Research shows that the highest-impact papers in science tend to be grounded in exceptionally conventional combinations of prior work yet simultaneously feature an intrusion of atypical combinations47. Here following this work47, we calculate the novelty and conventionality score of each paper by computing the Z-score for each combination of journal pairs. We further calculate the distribution of journal pair Z-scores by traversing all possible duos of references cited by a particular paper. A paper’s median Z-score characterizes the median conventionality of the paper, whereas a paper’s 10th percentile Z-score captures the tail novelty of the paper’s atypical combinations.
More specifically, we first use the information of publication years for each citing-cited paper pair both published in journals and shuffle the reference records within the citing-cited year group to generate 10 randomized citation networks, while controlling the naturally skewed citation distributions. We then traverse each focal paper published in the same year. We further aggregate the frequency of reference journal pairs for papers in the real citation network and 10 randomized citation networks, calculating the Z-score of each reference journal pair for papers published in the same year. Finally, for each focal paper, we obtain its 10th percentile and median of the Z-scores distribution, yielding 44,143,650 publication records with novelty and conventionality measures for journal papers from 1950 to 2021.
Disruption score
Disruption index quantifies the extent to which a paper disrupts or develops the existing literature20,51. Disruption, or D, is calculated through citation networks. For a given paper, one can separate its future citations into two types. One type only cites the focal paper itself while ignoring all the references that the paper builds upon, and the other is to cite both the focal paper and its references. D is expressed as: \({\rm{D}}={{\rm{p}}}_{{\rm{i}}}-{{\rm{p}}}_{{\rm{j}}}=\frac{{n}_{i}-{n}_{j}}{{n}_{i}+{n}_{j}+{n}_{k}}\), where ni is the number of subsequent works that only cite the focal paper, nj is the number of subsequent works that cite both the focal paper and its references, and nk is the number of subsequent works that cite the references of the focal paper only. Following this definition, we calculate the disruption scores for all the papers that have at least one forward and backward citation (48,581,274 in total).
The number of NSF and NIH supporting grants
For external linkages from scientific publications to upstream supporting funding sources, we calculate the number of NSF/NIH grants associated with each primary paper in SciSciNet.
The number of patent citations, Newsfeed mentions, Twitter mentions, and clinical trial citations
For external linkages from scientific publications to downstream public uses of science, we also calculate the number of citations each primary paper in SciSciNet received from domains that go beyond science, including patents from USPTO and EPO, news and social media mentions from Newsfeed and Twitter, and clinical trials from ClinicalTrials.gov.
Individual- and Institutional-level measures
Productivity
Scientific productivity is a widely used measure for quantifying individual careers9,15. Here we aggregate the unique primary Paper ID in SciSciNet, after grouping the records in the “SciSciNet_PaperAuthorAffiliations” data table by Author ID or Affiliation ID and calculate the number of publications produced by the same author or affiliation.
H-index
H-index is a popular metric to estimate a researcher’s career impact. The index of a scientist is h, if h of her papers have at least h citations and each of the remaining papers have less than h citations94,101. Here we compile the full publication list associated with each author, sort these papers by their total number of citations in descending order, and calculate the maximum value that satisfies the condition above as the H-index. By repeating the same procedure on each research institution, we also provide an institution-level H-index as well.
Scientific impact
Building on our c10 measure at the paper level, here we further calculate the average c10 (<c10>) for each author and affiliation, which offers a proxy to individual and institutional level scientific impact. Similarly, we calculate the average logc10 (<logc10>), which is closely related to the Q parameter15 of individual scientific impact.
Here we group by Author and Affiliation ID in the “PaperAuthorAffiliations” table, and then aggregate c10 and logc10 (pre-calculated at the paper level) of all papers published by the same id. Following previous works15,16,102, to avoid taking logarithm of zeros, we increase c10 by one when calculating the <logc10>.
Name-gender associations
The availability of big data also enables a range of studies focusing on gender disparities, ranging from scientific publications and careers17,103,104,105,106 to collaboration patterns25,107 and the effects of the pandemic on women scientists45,108,109,110. Here we apply the method from a recent statistical model80 to infer author gender based on their first names in the original author table. The method feeds unique author names into a cultural consensus model of name-gender associations incorporating 36 separate sources across over 150 countries. Note that for all the 134,197,162 authors, 23.26% of the authors (31,224,458) have only the first initials, which are excluded from the inference. By fine-tuning the annotated names from these data sources following the original method, we obtain 409,809 unique names with max uncertainty threshold set to 0.26 and 85% of the sample classified. Finally, we merge these name-gender inference records into the original SciSciNet_Authors table, resulting a SciSciNet_Authors_Gender table, which contains 86,286,037 authors with inferred probability that indicates a name belongs to an individual gendered female, denoted as P(gf), as well as the number of inference source datasets and empirical counts. Together, by combining new statistical models with our systematic authorship information, this new table provides name-gender information, useful in studying gender-related questions. It is important to note that such name-based gender inference algorithms, including the one used here as well as other popular tools such as genderize.io, have limitations and are necessarily imperfect. The limitations should be considered carefully when applying these methods96.
Data Records
The data lake, SciSciNet, is freely available at Figshare72.
Data structure
Table 2 presents the size and descriptions of these data files.
Table 3 contains information about “SciSciNet_Papers”, which is the data lake’s primary paper table, containing information on the primary scientific publications, including Paper ID, DOI, and others, along with the Journal ID or Conference Series ID, which can link papers to corresponding journals or conference series that take place regularly. The short description in each data field includes the corresponding explanation of that field.
Tables 4–22 include the data fields and corresponding descriptions of each data table. Each data field specified is clear from its index name. An ID of the data field in a data table can be linked, if this field has the same ID name as another field in another table. Further, the data link tables provide linkages from scientific publications to external socioeconomic institutions. For example, the paper with primary “PaperID” as “246319838”, which studied the hereditary spastic paraplegia111, lead to three core NIH project number “R01NS033645”, “R01NS036177”, and “R01NS038713” in the Table 11 “SciSciNet_Link_NIH”. We can not only extract detailed information and metrics of the paper in the data lake (e.g., title from Table 8 “SciSciNet_PaperDetails”, or citation counts from the primary paper Table 3 “SciSciNet_Papers”) but also obtain further information of the funded-projects, such as the total funding amount, from NIH RePORTER (https://report.nih.gov).
Descriptive statistics
Next, we present a set of descriptive statistics derived from the data lake. Figure 3a–c show the distribution of papers across 19 top-level fields, the exponential growth of scientific publications in SciSciNet over time, and the average team size of papers by field over time.

Summary statistics of scientific publications in SciSciNet. (a) The number of publications in 19 top-level fields. For clarity we aggregated the field classification into the top level (e.g., a paper is counted as a physics paper if it is associated with physics or any other subfields of physics). (b) The exponential growth of science over time. (c) Average team size by field from 1950 to 2020. The bold black line is for papers in all the 19 top-level fields. Each colored line indicates each of the 19 fields (color coded according to (a)).
Building on the external linkages we constructed, Fig. 4a–f show the distribution of paper-level upstream funding sources from NIH and NSF, and downstream applications and mentions of science, including USPTO/EPO patents, clinical trials, news mentions from Newsfeed, and social media mentions from Twitter.

Linking scientific publications with socioeconomic institutions. Panels (a,b and d,e) show the distribution of paper-level downstream applications (a: Twitter mentions; b: Newsfeed mentions; d: Patents; e: Clinical trials). Panels (c and f) show the distribution of supporting scientific grants from NIH (c) and NSF (f).
Figure 5 presents the probability distributions of various commonly used metrics in the science of science using our data lake, which are broadly consistent with the original studies in the literature.

Commonly used metrics in SciSciNet. (a) The distribution of disruption score for 48,581,274 papers20 (50,000 bins in total). (b) Cumulative distribution function (CDF) of 44,143,650 journal papers’ 10th percentile and median Z-scores47. (c) Distribution of \({e}^{{\rm{\langle }}log{c}_{\mathrm{10}}{\rm{\rangle }}}\) for scholars15 with at least 10 publications in SciSciNet. The red line corresponds to a log-normal fit with μ = 2.14 and σ = 1.14. (d) Survival distribution function of sleeping beauty coefficients93 for 52,699,363 papers, with a power-law fit: exponent α = 2.40. (e) Data collapse for a selected subset of papers with more than 30 citations within 30 years across journals in physics in the 1960s, based on WSB model46. The red line corresponds to the cumulative distribution function of the standard normal distribution.
Technical Validation
Validation of publication and citation records
As we select the primary papers from the original MAG dataset, we have re-counted the citations and references within the subset of primary papers. To test the reliability of updated citation and reference counts in SciSciNet, here we compare the two versions (i.e., raw MAG counts and redistributed SciSciNet counts), by calculating the Spearman correlation coefficients for both citations and references. The Spearman correlation coefficients are 0.991 for citations and 0.994 for references, indicating that these metrics are highly correlated before and after the redistribution process.
We also examine the coverage of our publication data through a cross-validation with an external dataset, Dimensions112. By using DOI as a standardized identifier, we find that the two databases contain a similar number of papers, with 106,517,016 papers in Dimensions and 98,795,857 papers in SciSciNet associated with unique DOIs. We further compare the overlap of the two databases, finding the two data sources share a vast majority of papers in common (84,936,278 papers with common DOIs, accounting for 79.74% of Dimensions and 85.97% of SciSciNet).
Further, the citation information recorded by the two datasets appears highly consistent. Within the 84.9 M papers we matched with common DOIs, SciSciNet records a similar, yet slightly higher number of citations on average (16.75), compared with Dimensions (14.64). Our comparison also reveals a high degree of consistency in paper-level citation counts between the two independent corpora, with a Spearman correlation coefficient 0.946 and a concordance coefficient98,113 of 0.940. Together, these validations provide further support for the coverage of the data lake.
Validation of external data linkages
We further perform additional cross-validation to understand the reliability of data linkages from scientific publications to external data sources. Here we focus more on the NSF-SciSciNet publications linkages we created from raw data collection to final data linkage. We also use the same approach to validate the NIH-SciSciNet publications linkages.
Here we compare the distribution and coverage of paper-grants linkages between SciSciNet and Dimensions—one of the state-of-the-art commercial databases in publication-grant linkages112. Figure 6a,b present the distribution of the number of papers matched to each NSF award and NIH grant, showing that our open-source approach offers a comparable degree of coverage. We further perform individual grant level analysis, by comparing the number of papers matched to each grant reported by the two sources (Fig. 6c,d), again finding high degrees of consistency (Spearman correlation coefficient: 0.973 for NIH grants and 0.714 for NSF grants).

Validation of data linkages between SciSciNet and Dimensions. Panels (a,b), The distribution of number of papers matched to each NIH and NSF grant, respectively. Panels (c,d), The number of papers matched to each NIH and NSF grant, respectively. All panels are based on data in a 20-year period (2000–2020).
We further calculate the confusion matrices of linkage from SciSciNet and Dimensions. By connecting the two datasets through paper DOIs and NSF/NIH grant project numbers, we compare their overlaps and differences in grant-paper pairs. For NSF, the confusion matrix is shown in Table 23. The two datasets provide a similar level of coverage, with Dimensions containing 670,770 pairs and SciSciNet containing 632,568 pairs. 78.9% pairs in Dimensions (and 83.7% pairs in SciSciNet) can be found in the other dataset, documenting a high degree of consistency between the two sources. While there are data links contained in Dimensions that are not in SciSciNet, we also find that there exists a similar amount of data records in SciSciNet but not in Dimensions. Table 24 shows the confusion matrix of NIH grant-paper pairs between the two datasets. Again, the two datasets share a vast majority of grant-paper pairs in common, and 95.3% pairs in Dimensions (and 99.7% pairs in SciSciNet) can also be found in the other dataset. These validations further support the overall quality and coverage of data linkages in SciSciNet.
Validation of calculations of commonly used measurements
We also seek to validate the calculated metrics included in SciSciNet. In addition to manual inspection of independent data samples during data processing, along with presenting the corresponding distributions of indicators in the Descriptive statistics section, which capture general patterns, we further double-check the calculation results of these popular measurements in SciSciNet by reproducing canonical results in the science of science under a series of standardized and transparent processes.
Disruption
For disruption scores, we plot the median disruption percentile and average citations on different team sizes for 48,581,274 publications with at least one citation and reference record in SciSciNet. As shown in Fig. 7a, when team size increases, the disruption percentile decreases while the average citations increase, which is consistent with the empirical findings that small teams disrupt whereas large teams develop20. In addition, the probability of being among the top 5% disruptive publications is negatively correlated with the team size, while the probability of being among the most impactful publications increases is positively correlated with the team size (Fig. 7b). These results demonstrate the consistency with results obtained in the literature.

Calculating commonly used measurements in the science of science literature. (a,b), Small teams disrupt while large teams develop in SciSciNet. (c), The cumulative distribution functions (CDFs) of proportion of external citations for papers with high (top 10,000, B > 307.55), medium (from 10,001st to top 2% SBs, 33< B < = 307.55); and low (B < = 33) sleeping beauty indexes. (d), The probability of a 5% hit paper, conditional on novelty and conventionality for all journal articles in SciSciNet from 1950 to 2000.
Novelty and conventionality
The combinations of conventional wisdom and atypical knowledge tend to predict a higher citation impact47. Here we repeat the original analysis by categorizing papers based on (1) median conventionality: whether the median score of a paper is in the upper half and (2) tail novelty: whether the paper is within the top 10th percentile of novelty score. We then identified hit papers (within the subset of our analysis), defined as papers rank in the top 5% of ten-year citations within the same top-level field and year. The four quadrants in Fig. 7d suggest that papers with high median conventionality and high tail novelty present a higher hit rate of 7.32%, within the selection of SciSciNet papers published from 1950 to 2000. Also, papers with high median conventionality but low tail novelty show a hit rate of 4.18%, roughly similar to the baseline rate of 5%, while those with low median conventionality but high tail novelty display a hit rate of 6.48%. Meanwhile, papers with both low median conventionality and low tail novelty exhibit a hit rate of 3.55%. These results are broadly consistent with the canonical results reported in47.
WSB model
In Fig. 5e, we select 36,802 physics papers published in the 1960s with more than 30 citations within 30 years of publication. By rescaling their citation dynamics using the fitted parameters, we find a remarkable collapse of rescaled citation dynamics which appears robust across fields and decades. We further validate the predictive power of the model with prior based on Shen et al.92, by calculating the out-of-sample prediction accuracy. We find that with a training period of 15 years, the predictive accuracy (defined as a strict absolute tolerance threshold of 0.1) stays above 0.65 for 10 years after the training period, and the Mean Absolute Percentage Error (MAPE) is less than 0.1. The MAPE stays less than 0.15 for 20 years after the training period.
Sleeping beauty
We first fit the distribution of the sleeping beauty coefficients in SciSciNet (Fig. 5d) to a power-law form using maximum likelihood estimation114, obtaining a power-law exponent α = 2.40 and minimum value Bm = 23.59. By using fine-grained subfield information provided by MAG, we further calculate the proportion of external citations. Consistent with the original study93, we find that papers with high B scores are more likely to have a higher proportion of external citations from other fields (Fig. 7c).
Usage Notes
Note that, recognizing the recent surge of interest in quantitative understanding of science95,97,98,115,116, the measurements currently covered in the data lake are not meant to be comprehensive; rather they serve as examples to illustrate how researchers from the broader community can collectively contribute and enrich the data lake. There are also limitations of the data lake that readers should keep in mind when using the data lake. For example, our grant-publication linkage is focused on scientific papers supported by NSF and NIH; patent-publication linkage is limited to citations from USPTO and EPO patents; clinical trial-publication linkage is derived from clinitrials.gov (where the geographical distribution may be heterogenous across countries, Table 25); and media-publication linkage is based on sources tracked by Crossref. Further, while our data linkages are based on state-of-the-art methods of data extraction and cleaning, as with any matching, the methods are necessarily imperfect and may be further improved through integration with complementary commercial products such as Altmetric and Dimensions. Finally, our data inherently represents a static snapshot, drawing primarily from the final edition of MAG (Dec 2021 version). While this snapshot is already sufficient in answering many of the research questions that arise in the field, future work may engage in continuous improvement and update of the data lake to maximize its potential.
Overall, this data lake serves as an initial step for serving the community in studying publications, funding, and broader impact. At the same time, there are also several promising directions for future work expanding the present effort. For example, the rapid development in natural language processing (NLP) models and techniques, accompanied by the increasing availability of text information from scientific articles, offers new opportunities to collect and curate more detailed content information. For example, one can link SciSciNet to other sources such as OpenAlex or Semantic Scholar to analyze large-scale data of abstract, full-text, or text-based embeddings. Such efforts will not only enrich the metadata associated with each paper, but also enable more precise identification and linkage of bio/chemical entities studied in these papers117. Further, although platforms like MAG have implemented advanced algorithms for name disambiguation and topic/field classification at scale, these algorithms are inherently imperfect and not necessarily consistent across datasets, hence it is essential to further validate and improve the accuracy of name disambiguation and topic classifications118. Related, in this paper we primarily focus on paper-level linkages across different datasets. Using these linkages as intermediary information, one can further construct and enrich individual-level profiles, allowing us to combine professional information (e.g., education background, grants, publications, and other broad impact) of researchers with important demographic dimensions (e.g., gender, age, race, and ethnicity). Finally, the data lake could contribute to an ecosystem for the collective community of the science of science. For example, there are synergies with the development of related programming packages, such as pySciSci119. By making the data lake fully open, we also hope it inspires other researchers to contribute to the data lake and enrich its coverage. For example, when a research team publishes a new measure, they could put out a data file that computes their measure based on SciSciNet, effectively adding a new column to the data lake. Lastly, science forms a complex social system and often offers an insightful lens to examine broader social science questions, suggesting that the SciSciNet may see greater utility by benefiting adjacent fields such as computational social science120,121, network science122,123, complex systems124, and more125.
Code availability
The source code for data selection and curation, data linkage, and metrics calculation is available at https://github.com/kellogg-cssi/SciSciNet.
References
Liu, L., Jones, B. F., Uzzi, B. & Wang, D. Measurement and Empirical Methods in the Science of Science. Nature Human Behaviour, https://doi.org/10.1038/s41562-023-01562-4 (2023).
Fortunato, S. et al. Science of science. Science 359, eaao0185 (2018).
Wang, D. & Barabási, A.-L. The science of science. (Cambridge University Press, 2021).
Zeng, A. et al. The science of science: From the perspective of complex systems. Physics reports 714, 1–73 (2017).
Azoulay, P. et al. Toward a more scientific science. Science 361, 1194–1197 (2018).
Clauset, A., Larremore, D. B. & Sinatra, R. Data-driven predictions in the science of science. Science 355, 477–480 (2017).
Liu, L., Dehmamy, N., Chown, J., Giles, C. L. & Wang, D. Understanding the onset of hot streaks across artistic, cultural, and scientific careers. Nature communications 12, 1–10 (2021).
Jones, B. F. The burden of knowledge and the “death of the renaissance man”: Is innovation getting harder? The Review of Economic Studies 76, 283–317 (2009).
Way, S. F., Morgan, A. C., Clauset, A. & Larremore, D. B. The misleading narrative of the canonical faculty productivity trajectory. Proceedings of the National Academy of Sciences 114, E9216–E9223, https://doi.org/10.1073/pnas.1702121114 (2017).
Jones, B. F. & Weinberg, B. A. Age dynamics in scientific creativity. Proceedings of the National Academy of Sciences 108, 18910–18914 (2011).
Malmgren, R. D., Ottino, J. M. & Amaral, L. A. N. The role of mentorship in protege performance. Nature 465, 622–U117 (2010).
Liénard, J. F., Achakulvisut, T., Acuna, D. E. & David, S. V. Intellectual synthesis in mentorship determines success in academic careers. Nature communications 9, 1–13 (2018).
Petersen, A. M. et al. Reputation and Impact in Academic Careers. Proceedings of the National Academy of Science USA 111, 15316–15321 (2014).
Ma, Y., Mukherjee, S. & Uzzi, B. Mentorship and protégé success in STEM fields. Proceedings of the National Academy of Sciences 117, 14077–14083 (2020).
Sinatra, R., Wang, D., Deville, P., Song, C. M. & Barabasi, A. L. Quantifying the evolution of individual scientific impact. Science 354 (2016).
Liu, L. et al. Hot streaks in artistic, cultural, and scientific careers. Nature 559, 396–399 (2018).
Larivière, V., Ni, C., Gingras, Y., Cronin, B. & Sugimoto, C. R. Bibliometrics: Global gender disparities in science. Nature News 504, 211 (2013).
Sugimoto, C. R. et al. Scientists have most impact when they’re free to move. Nature 550, 29–31 (2017).
Wuchty, S., Jones, B. F. & Uzzi, B. The increasing dominance of teams in production of knowledge. Science 316, 1036–1039 (2007).
Wu, L., Wang, D. & Evans, J. A. Large teams develop and small teams disrupt science and technology. Nature 566, 378–382, https://doi.org/10.1038/s41586-019-0941-9 (2019).
Milojevic, S. Principles of scientific research team formation and evolution. Proceedings of the National Academy of Sciences 111, 3984–3989 (2014).
Newman, M. E. The structure of scientific collaboration networks. Proceedings of the National Academy of Sciences 98, 404–409 (2001).
AlShebli, B. K., Rahwan, T. & Woon, W. L. The preeminence of ethnic diversity in scientific collaboration. Nature communications 9, 1–10 (2018).
Shen, H.-W. & Barabási, A.-L. Collective credit allocation in science. Proceedings of the National Academy of Sciences 111, 12325–12330 (2014).
Leahey, E. From Sole Investigator to Team Scientist: Trends in the Practice and Study of Research Collaboration. Annual Review of Sociology, Vol 42 42, 81–100 (2016).
Clauset, A., Arbesman, S. & Larremore, D. B. Systematic inequality and hierarchy in faculty hiring networks. Science advances 1, e1400005 (2015).
Jones, B. F., Wuchty, S. & Uzzi, B. Multi-university research teams: shifting impact, geography, and stratification in science. science 322, 1259–1262 (2008).
Deville, P. et al. Career on the move: Geography, stratification, and scientific impact. Scientific reports 4 (2014).
Chu, J. S. & Evans, J. A. Slowed canonical progress in large fields of science. Proceedings of the National Academy of Sciences 118 (2021).
Azoulay, P., Fons-Rosen, C. & Graff Zivin, J. S. Does science advance one funeral at a time? American Economic Review 109, 2889–2920 (2019).
Jin, C., Ma, Y. & Uzzi, B. Scientific prizes and the extraordinary growth of scientific topics. Nature communications 12, 1–11 (2021).
Nagaraj, A., Shears, E. & de Vaan, M. Improving data access democratizes and diversifies science. Proceedings of the National Academy of Sciences 117, 23490–23498 (2020).
Evans, J. A. & Reimer, J. Open access and global participation in science. Science 323, 1025–1025 (2009).
Peng, H., Ke, Q., Budak, C., Romero, D. M. & Ahn, Y.-Y. Neural embeddings of scholarly periodicals reveal complex disciplinary organizations. Science Advances 7, eabb9004 (2021).
Ahmadpoor, M. & Jones, B. F. The dual frontier: Patented inventions and prior scientific advance. Science 357, 583–587 (2017).
Yin, Y., Gao, J., Jones, B. F. & Wang, D. Coevolution of policy and science during the pandemic. Science 371, 128–130 (2021).
Ding, W. W., Murray, F. & Stuart, T. E. Gender differences in patenting in the academic life sciences. science 313, 665–667 (2006).
Bromham, L., Dinnage, R. & Hua, X. Interdisciplinary research has consistently lower funding success. Nature 534, 684 (2016).
Larivière, V., Vignola-Gagné, E., Villeneuve, C., Gélinas, P. & Gingras, Y. Sex differences in research funding, productivity and impact: an analysis of Québec university professors. Scientometrics 87, 483–498 (2011).
Li, D., Azoulay, P. & Sampat, B. N. The applied value of public investments in biomedical research. Science 356, 78–81 (2017).
Fleming, L., Greene, H., Li, G., Marx, M. & Yao, D. Government-funded research increasingly fuels innovation. Science 364, 1139–1141, https://doi.org/10.1126/science.aaw2373 (2019).
Lazer, D. M. et al. The science of fake news. Science 359, 1094–1096 (2018).
Scheufele, D. A. & Krause, N. M. Science audiences, misinformation, and fake news. Proceedings of the National Academy of Sciences 116, 7662–7669 (2019).
Kreps, S. E. & Kriner, D. L. Model uncertainty, political contestation, and public trust in science: Evidence from the COVID-19 pandemic. Science advances 6, eabd4563 (2020).
Myers, K. R. et al. Unequal effects of the COVID-19 pandemic on scientists. Nature Human Behaviour https://doi.org/10.1038/s41562-020-0921-y (2020).
Wang, D. S., Song, C. M. & Barabasi, A. L. Quantifying Long-Term Scientific Impact. Science 342, 127–132 (2013).
Uzzi, B., Mukherjee, S., Stringer, M. & Jones, B. Atypical combinations and scientific impact. Science 342, 468–472 (2013).
Radicchi, F., Fortunato, S. & Castellano, C. Universality of citation distributions: Toward an objective measure of scientific impact. Proceedings of the National Academy of Sciences 105, 17268–17272 (2008).
de Solla Price, D. J. Networks of Scientific Papers. Science 149, 510–515 (1965).
Price, D. d. S. A general theory of bibliometric and other cumulative advantage processes. Journal of the American society for Information science 27, 292–306 (1976).
Funk, R. J. & Owen-Smith, J. A Dynamic Network Measure of Technological Change. Management Science 63, 791–817 (2017).
Thelwall, M., Haustein, S., Larivière, V. & Sugimoto, C. R. Do altmetrics work? Twitter and ten other social web services. PloS one 8 (2013).
Wang, R. et al. in Proceedings of the 27th ACM International Conference on Information and Knowledge Management 1487–1490 (Association for Computing Machinery, Torino, Italy, 2018).
Tan, Z. et al. in Proceedings of the 25th International Conference Companion on World Wide Web 437–442 (International World Wide Web Conferences Steering Committee, Montréal, Québec, Canada, 2016).
Yin, Y., Dong, Y., Wang, K., Wang, D. & Jones, B. F. Public use and public funding of science. Nature Human Behaviour https://doi.org/10.1038/s41562-022-01397-5 (2022).
Wu, J. et al. CiteSeerX: AI in a Digital Library Search Engine. AI Magazine 36, 35–48, https://doi.org/10.1609/aimag.v36i3.2601 (2015).
Wan, H., Zhang, Y., Zhang, J. & Tang, J. AMiner: Search and Mining of Academic Social Networks. Data Intelligence 1, 58–76, https://doi.org/10.1162/dint_a_00006 (2019).
Zhang, Y., Zhang, F., Yao, P. & Tang, J. in Proceedings of the 24th ACM SIGKDD international conference on knowledge discovery & data mining. 1002–1011.
Hendricks, G., Tkaczyk, D., Lin, J. & Feeney, P. Crossref: The sustainable source of community-owned scholarly metadata. Quantitative Science Studies 1, 414–427 (2020).
Priem, J., Piwowar, H. & Orr, R. OpenAlex: A fully-open index of scholarly works, authors, venues, institutions, and concepts. arXiv preprint arXiv:2205.01833 (2022).
Sinha, A. et al. in Proceedings of the 24th International Conference on World Wide Web 243–246 (Association for Computing Machinery, Florence, Italy, 2015).
Wang, K. et al. A Review of Microsoft Academic Services for Science of Science Studies. Frontiers in Big Data 2, 45 (2019).
Wang, K. et al. Microsoft Academic Graph: When experts are not enough. Quantitative Science Studies 1, 396–413 (2020).
Pinski, G. & Narin, F. Citation influence for journal aggregates of scientific publications: Theory, with application to the literature of physics. Information processing & management 12, 297–312 (1976).
Carpenter, M. P., Cooper, M. & Narin, F. Linkage between basic research literature and patents. Research Management 23, 30–35 (1980).
Narin, F., Hamilton, K. S. & Olivastro, D. The increasing linkage between US technology and public science. Research policy 26, 317–330 (1997).
Marx, M. & Fuegi, A. Reliance on science: Worldwide front‐page patent citations to scientific articles. Strategic Management Journal 41, 1572–1594 (2020).
Marx, M. & Fuegi, A. Reliance on science by inventors: Hybrid extraction of in‐text patent‐to‐article citations. Journal of Economics & Management Strategy (2020).
de Solla Price, D. Little science, big science. (Columbia University Press, 1963).
Sinatra, R., Deville, P., Szell, M., Wang, D. & Barabási, A.-L. A century of physics. Nature Physics 11, 791–796 (2015).
de Solla Price, D. Science since babylon. (Yale University Press, 1961).
Lin, Z., Yin, Y., Liu, L. & Wang, D. SciSciNet: A large-scale open data lake for the science of science research, Figshare, https://doi.org/10.6084/m9.figshare.c.6076908.v1 (2022).
Microsoft Academic. Microsoft Academic Graph. Zenodo, https://doi.org/10.5281/zenodo.6511057 (2022).
Smalheiser, N. R. & Torvik, V. I. Author name disambiguation. Annual review of information science and technology 43, 1–43 (2009).
Tang, J., Fong, A. C., Wang, B. & Zhang, J. A unified probabilistic framework for name disambiguation in digital library. IEEE Transactions on Knowledge and Data Engineering 24, 975–987 (2011).
Ferreira, A. A., Gonçalves, M. A. & Laender, A. H. A brief survey of automatic methods for author name disambiguation. Acm Sigmod Record 41, 15–26 (2012).
Sanyal, D. K., Bhowmick, P. K. & Das, P. P. A review of author name disambiguation techniques for the PubMed bibliographic database. Journal of Information Science 47, 227–254 (2021).
Morrison, G., Riccaboni, M. & Pammolli, F. Disambiguation of patent inventors and assignees using high-resolution geolocation data. Scientific data 4, 1–21 (2017).
Tekles, A. & Bornmann, L. Author name disambiguation of bibliometric data: A comparison of several unsupervised approaches1. Quantitative Science Studies 1, 1510–1528, https://doi.org/10.1162/qss_a_00081 (2020).
Van Buskirk, I., Clauset, A. & Larremore, D. B. An Open-Source Cultural Consensus Approach to Name-Based Gender Classification. arXiv preprint arXiv:2208.01714 (2022).
Cleary, E. G., Beierlein, J. M., Khanuja, N. S., McNamee, L. M. & Ledley, F. D. Contribution of NIH funding to new drug approvals 2010–2016. Proceedings of the National Academy of Sciences 115, 2329–2334 (2018).
Packalen, M. & Bhattacharya, J. NIH funding and the pursuit of edge science. Proceedings of the National Academy of Sciences 117, 12011–12016, https://doi.org/10.1073/pnas.1910160117 (2020).
Wang, Y., Jones, B. F. & Wang, D. Early-career setback and future career impact. Nature communications 10, 1–10 (2019).
Hechtman, L. A. et al. NIH funding longevity by gender. Proceedings of the National Academy of Sciences 115, 7943–7948 (2018).
Agrawal, A. & Henderson, R. Putting patents in context: Exploring knowledge transfer from MIT. Management science 48, 44–60 (2002).
Bekkers, R. & Freitas, I. M. B. Analysing knowledge transfer channels between universities and industry: To what degree do sectors also matter? Research policy 37, 1837–1853 (2008).
Owen-Smith, J. & Powell, W. W. To patent or not: Faculty decisions and institutional success at technology transfer. The Journal of Technology Transfer 26, 99–114 (2001).
Mowery, D. C. & Shane, S. Introduction to the special issue on university entrepreneurship and technology transfer. Management Science 48, v–ix (2002).
Williams, R. S., Lotia, S., Holloway, A. K. & Pico, A. R. From Scientific Discovery to Cures: Bright Stars within a Galaxy. Cell 163, 21–23, https://doi.org/10.1016/j.cell.2015.09.007 (2015).
Hmielowski, J. D., Feldman, L., Myers, T. A., Leiserowitz, A. & Maibach, E. An attack on science? Media use, trust in scientists, and perceptions of global warming. Public Understanding of Science 23, 866–883 (2014).
Li, J., Yin, Y., Fortunato, S. & Wang, D. A dataset of publication records for Nobel laureates. Scientific data 6, 33 (2019).
Shen, H., Wang, D., Song, C. & Barabási, A.-L. in Proceedings of the AAAI Conference on Artificial Intelligence.
Ke, Q., Ferrara, E., Radicchi, F. & Flammini, A. Defining and identifying Sleeping Beauties in science. Proceedings of the National Academy of Sciences, 201424329 (2015).
Hirsch, J. E. An index to quantify an individual’s scientific research output. Proceedings of the National academy of Sciences of the United States of America 102, 16569–16572 (2005).
Waltman, L., Boyack, K. W., Colavizza, G. & van Eck, N. J. A principled methodology for comparing relatedness measures for clustering publications. Quantitative Science Studies 1, 691–713, https://doi.org/10.1162/qss_a_00035 (2020).
Santamaría, L. & Mihaljević, H. Comparison and benchmark of name-to-gender inference services. PeerJ Computer Science 4, e156 (2018).
Bornmann, L. & Williams, R. An evaluation of percentile measures of citation impact, and a proposal for making them better. Scientometrics 124, 1457–1478, https://doi.org/10.1007/s11192-020-03512-7 (2020).
Haunschild, R., Daniels, A. D. & Bornmann, L. Scores of a specific field-normalized indicator calculated with different approaches of field-categorization: Are the scores different or similar? Journal of Informetrics 16, 101241, https://doi.org/10.1016/j.joi.2021.101241 (2022).
Yin, Y. & Wang, D. The time dimension of science: Connecting the past to the future. Journal of Informetrics 11, 608–621 (2017).
Stringer, M. J., Sales-Pardo, M. & Amaral, L. A. N. Statistical validation of a global model for the distribution of the ultimate number of citations accrued by papers published in a scientific journal. Journal of the American Society for Information Science and Technology 61, 1377–1385 (2010).
Bornmann, L. & Daniel, H.-D. What do we know about the h index? Journal of the American Society for Information Science and Technology 58, 1381–1385, https://doi.org/10.1002/asi.20609 (2007).
Li, J., Yin, Y., Fortunato, S. & Wang, D. Nobel laureates are almost the same as us. Nature Reviews Physics 1, 301 (2019).
Abramo, G., D’Angelo, C. & Caprasecca, A. Gender differences in research productivity: A bibliometric analysis of the Italian academic system. Scientometrics 79, 517–539 (2009).
Huang, J., Gates, A. J., Sinatra, R. & Barabási, A.-L. Historical comparison of gender inequality in scientific careers across countries and disciplines. Proceedings of the National Academy of Sciences 117, 4609–4616 (2020).
Dworkin, J. D. et al. The extent and drivers of gender imbalance in neuroscience reference lists. Nature neuroscience 23, 918–926 (2020).
Squazzoni, F. et al. Peer review and gender bias: A study on 145 scholarly journals. Science advances 7, eabd0299 (2021).
Yang, Y., Tian, T. Y., Woodruff, T. K., Jones, B. F. & Uzzi, B. Gender-diverse teams produce more novel and higher-impact scientific ideas. Proceedings of the National Academy of Sciences 119, e2200841119 (2022).
Squazzoni, F. et al. Only second-class tickets for women in the COVID-19 race. A study on manuscript submissions and reviews in 2329 Elsevier journals. A study on manuscript submissions and reviews in 2329 (2020).
Vincent-Lamarre, P., Sugimoto, C. R. & Larivière, V. The decline of women’s research production during the coronavirus pandemic. Nature index 19 (2020).
Staniscuaski, F. et al. Gender, race and parenthood impact academic productivity during the COVID-19 pandemic: from survey to action. Frontiers in psychology 12, 663252 (2021).
Fink, J. K. Hereditary spastic paraplegia. Neurologic Clinics 20, 711–726, https://doi.org/10.1016/S0733-8619(02)00007-5 (2002).
Herzog, C., Hook, D. & Konkiel, S. Dimensions: Bringing down barriers between scientometricians and data. Quantitative Science Studies 1, 387–395 (2020).
Lawrence, I. & Lin, K. A concordance correlation coefficient to evaluate reproducibility. Biometrics, 255–268 (1989).
Clauset, A., Shalizi, C. R. & Newman, M. E. Power-law distributions in empirical data. SIAM review 51, 661–703 (2009).
Bornmann, L. & Wohlrabe, K. Normalisation of citation impact in economics. Scientometrics 120, 841–884, https://doi.org/10.1007/s11192-019-03140-w (2019).
van Eck, N. J. & Waltman, L. Citation-based clustering of publications using CitNetExplorer and VOSviewer. Scientometrics 111, 1053–1070, https://doi.org/10.1007/s11192-017-2300-7 (2017).
Xu, J. et al. Building a PubMed knowledge graph. Scientific Data 7, 205, https://doi.org/10.1038/s41597-020-0543-2 (2020).
Torvik, V. I. & Smalheiser, N. R. Author name disambiguation in MEDLINE. ACM Transactions on Knowledge Discovery from Data (TKDD) 3, 1–29 (2009).
Reproducible Science of Science at scale: pySciSci Abstract Quantitative Science Studies 1-17, https://doi.org/10.1162/qss_a_00260.
Lazer, D. M. et al. Computational social science: Obstacles and opportunities. Science 369, 1060–1062 (2020).
Lazer, D. et al. Computational social science. Science 323, 721–723 (2009).
Barabási, A.-L. Network science. (Cambridge University, 2015).
Newman, M. Networks: an introduction. (Oxford University Press, 2010).
Castellano, C., Fortunato, S. & Loreto, V. Statistical physics of social dynamics. Reviews of modern physics 81, 591 (2009).
Dong, Y., Ma, H., Shen, Z. & Wang, K. in Proceedings of the 23rd ACM SIGKDD International Conference on Knowledge Discovery and Data Mining. 1437–1446 (ACM).
Acknowledgements
The authors thank Alanna Lazarowich, Krisztina Eleki, Jiazhen Liu, Huawei Shen, Benjamin F. Jones, Brian Uzzi, Alex Gates, Daniel Larremore, YY Ahn, Lutz Bornmann, Ludo Waltman, Vincent Traag, Caroline Wagner, and all members of the Center for Science of Science and Innovation (CSSI) at Northwestern University for their help. This work is supported by the Air Force Office of Scientific Research under award number FA955017-1-0089 and FA9550-19-1-0354, National Science Foundation grant SBE 1829344, the Alfred P. Sloan Foundation G-2019-12485, and Peter G. Peterson Foundation 21048. The funders had no role in study design, data collection and analysis, decision to publish or preparation of the manuscript.
Author information
Authors and Affiliations
Contributions
D.W. and Y.Y. conceived the project and designed the experiments; Z.L. and Y.Y. collected the data; Z.L. performed data pre-processing, statistical analyses, and validation with help from Y.Y., L.L. and D.W.; Z.L., Y.Y. and D.W. wrote the manuscript; all authors edited the manuscript.
Corresponding author
Ethics declarations
Competing interests
The authors declare no competing interests.
Additional information
Publisher’s note Springer Nature remains neutral with regard to jurisdictional claims in published maps and institutional affiliations.
Supplementary information
Rights and permissions
Open Access This article is licensed under a Creative Commons Attribution 4.0 International License, which permits use, sharing, adaptation, distribution and reproduction in any medium or format, as long as you give appropriate credit to the original author(s) and the source, provide a link to the Creative Commons license, and indicate if changes were made. The images or other third party material in this article are included in the article’s Creative Commons license, unless indicated otherwise in a credit line to the material. If material is not included in the article’s Creative Commons license and your intended use is not permitted by statutory regulation or exceeds the permitted use, you will need to obtain permission directly from the copyright holder. To view a copy of this license, visit http://creativecommons.org/licenses/by/4.0/.
About this article

Cite this article
Lin, Z., Yin, Y., Liu, L. et al. SciSciNet: A large-scale open data lake for the science of science research. Sci Data 10, 315 (2023). https://doi.org/10.1038/s41597-023-02198-9
Received:
Accepted:
Published:
DOI: https://doi.org/10.1038/s41597-023-02198-9
This article is cited by
-
Forecasting the future of artificial intelligence with machine learning-based link prediction in an exponentially growing knowledge network
Nature Machine Intelligence (2023)
-
Data, measurement and empirical methods in the science of science
Nature Human Behaviour (2023)
