
Abstract
The growth of the manufacturing industry is the engine of rapid economic growth in developing regions. Characterizing the geographical distribution of manufacturing firms is critically important for scientists and policymakers. However, data on the manufacturing industry used in previous studies either have a low spatial resolution (or fuzzy classification) or high-resolution information is lacking. Here, we propose a map point-of-interest classification method based on machine learning technology and build a dataset of the distribution of Chinese manufacturing firms called the Gridded Manufacturing Dataset. This dataset includes the number and type of manufacturing firms at a 0.01° latitude by 0.01° longitude scale. It includes all manufacturing firms (classified into seven categories) in China in 2015 (4.56 million) and 2019 (6.19 million). This dataset can be used to characterize temporal and spatial patterns in the distribution of manufacturing firms as well as reveal the mechanisms underlying the development of the manufacturing industry and changes in regional economic policies.
Measurement(s) | distribution of manufacturing firms |
Technology Type(s) | natural language processing |
Background & Summary
Since the First Industrial Revolution in Britain in the 1760s, manufacturing has been one of the major drivers of the world’s economic development. The center of gravity of the global manufacturing industry has shifted many times due to changes in the world’s economic layout1. In the early 1980s, labor-intensive, low-technology, and high-energy industries became less prevalent in the United States, The United Kingdom, Japan, and other developed countries, as well as the “Four Tigers” of East Asia (South Korea, Singapore, Malaysia, Taiwan) and other emerging industrial countries. China, which is the largest developing country in the world, has begun to play a key role in international cooperation in the division of labor and the global manufacturing value chain2. Over the next 40 years, the implementation of the reform and opening-up policy has promoted the rapid growth of the manufacturing industry, industrial transformation and upgrading, and the globalization of the economy3. The added value of China’s manufacturing sector reached 26.59 trillion yuan, and it has ranked first worldwide for 12 consecutive years, accounting for nearly 30% of the global manufacturing sector and generating more than 100 million jobs.
Regional manufacturing expansion is characterized by both temporal and spatial changes. As the quality and quantity of the manufacturing industry grow over time4, the manufacturing industry eventually becomes concentrated in a few regions5. This industry is the driving force behind migration, industrial upgrading, segregation, and many other social phenomena6,7. China’s coastal areas are densely populated and thus provide an ideal region for the agglomeration of the manufacturing industry; these regions have thus made major contributions to China’s economic growth8,9,10. The rapid increase in land, labor, and other costs, coupled with the implementation of China’s regional development strategies aimed at reducing regional differences, such as the development of the western region and the rise of the central region, the manufacturing industry, especially labor-intensive industries, have begun to move to central and western regions on a large scale11,12.
Few empirical studies of Chinese manufacturing firms have been conducted at the firm level, as detailed geographic data on various industrial firms are often not readily available (Table 1). Most research on the distribution of industry has been conducted at the macro provincial and municipal levels13,14; changes in the spatial pattern of the manufacturing industry often need to be analyzed using more micro-scale data. However, obtaining official micro-scale data is often difficult either because access to some data is prohibited by certain policies or because the data have never been collected and processed. Table 1 shows a comparison of existing data collection methods for studying industrial patterns. As these data collection methods often lack classification systems or accurate geographic data, they have various limitations, which results in poor quality data that are lacking in temporal and spatial resolution. The most accessible databases are from the Industrial Enterprises Database (IED)6,15; however, these data have only been taken at large scales and at a firm’s registered address, which can often differ from the address at which the operations of the firm are carried out. For example, records of small-scale branch factories are lacking6. More detailed quantitative data would greatly improve the robustness of industry-related research.
The distribution of classified manufacturing firms could be mapped by combining the strengths of the manufacturing classification of the IED with the strengths of map POI data. The IED is the most promising source of data for mapping the distribution of classified manufacturing firms, as it provides accurate firm names and manufacturing classifications (Table 1). However, these data are only sample data and lack latitude and longitude coordinates for the firms, and the statistical objects are large and include medium-sized manufacturing firms with an annual turnover of more than 20 million yuan in China, which means that the original IED does not include manufacturing firms with an annual turnover of less than 20 million yuan16,17. Map POI data have precise spatial information and have been widely used in various fields18. One of the greatest challenges in manufacturing research is the absence of a clear classification system of manufacturing firms, yet a robust manufacturing classification system is essential if map POI data are used to study the distribution of manufacturing firms. However, the manual processing of data is time and labor-consuming14,19,20,21,22,23. The machine learning method, coupled with small sample classification data, such as the “Firm name – Manufacturing classification” in the IED, can be used to identify manufacturing types in the map POI data and develop base maps for manufacturing research.
Methods
The number of POI is nearly equal to the actual number of facilities in cities18. Therefore, large-scale manufacturing patterns can be studied at high spatial resolution using the POI classification. In this paper, seven types of Chinese gridded manufacturing datasets (GMDs) were generated, which used IED data as accurate training sample data to classify and identify map POIs through machine learning. Data on the distribution of seven categories of manufacturing in China were obtained. The technical process employed includes four steps:
-
Building a learning sample library for manufacturing types by the IED.
-
Collecting and pre-processing map POI data24.
-
Classifying manufacturing based on machine learning.
-
Drawing the high spatial resolution grid map of China’s manufacturing industry in 2015 and 2019 (Fig. 1).
Fig. 1 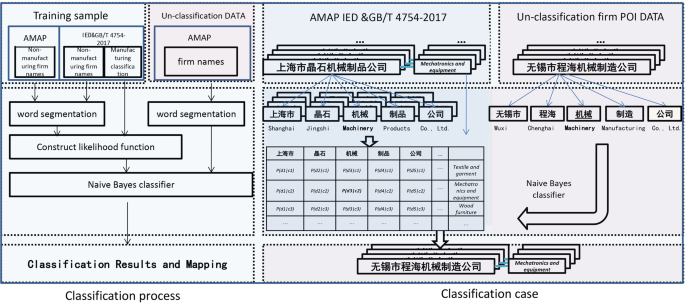
Research framework and classification example.

After the data were produced, their quality was tested.
Construction of the “name-manufacturing type” machine learning sample database using IED
The name-manufacturing type learning sample database was constructed using IED. According to the naming method of Chinese firms and Fa Li’s (2018) approach, there is a link between the name of a facility and the type of manufacturing industry to which it belongs15. Thus, a name-manufacturing sample database or keyword dataset can be constructed for machine learning to study the manufacturing classification. In the process of searching for relevant literature, we found that the IED can be used as the learning sample database. China’s IED, established by the National Bureau of Statistics, covers all state-owned industrial firms and non-state-owned secondary sector firms above a designated size, with manufacturing accounting for more than 90% of the statistics. The IED data sources are official, but they only sample large and medium-sized manufacturing firms with an annual turnover of more than 20 million yuan in China and lack geographic coordinates and branch factory addresses. Data from the IED for China in 2013 include some large firms (ca. 344,875 firms); these have been strictly classified and marked, and their industry names are in strict accordance with the national economic industry classification standards in GB/T 4754-2017. Therefore, machine learning and non-subjective supervised classification can achieve better results than manual labeling using the two-field name - manufacturing type classification in the IED. To reduce the redundancy of classification types, industries with similar types were merged into larger types following the method of Shen (2021)6,18. First, we manually marked 27,689 non-manufacturing samples (e.g., service industry, agriculture, and supply industry) as non-manufacturing samples in the classification sample. Next, the names of leading industry types in the development zones in various regions in the 2018 edition of “China Development Zone Review Announcement Catalogue”25 were summarized, and the names of different industry types with high frequency were extracted; industry types with similar names were merged into a larger category. The names of the manufacturing industry categories corresponding to the firm names in the IED were then summarized. Finally, the corresponding manufacturing industry was divided into seven categories by combining the development zone and the IED summary classification, which provided the learning sample database classification standard. Therefore, the “Name-Manufacturing Type” machine learning sample database contains 372,564 firm names and their corresponding classification. The study samples are provided at https://doi.org/10.6084/m9.figshare.1980840726.
Collection and preprocessing of map POI data
Nearly every company, enterprise, firm, site, or facility in China (even those not registered with the Industry and Commerce Department) has a specific location on government-approved web maps. Our data were obtained from the Amap website (https://www.amap.com/) through web scraping. Because some factories or firms do not appear on the map after they have gone bankrupt or changed addresses, and remote branch factories are shown on the map, these data have higher precision than questionnaire and statistical data. We collected data using the services provided by Amap’s API and divided them into batches, which involves using web crawlers to collect the POI names and locations of firms across China from January 2nd to 20th, 2015, and from December 20th to 30th, 201927,28. To reduce the potential interference from the original data, preprocessing was carried out as follows:
-
“Scenery,” “shopping,” “catering,” “road name,” and other types of built-in classification from the map unrelated to firms were filtered out, and only the firm and its corresponding latitude and longitude were retained to increase the classification speed.
-
By identifying and matching word items, points with the same place name but different marks within 1 km around the POI points (e.g., East Entrance, West Gate) were deleted to solve the problem associated with counting the same POI.
The final map POI dataset contained firm names and spatial information (approximately 5.24 million in 2015 and 7.35 million in 2019).
Map POI name-manufacturing type classification algorithm based on the Naive Bayes algorithm for machine learning
To enable the computer to learn and classify the manufacturing industry samples, Chinese word segmentation was performed on the classified samples and POI names. To transform text into a data structure that a computer can process, the text needs to be sliced into semantic units. In the first step of our machine learning, we used the jieba module (the Chinese word segmentation module in the Python) to segment the names of Chinese firms29,30. The Chinese Thesaurus was used to perform forward maximum matching for POI name field information, which was segmented into several words for keyword recognition, manual tagging, or machine learning training. Next, meaningless fields for information classification and possible special symbols were removed (such as punctuation, spaces, and bom characters), which will affect the classification results, and only Chinese and English characters were retained.
After word segmentation was complete, a machine learning classifier was built. The Naive Bayes algorithm was used to learn the name-classification samples of the IED after word segmentation. As proposed by F. Sebastiani, text classification can be understood as a function of acquisition, where S = {s1,s2, …,sn} indicates the document or string to be classified, and C = {c1,c2… cm} represents the set of categories in the predefined classification system. The goal of text classification is to find an evaluable mapping: f: S ↦ C.
The classification space is an m-dimensional Euclidean space, and the value of each dimension is in [0,1]; this represents the probability of the input s in each dimension after f mapping, which can be determined by calculating the probability distribution of the category to which s belongs. The formal mathematical definition of text classification is shown in Eq. 1:
The Naive Bayes classifier was used in this study. First, a probabilistic evaluation learning approach was used for each matched manufacturing classification in the IED name S:
According to the Bayesian Equation, the probability that s belongs to ci for any input s is:
Equation (2) is the likelihood function of the Bayesian classifier. Maximizing it over ci gives the class to which the input s belongs:
That is, \(\bar{c}\) is the category that makes the conditional probability p(ci|s) take the maximum value among all categories C = {c1,c2… cm}.
In Eq. (2), p(s|ci) is the prior probability. To calculate the likelihood function, each prior probability needs to be calculated p(s|ci).
If we denote the s participle as s = {w1, w2,…, wk} and assume that the occurrence probability of each word in s is independent of each other, then:
p(w1|ci) represents the probability that the participle wi appears in the category cj, and it can be calculated by the following equation:
From Eqs. (2–5), the category to which s belongs can be determined.
We implemented the above word segmentation, learning, and classification process in the Python environment. Based on the text algorithm of the Naive Bayes classification, the IED in 2.1 was used as the machine learning training sample, and map POI data in 2.2 were used as the sample for classification in the above machine learning model; the trained model was applied to the name classification of manufacturing firms. The classification results of POI firm names were imported into the geographic information database combined with the original geographic coordinates of the POI. The model algorithm code is provided in the Figshare repository (https://doi.org/10.6084/m9.figshare.19808407)26.
Patterns in China’s manufacturing industry in 2015 and 2019
Scale can substantially affect the results of analyses of spatial economic patterns. If an analysis is conducted at an excessively large-scale, small-scale patterns can be overlooked; by contrast, if the scale of the analysis is too small, general patterns are often not detectable18. To fit commonly used LandScan population data (https://landscan.ornl.gov/) and GDP grid data, we divided China into a grid of 0.01° latitude by 0.01° longitude. After classification, seven different types of manufacturing distribution data were projected onto the grid, and the number of points of the different types of manufacturing categories in each grid was counted. Greater numbers of points indicate greater numbers of industries. After data processing, there were 4.56 million (2015) and 6.19 million (2019) firm points.
For this dataset, we first constructed a list of cities with the full names and abbreviations of prefecture-level and above cities in China (including municipalities directly under the Central Government, prefecture-level cities, regions, leagues, autonomous prefectures, Hong Kong, Macao, and Taiwan). More information on the administrative divisions in China is provided in ref. 31. In the property table, each grid corresponds to a field, which indicates the province and city to which it belongs and the quantity of each of the seven types of manufacturing industries in each grid in 2015 and 2019. All coordinates were based on the WGS84 projection, and the grid was divided according to LandScan population data (0.01° latitude by 0.01° longitude).
We found that the distribution of grid values in 2015 and 2019 fit the probability density function well (Fig. 2), which is consistent with the power-law distribution observed for most of the socio-economic characteristics of the large-scale data32,33. The geographical changes in China’s manufacturing industry can also be observed in the map (Fig. 3a–c), and most economic activities were concentrated in the eastern coastal areas, especially in the Beijing-Tianjin-Hebei urban agglomeration (BTH), the Yangtze River Delta (YRD), the Pearl River Delta (PRD), and the Chengdu-Chongqing City Group (CC)11. Unlike the yearbook data, the changes in manufacturing firm types and their spatial distribution among these four urban agglomerations and inner cities can be clearly observed (Fig. 3 and Fig. 4).

Probability density function of grid data values.

Distribution of China’s manufacturing industries. (a) Distribution of manufacturing firms across the whole country, the BTH, the YRD, the PRD, and the CC in 2015. (b) Distribution of manufacturing firms across the whole country, the BTH, the YRD, the PRD, and the CC in 2019. (c) Increase in the number of manufacturing firms across the whole country, the BTH, the YRD, the PRD, and the CC from 2015 to 2019.

Distribution of different types of manufacturing firms in China.
Data Records
Our data have been deposited in the Figshare repository (https://doi.org/10.6084/m9.figshare.19808407)26. The database contains an SHP file (data 2015–2019.shp) with field names as shown in Table 3. Each line of the file represents a grid cell record.
For ease of use, we also included county, city, and province information for each set of cell coordinates. A summary of the basic statistics of the manufacturing industry at the provincial level is shown in Table 4. The number of manufacturing firms is highest in Guangdong, Jiangsu, Shandong, Zhejiang, and Shanghai; thus, these regions have the most developed manufacturing industries.
Technical Validation
As quantitative data of the manufacturing industry have not yet been classified, we determined whether the data and their classification were accurate to evaluate the reliability of the data. Technical verification of the data was carried out using three approaches: classification data accuracy verification, grid data verification, and social and economic data verification. Because the official manufacturing distribution data have not been published, and the above data do not represent the actual distribution of manufacturing firms, we provide the classification accuracy for reference after each verification.
Classification data verification
The purpose of classification data verification is to verify the classification accuracy of the classifier. According to machine learning, the result can be displayed after computing the accessory model algorithm code. The precision index of the training samples was AF = 0.77, MC = 0.92, ME = 0.96, OM = 0.90, PM = 0.82, PP = 0.91, TC = 1.00, and WF = 0.96; the precision of the non-manufacturing class was 0.93. We manually checked 73,500 (≈1% of the total) firm names in 2019, and the total accuracy was 92%. The precision index for each class was AF = 0.86, MC = 0.94, ME = 0.93, OM = 1.00, PM = 0.98, PP = 0.86, TC = 0.97, and WF = 0.99; the precision index for the non-manufacturing class was 0.95.
Verification with the published gridded data
The purpose of the validation with the published gridded establishment dataset (GED) was to determine whether the general patterns in the distribution of the manufacturing firms were accurate. To verify their accuracy, the GED, the only grid data measuring economic activities in mainland China, was obtained from ref. 6. We matched our grid data with secondary industry data from the 2015GED and then ran a simple regression to estimate the correlation between the two datasets. The R2 was 0.620, indicating that the two datasets were consistent (Fig. 5). Some deviation might be explained by the fact that the database comprises data on all the secondary industries in mainland China, whereas our data were on the manufacturing industries across China.

Estimated correlation between the GMD and the GED secondary industries of the manufacturing grid in 2015.
Verification with social and economic data
The purpose of the validation with social and economic data was to determine (1) industry registration data validation, (2) whether the data describing macroeconomic industries in the yearbook were relevant to the GMD, and (3) whether the relative proportions of the different manufacturing firms were similar to samples from the IED.
Although the above data do not represent the actual distribution of different manufacturing industries, we provided the classification accuracy for reference after each verification.
-
1)
Industry Registration Data Validation
To verify whether the number of our manufacturing firms is similar to the firm registration data, we aggregated the number of manufacturing firms registered on the Chinese mainland in 2019 from the Qichacha website (https://www.qcc.com/, screened until 2019.12.30), and we compared these data with our 2019 GMD industrial enterprise database. The results of the fitted model are shown in Fig. 6. In general, the total number of manufacturing firms in each city in our data was highly consistent with the number of registered firms in Qichacha (R2 of 0.935). The possible reasons for the error include 1) the actual address of the firm is not at the place of registration, and 2) some firms only have registration information but no actual factory address.
Fig. 6 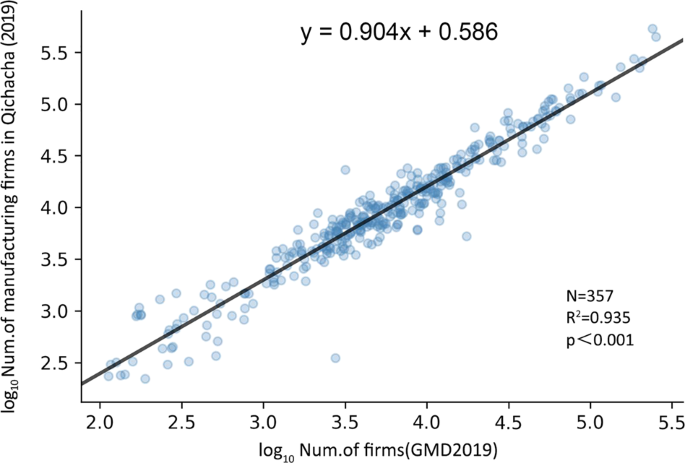
Correlation between the number of manufacturing firms in prefecture-level cities from GMD 2019 and the number of registered firms.
-
2)
Yearbook data verification
We summarized the number of manufacturing firms at the city level and compared them with the social and economic indicators of secondary GDP and manufacturing employment at the city level. Secondary GDP was derived from the City Statistical Yearbook, and manufacturing employment was derived from the CEIC (China Entrepreneur Investment Club: China Economic Database). Some cities were excluded due to a lack of statistical data. In Figs. 7 and 8, we show the results of the two models: the linear regression of the total number of manufacturing industries with secondary GDP and manufacturing employment. Overall, our data perform well in estimating these socioeconomic variables, with R2 values exceeding 0.72 in all cases.
Fig. 7 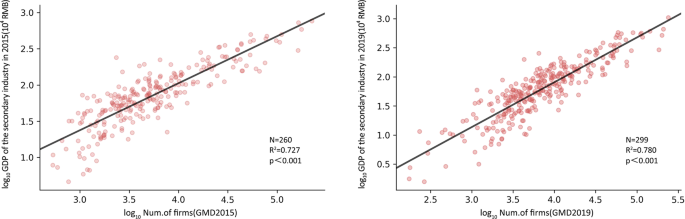
Correlation estimation and verification of the total manufacturing volume of prefecture-level cities and secondary production GDP (a 2015, b 2019).
Fig. 8 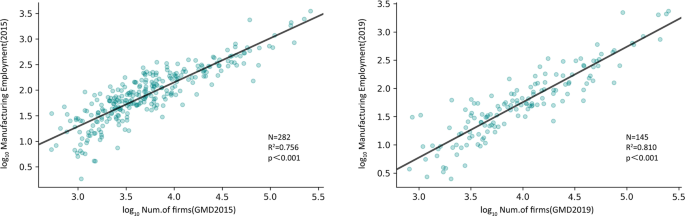
Correlation estimation and verification of the total manufacturing volume of prefecture-level cities and the number of employees in the manufacturing industry (a 2015, b 2019).
-
3)
Manufacturing type classification verification


To verify whether the proportions of different manufacturing types in our classification results were consistent with those in the sampled data from the industrial firm database, we aggregated the number of firms into seven different types of manufacturing industries at the city level in 2015 and compared them with the IED. We present the results for the seven models in Fig. 9. In general, the proportions of manufacturing types in each city in our data were highly consistent with those sampled from the industrial firm database, with an R2 value ranging from 0.64 to 0.82. However, we found that a non-linear correlation might also appear (Fig. 8a,g). This might be explained by the fact that the number of firms sampled in the IED is low in some large cities; alternatively, the manufacturing firms in these cities might have broken into multiple branches since the IED data were collected6.

Quantity correlation analysis and verification of seven categories of manufacturing industries and industrial firm databases at the prefecture-level city scale in 2015 (a ME, b AF, c WF, d TC, e PP, f PM, g MC).
Usage Notes
The GMD can be used in geographic information systems such as ArcGIS and QGIS. In GIS software, datasets can be imported as vector layers. To match with other geographic datasets (industrial park boundaries or water, air quality monitoring records34), users can apply spatial join capabilities in GIS software to link attributes from the GMD to other data based on spatial relationships35. Resampling methods can also be used if the resolution of the GMD is inconsistent with other data sources36.
We used 2015 and 2019, which are the two final years of China’s 12th Five-Year Plan and 13th Five-Year Plan18 (The data after 2020 are not representative because of the COVID-19 pandemic; consequently, research data until the end of 2019 were used), and datasets from these years provide highly representative data. If granular dynamic data need to be updated for one to two years in a specific region (such as at the province level) or in the future after 2019, our classifier can be used to process the data per these specific needs.
In addition, the names of the counties, cities, and provinces provided in this dataset are based on the administrative boundaries in 2019. The administrative divisions of the grid were determined according to the centroid of the grid. If the GMD is matched with other statistics by county, city, and province name, the effect of name changes at various scales needs to be considered. The grid cells of the GMD are the same size and location as those in the LandScan data. As the data are based on WGS84 coordinates, the spherical area of the grid cells varies among regions (the side length of the equatorial grid is approximately 1.1 km, and the side length of the Beijing grid is approximately 0.85 km).
Code availability
The python manufacturing classification code and machine learning samples are available at https://doi.org/10.6084/m9.figshare.1980840726.
References
Liu, D. The evolution of the world manufacturing center and China’s current situation and development trend. Research on Development, 76–79, https://doi.org/10.13483/j.cnki.kfyj.2008.05.024 (2008).
Chen, Z. The shift of the world’s manufacturing center to China: trends, characteristics, conditions. Productivity Research, 99–101, https://doi.org/10.19374/j.cnki.14-1145/f.2004.06.038 (2004).
Huang, Q. China’s manufacturing sector,industrialization and economic globalization. China Economist 14, 2–13, https://doi.org/10.19602/j.chinaeconomist.2019.7.01 (2019).
Romer & Paul, M. Increasing returns and long-run growth. Journal of Political Economy 94, 1002–1037, https://doi.org/10.1086/261420 (1986).
Krugman, P. Increasing returns and economic geography. Journal of Political Economy 99, 483–499, https://doi.org/10.1086/261763 (1991).
Dong, L., Yuan, X., Li, M., Ratti, C. & Liu, Y. A gridded establishment dataset as a proxy for economic activity in China. Sci Data 8, 5, https://doi.org/10.1038/s41597-020-00792-9 (2021).
Nordhaus, W. D. Geography and macroeconomics: New data and new findings. Proceedings of the National Academy of Sciences of the United States of America 103, 3510–3517, https://doi.org/10.1073/pnas.0509842103 (2006).
Mao, Q., Wang, F., Li, J. & Dong, S. Evolving a core-periphery pattern of manufacturing industries across Chinese provinces. Journal of Geographical Sciences 24, 924–942, https://doi.org/10.1007/s11442-014-1129-8 (2014).
Wu, S. & Li, S. An analysis of spatial distribution of manufacturing industry in China. China Soft Science 123-131, 150, https://doi.org/10.3969/j.issn.1002-9753.2010.06.013 (2010).
Wu, J., Wei, Y., Li, Q. & Yuan, F. Economic transition and changing location of manufacturing industry in China: A study of the Yangtze River Delta. Sustainability 10, 2624, https://doi.org/10.3390/su10082624 (2018).
Zhou, L., Gu, H. & H, H. Evolution of China’s regional innovation structure in 2006-2018. Economic Geography 41, 19–28, https://doi.org/10.15957/j.cnki.jjdl.2021.05.003 (2021).
Shi, M., Yang, J., Long, W. & WEI, D. Y. Changes in geographical distribution of Chinese manufacturing sectors and its driving forces. Geographical Research 32, 1708–1720, https://doi.org/10.11821/dlyj201309013 (2013).
Ye, H. et al. Analysis on influencing factors and spatial distribution of leisure agriculture at provincial level based on geographic big data:a case study of Zhejiang Province. China. Acta Agriculturae Zhejiangensis 33, 1264–1274, https://doi.org/10.3969/j.issn.1004-1524.2021.07.12 (2021).
Hu, Y. & Han, Y. Identification of urban functional areas based on POI data: A case study of the Guangzhou economic and technological development zone. Sustainability 11, 1385, https://doi.org/10.3390/su11051385 (2019).
Li, F. et al. Big enterprise registration data imputation: Supporting spatiotemporal analysis of industries in China. Computers, Environment and Urban Systems 70, 9–23, https://doi.org/10.1016/j.compenvurbsys.2018.01.010 (2018).
Li, Z. & Lv, B. Total factor productivity of Chinese industrial firms: evidence from 2007 to 2017. Applied Economics 53, 6910–6926, https://doi.org/10.1080/00036846.2021.1954592 (2021).
Liu, T., Kou, F., Liu, X. & Elahi, E. Cluster Commercial Credit and Total Factor Productivity of the Manufacturing Sector. Sustainability 14, https://doi.org/10.3390/su14063601 (2022).
Shen, S. et al. Research on the evolution and driving forces of the manufacturing industry during the “13th five-year plan” period in Jiangsu province of China based on natural language processing. PLoS One 16, e0256162, https://doi.org/10.1371/journal.pone.0256162 (2021).
Xue, B., Xiao, X. & Li, J. Identification method and empirical study of urban industrial spatial relationship based on POI big data: a case of Shenyang City, China. Geography and Sustainability 1, 152–162, https://doi.org/10.1016/j.geosus.2020.06.003 (2020).
Zhang, H., Zhou, X., Tang, G., Xiong, L. & Dong, K. Mining spatial patterns of food culture in China using restaurant POI data. Transactions in GIS 25, 579–601, https://doi.org/10.1111/tgis.12682 (2020).
Niu, H. & Silva, E. A. Delineating urban functional use from points of interest data with neural network embedding: A case study in Greater London. Computers, Environment and Urban Systems 88, 101651, https://doi.org/10.1016/j.compenvurbsys.2021.101651 (2021).
Cui, Z., Huang, X., He, L. & Zhou, Z. Study on urban life convenience index based on POI data. Geomatics World 23, 27–33, https://doi.org/10.3969/j.issn.1672-1586.2016.03.006 (2016).
Xu, D., Huang, Z., Lu, L., Chen, X. & Cao, F. Research on spatial characteristics of urban leisure tourism based on POI mining:a case study of Nanjing city. Geography and Geo-Information Science 34, 59–64,70, https://doi.org/10.3969/j.issn.1672-0504.2018.01.010 (2018).
Search POI https://lbs.amap.com/api/webservice/guide/api/search (2019).
Catalogue of China Development Zone Audit Announcements https://www.ndrc.gov.cn/fggz/lywzjw/zcfg/201803/t20180302_1047056.html?code=&state=123 (2018).
Fan, C. et al. China’s Gridded Manufacturing Dataset. figshare https://doi.org/10.6084/m9.figshare.19808407 (2022).
Williams, S., Xu, W., Tan, S. B., Foster, M. J. & Chen, C. Ghost cities of China: Identifying urban vacancy through social media data. Cities 94, 275–285, https://doi.org/10.1016/j.cities.2019.05.006 (2019).
Zhang, Z., Long, Y., Chen, L. & Chen, C. Assessing personal exposure to urban greenery using wearable cameras and machine learning. Cities 109, 103006, https://doi.org/10.1016/j.cities.2020.103006 (2021).
Li, L. et al. Prediction and Diagnosis of Respiratory Disease by Combining Convolutional Neural Network and Bi-directional Long Short-Term Memory Methods. Frontiers in Public Health 10, https://doi.org/10.3389/fpubh.2022.881234 (2022).
Liu, Q. et al. Health Communication Through News Media During the Early Stage of the COVID-19 Outbreak in China: Digital Topic Modeling Approach. Journal of Medical Internet Research 22, https://doi.org/10.2196/19118 (2020).
Administrative divisions of the People’s Republic of China http://www.gov.cn/test/2005-06/15/content_18253.htm (2019).
Limpert et al. Log-normal distributions across the sciences: Keys and clues. BioScience 51, 341–352 (2001).
Alstott, J., Bullmore, E. & Plenz, D. Powerlaw: a Python package for analysis of heavy-tailed distributions. PLoS One 9, e85777, https://doi.org/10.1371/journal.pone.0085777 (2014).
He, G., Wang, S. & Zhang, B. Watering down environmental regulation in China. The Quarterly Journal of Economics 135, 2135–2185, https://doi.org/10.1093/qje/qjaa024 (2020).
Spatial join https://desktop.arcgis.com/en/arcmap/10.3/tools/analysis-toolbox/spatial-join.htm (2020).
Lyons, M. B., Keith, D. A., Phinn, S. R., Mason, T. J. & Elith, J. A comparison of resampling methods for remote sensing classification and accuracy assessment. Remote Sensing of Environment 208, 145–153, https://doi.org/10.1016/j.rse.2018.02.026 (2018).
Zhang, W. & Huang, J. Evolvements of time and space in geographical concentration of China’s manufacture during 1988- 2003. Economic Review, 118–123, https://doi.org/10.19361/j.er.2007.01.021 (2007).
Zhou, R. & Li, X. Evolution of spatial pattern and influencing factors of manufacturing industries in Guangdong Province. Human Geography 32, 95–102, https://doi.org/10.13959/j.issn.1003-2398.2017.02.014 (2017).
Zhang, J. & Tang, G. Spatial differentiation pattern of manufacturing industry in Zhejiang and its influencing factors. Scientia Geographica Sinica 38, 1107–1117, https://doi.org/10.13249/j.cnki.sgs.2018.07.012 (2018).
Zhang, X. & Sun, L. Manufacture restructuring and main determinants in Beijing metropolitan area. Acta Geographica Sinica 67, 1308–1316, https://doi.org/10.11821/xb201210002 (2012).
Wang, J. Evolution of spatial pattern and influencing factors of manufacturing industries in Yangtze River Delta region. Geographical Research 33, 2312–2324 (2014).
Yin, X., Cao, F. & Sun, X. Research on spatial agglomeration characteristics and influencing mechanism of cultural and creative industry in beijing based on POI data. Journal of Shandong Normal University(Natural Science) 34, 210–219, https://doi.org/10.3969/j.issn.1001-4748.2019.02.014 (2019).
Chen, X. & Sun, B. Spatial structure and determinants of manufacturing employments in Shanghai metropolitan area. Human Geography 32, 95–101, https://doi.org/10.13959/j.issn.1003-2398.2017.04.013 (2017).
Guillain, R. & Le Gallo, J. Agglomeration and dispersion of economic activities in and around Paris: an exploratory spatial data analysis. Environment and Planning B: Planning and Design 37, 961–981, https://doi.org/10.1068/b35038 (2010).
Cao, W., Zhao, X., Huang, X. & Jin, Z. Influential factors of different types of industrial enterprises land intensive use in Jiangsu province. Areal Research and Development 35, 104–108+113, https://doi.org/10.3969/j.issn.1003-2363.2016.03.020 (2016).
An, T., Shi, H. & Alcorta, L. An observation and empirical study of R&D behavior of Chinese manufacturing firms:based on a survey of the manufacturing firms in Jiangsu province. Economic Research Journal, 21-30+56 (2006).
Elgar, I. How office firms conduct their location search process? An analysis of a survey from the greater Toronto area. International Regional Science Review, https://doi.org/10.1177/0160017609331398 (2010).
Chen, X. & Nordhaus, W. D. Using luminosity data as a proxy for economic statistics. Proceedings of the National Academy of Sciences of the United States of America 108, 8589–8594, https://doi.org/10.1073/pnas.1017031108 (2011).
Henderson, J. V., Storeygard, A. & Weil, D. N. Measuring economic growth from outer space. American Economic Review 102, 994–1028, https://doi.org/10.1257/aer.102.2.994 (2012).
Naik, N., Kominers, S. D., Raskar, R., Glaeser, E. L. & Hidalgo, C. A. Computer vision uncovers predictors of physical urban change. Proceedings of the National Academy of Sciences of the United States of America 114, 7571–7576, https://doi.org/10.1073/pnas.1619003114 (2017).
Mellander, C., Lobo, J., Stolarick, K. & Matheson, Z. Night-time light data: A good proxy measure for economic activity? Plos One 10, e0139779, https://doi.org/10.1371/journal.pone.0139779 (2015).
Porta, S. et al. Street centrality and densities of retail and services in Bologna, Italy. Environment and Planning B: Planning and Design 36, 450–465, https://doi.org/10.1068/b34098 (2009).
Zhou, L. et al. How did industrial land supply respond to transitions in state strategy? An analysis of prefecture-level cities in China from 2007 to 2016. Land Use Policy 87, 104009, https://doi.org/10.1016/j.landusepol.2019.05.028 (2019).
Dong, H. Concentration or dispersion? Location choice of commercial developers in the Portland metropolitan area, 2000–2007. Urban Geography 34, 989–1010, https://doi.org/10.1080/02723638.2013.778587 (2013).
Dong, L. et al. Measuring economic activity in China with mobile big data. Epj Data Science 6, 29, https://doi.org/10.1140/epjds/s13688-017-0125-5 (2017).
Airoldi, A., Janetti, G. B., Gambardella, A. & Senn, L. The impact of urban structure on the location of producer services. The Service Industries Journal 17, 91–114, https://doi.org/10.1080/02642069700000005 (2006).
Llorente, A., Garcia-Herranz, M., Cebrian, M. & Moro, E. Social media fingerprints of unemployment. Plos One 10, e0128692, https://doi.org/10.1371/journal.pone.0128692 (2015).
Lv, Y., Zhou, L., Yao, G. & Zheng, X. Detecting the true urban polycentric pattern of Chinese cities in morphological dimensions: A multiscale analysis based on geospatial big data. Cities 116, 103298, https://doi.org/10.1016/j.cities.2021.103298 (2021).
Acknowledgements
The research was supported by the National Social Science Fund of China (20CJL004).
Author information
Authors and Affiliations
Contributions
L.Z. and C.F. designed the research. C.F. led the project and provided the idea for this research. C.F. and X.H. collected, analyzed, and validated the data. C.F., X.H. and Z.G. wrote the paper. X.H. made the figures. L.Z. revised the manuscript. C.Z. and H.Z. helped with the programming. C.F. and X.H. contributed to the work equally and should be regarded as co-first authors.
Corresponding author
Ethics declarations
Competing interests
The authors declare no competing interests.
Additional information
Publisher’s note Springer Nature remains neutral with regard to jurisdictional claims in published maps and institutional affiliations.
Rights and permissions
Open Access This article is licensed under a Creative Commons Attribution 4.0 International License, which permits use, sharing, adaptation, distribution and reproduction in any medium or format, as long as you give appropriate credit to the original author(s) and the source, provide a link to the Creative Commons license, and indicate if changes were made. The images or other third party material in this article are included in the article’s Creative Commons license, unless indicated otherwise in a credit line to the material. If material is not included in the article’s Creative Commons license and your intended use is not permitted by statutory regulation or exceeds the permitted use, you will need to obtain permission directly from the copyright holder. To view a copy of this license, visit http://creativecommons.org/licenses/by/4.0/.
About this article

Cite this article
Fan, C., Huang, X., Zhou, L. et al. China’s Gridded Manufacturing Dataset. Sci Data 9, 742 (2022). https://doi.org/10.1038/s41597-022-01848-8
Received:
Accepted:
Published:
DOI: https://doi.org/10.1038/s41597-022-01848-8
