
Abstract
One in ten severe acute respiratory syndrome coronavirus 2 infections result in prolonged symptoms termed long coronavirus disease (COVID), yet disease phenotypes and mechanisms are poorly understood1. Here we profiled 368 plasma proteins in 657 participants ≥3 months following hospitalization. Of these, 426 had at least one long COVID symptom and 233 had fully recovered. Elevated markers of myeloid inflammation and complement activation were associated with long COVID. IL-1R2, MATN2 and COLEC12 were associated with cardiorespiratory symptoms, fatigue and anxiety/depression; MATN2, CSF3 and C1QA were elevated in gastrointestinal symptoms and C1QA was elevated in cognitive impairment. Additional markers of alterations in nerve tissue repair (SPON-1 and NFASC) were elevated in those with cognitive impairment and SCG3, suggestive of brain–gut axis disturbance, was elevated in gastrointestinal symptoms. Severe acute respiratory syndrome coronavirus 2-specific immunoglobulin G (IgG) was persistently elevated in some individuals with long COVID, but virus was not detected in sputum. Analysis of inflammatory markers in nasal fluids showed no association with symptoms. Our study aimed to understand inflammatory processes that underlie long COVID and was not designed for biomarker discovery. Our findings suggest that specific inflammatory pathways related to tissue damage are implicated in subtypes of long COVID, which might be targeted in future therapeutic trials.
Main
One in ten severe acute respiratory syndrome coronavirus 2 (SARS-CoV-2) infections results in post-acute sequelae of coronavirus disease 2019 (PASC) or long coronavirus disease (COVID), which affects 65 million people worldwide1. Long COVID (LC) remains common, even after mild acute infection with recent variants2, and it is likely LC will continue to cause substantial long-term ill health, requiring targeted management based on an understanding of how disease phenotypes relate to underlying mechanisms. Persistent inflammation has been reported in adults with LC1,3, but studies have been limited in size, timing of samples or breadth of immune mediators measured, leading to inconsistent or absent associations with symptoms. Markers of oxidative stress, metabolic disturbance, vasculoproliferative processes and IFN-, NF-κB- or monocyte-related inflammation have been suggested3,4,5,6.
The PHOSP-COVID study, a multicenter United Kingdom study of patients previously hospitalized with COVID-19, has reported inflammatory profiles in 626 adults with health impairment after COVID-19, identified through clustering. Elevated IL-6 and markers of mucosal inflammation were observed in those with severe impairment compared with individuals with milder impairment7. However, LC is a heterogeneous condition that may be a distinct form of health impairment after COVID-19, and it remains unclear whether there are inflammatory changes specific to LC symptom subtypes. Determining whether activated inflammatory pathways underlie all cases of LC or if mechanisms differ according to clinical presentation is essential for developing effective therapies and has been highlighted as a top research priority by patients and clinicians8.
In this Letter, in a prospective multicenter study, we measured 368 plasma proteins in 657 adults previously hospitalized for COVID-19 (Fig. 1a and Table 1). Individuals in our cohort experienced a range of acute COVID-19 severities based on World Health Organization (WHO) progression scores9; WHO 3–4 (no oxygen support, n = 133 and median age of 55 years), WHO 5–6 (oxygen support, n = 353 and median age of 59 years) and WHO 7–9 (critical care, n = 171 and median age of 57 years). Participants were hospitalized for COVID-19 ≥3 months before sample collection (median 6.1 months, interquartile range (IQR) 5.1–6.8 months and range 3.0–8.3 months) and confirmed clinically (n = 36/657) or by PCR (n = 621/657). Symptom data indicated 233/657 (35%) felt fully recovered at 6 months (hereafter ‘recovered’) and the remaining 424 (65%) reported symptoms consistent with the WHO definition for LC (symptoms ≥3 months post infection10). Given the diversity of LC presentations, patients were grouped according to symptom type (Fig. 1b). Groups were defined using symptoms and health deficits that have been commonly reported in the literature1 (Methods). A multivariate penalized logistic regression model (PLR) was used to explore associations of clinical covariates and immune mediators at 6 months between recovered patients (n = 233) and each LC group (cardiorespiratory symptoms, cardioresp, n = 398, Fig. 1c; fatigue, n = 384, Fig. 1d; affective symptoms, anxiety/depression, n = 202, Fig. 1e; gastrointestinal symptoms, GI, n = 132, Fig. 1f; and cognitive impairment, cognitive, n = 61, Fig. 1g). Women (n = 239) were more likely to experience CardioResp (odds ratio (OR 1.14), Fatigue (OR 1.22), GI (OR 1.13) and Cognitive (OR 1.03) outcomes (Fig. 1c,d,f,g). Repeated cross-validation was used to optimize and assess model performance (Methods and Extended Data Fig. 1). Pre-existing conditions, such as chronic lung disease, neurological disease and cardiovascular disease (Supplementary Table 1), were associated with all LC groups (Fig. 1c–g). Age, C-reactive protein (CRP) and acute disease severity were not associated with any LC group (Table 1).

a, Distribution of time from COVID-19 hospitalization at sample collection. All samples were cross-sectional. The vertical red line indicates the 3 month cutoff used to define our final cohort and samples collected before 3 months were excluded. b, An UpSet plot describing pooled LC groups. The horizontal colored bars represent the number of patients in each symptom group: cardiorespiratory (Cardio_Resp), fatigue, cognitive, GI and anxiety/depression (Anx_Dep). Vertical black bars represent the number of patients in each symptom combination group. To prevent patient identification, where less than five patients belong to a combination group, this has been represented as ‘<5’. The recovered group (n = 233) were used as controls. c–g, Forest plots of Olink protein concentrations (NPX) associated with Cardio_Resp (n = 365) (c), fatigue (n = 314) (d), Anx_Dep (n = 202) (e), GI (n = 124) (f) and cognitive (n = 60) (g). Neuro_Psych, neuropsychiatric. The error bars represent the median accuracy of the model. h,i, Distribution of Olink values (NPX) for IL-1R2 (h) and MATN2, neurofascin and sCD58 (i) measured between symptomatic and recovered individuals in recovered (n = 233), Cardio_Resp (n = 365), fatigue (n = 314) and Anx_Dep (n = 202) groups (h) and MATN2 in GI (n = 124), neurofascin in cognitive (n = 60) and sCD58 in Cardio_Resp and recovered groups (i). The box plot center line represents the median, the boundaries represent IQR and the whisker length represents 1.5× IQR. The median values were compared between groups using two-sided Wilcoxon signed-rank test, *P < 0.05, **P < 0.01, ***P < 0.001 and ****P < 0.0001.
To study the association of peripheral inflammation with symptoms, we analyzed cross-sectional data collected approximately 6 months after hospitalizations. We measured 368 immune mediators from plasma collected contemporaneously with symptom data. Mediators suggestive of myeloid inflammation were associated with all symptoms (Fig. 1c–h). Elevated IL-1R2, an IL-1 receptor expressed by monocytes and macrophages modulating inflammation11 and MATN2, an extracellular matrix protein that modulates tissue inflammation through recruitment of innate immune cells12, were associated with cardioresp (IL-1R2 OR 1.14, Fig. 1c,h), fatigue (IL-1R2 OR 1.45, Fig. 1d,h), anxiety/depression (IL-1R2 OR 1.34. Fig. 1e,h) and GI (MATN2 OR 1.08, Fig. 1f). IL-3RA, an IL-3 receptor, was associated with cardioresp (OR 1.07, Fig. 1c), fatigue (OR 1.21, Fig. 1d), anxiety/depression (OR 1.12, Fig. 1e) and GI (OR 1.06, Fig. 1f) groups, while CSF3, a cytokine promoting neutrophilic inflammation13, was elevated in cardioresp (OR 1.06, Fig. 1c), fatigue (OR 1.12, Fig. 1d) and GI (OR 1.08, Fig. 1f).
Elevated COLEC12, which initiates inflammation in tissues by activating the alternative complement pathway14, associated with cardioresp (OR 1.09, Fig. 1c), fatigue (OR 1.19, Fig. 1d) and anxiety/depression (OR 1.11, Fig. 1e), but not with GI (Fig. 1f) and only weakly with cognitive (OR 1.02, Fig. 1g). C1QA, a degradation product released by complement activation15 was associated with GI (OR 1.08, Fig. 1f) and cognitive (OR 1.03, Fig. 1g). C1QA, which is known to mediate dementia-related neuroinflammation16, had the third strongest association with cognitive (Fig. 1g). These observations indicated that myeloid inflammation and complement activation were associated with LC.
Increased expression of DPP10 and SCG3 was observed in the GI group compared with recovered (DPP10 OR 1.07 and SCG3 OR 1.08, Fig. 1f). DPP10 is a membrane protein that modulates tissue inflammation, and increased DPP10 expression is associated with inflammatory bowel disease17,18, suggesting that GI symptoms may result from enteric inflammation. Elevated SCG3, a multifunctional protein that has been associated with irritable bowel syndrome19, suggested that noninflammatory disturbance of the brain–gut axis or dysbiosis, may occur in the GI group. The cognitive group was associated with elevated CTSO (OR 1.04), NFASC (OR 1.03) and SPON-1 (OR 1.02, Fig. 1g,i). NFASC and SPON-1 regulate neural growth20,21, while CTSO is a cysteine proteinase supporting tissue turnover22. The increased expression of these three proteins as well as C1QA and DPP10 in the cognitive group (Fig. 1g) suggested neuroinflammation and alterations in nerve tissue repair, possibly resulting in neurodegeneration. Together, our findings indicated that complement activation and myeloid inflammation were common to all LC groups, but subtle differences were observed in the GI and cognitive groups, which may have mechanistic importance. Acutely elevated fibrinogen during hospitalization has been reported to be predictive of LC cognitive deficits23. We found elevated fibrinogen in LC relative to recovered (Extended Data Fig. 2a; P = 0.0077), although this was not significant when restricted to the cognitive group (P = 0.074), supporting our observation of complement pathway activation in LC and in keeping with reports that complement dysregulation and thrombosis drive severe COVID-19 (ref. 24).
Elevated sCD58 was associated with lower odds of all LC symptoms and was most pronounced in cardioresp (OR 0.85, Fig. 1c,i), fatigue (OR 0.80, Fig. 1d) and anxiety/depression (OR 0.83, Fig. 1e). IL-2 was negatively associated with the cardioresp (Fig. 1c, OR 0.87), fatigue (Fig. 1d, OR 0.80), anxiety/depression (Fig. 1e, OR 0.84) and cognitive (Fig. 1g, OR 0.96) groups. Both IL-2 and sCD58 have immunoregulatory functions25,26. Specifically, sCD58 suppresses IL-1- or IL-6-dependent interactions between CD2+ monocytes and CD58+ T or natural killer cells26. The association of sCD58 with recovered suggests a central role of dysregulated myeloid inflammation in LC. Elevated markers of tissue repair, IDS and DNER27,28, were also associated with recovered relative to all LC groups (Fig. 1c–g). Taken together, our data suggest that suppression of myeloid inflammation and enhanced tissue repair were associated with recovered, supporting the use of immunomodulatory agents in therapeutic trials29 (Supplementary Table 2).
We next sought to validate the experimental and analytical approaches used. Although Olink has been validated against other immunoassay platforms, showing superior sensitivity and specificity30,31, we confirmed the performance of Olink against chemiluminescent immunoassays within our cohort. We performed chemiluminescent immunoassays on plasma from a subgroup of 58 participants (recovered n = 13 and LC n = 45). There were good correlations between results from Olink (normalized protein expression (NPX)) and chemiluminescent immunoassays (pg ml−1) for CSF3, IL-1R2, IL-3RA, TNF and TFF2 (Extended Data Fig. 3). Most samples did not have concentrations of IL-2 detectable using a mesoscale discovery chemiluminescent assay, limiting this analysis to 14 samples (recovered n = 4, LC n = 10, R = 0.55 and P = 0.053, Extended Data Fig. 3). We next repeated our analysis using alternative definitions of LC. The Centers for Disease Control and Prevention and National Institute for Health and Care Excellence definitions for LC include symptoms occurring 1 month post infection32,33. Using the 1 month post-infection definition included 62 additional participants to our analysis (recovered n = 21, 3 females and median age 61 years and LC n = 41, 15 females and median age 60 years, Extended Data Fig. 2c) and found that inflammatory associations with each LC group were consistent with our analysis based on the WHO definition (Extended Data Fig. 2d–h). Finally, to validate the analytical approach (PLR) we examined the distribution of data, prioritizing proteins that were most strongly associated with each LC/recovered group (IL-1R2, MATN2, NFASC and sCD58). Each protein was significantly elevated in the LC group compared with recovered (Fig. 1h,i and Extended Data Fig. 4), consistent with the PLR. Alternative regression approaches (unadjusted regression models and partial least squares, PLS) reported results consistent with the original analysis of protein associations and LC outcome in the WHO-defined cohort (Fig. 1c–g, Supplementary Table 3 and Extended Data Figs. 5 and 6). The standard errors of PLS estimates were wide (Extended Data Fig. 6), consistent with previous demonstrations that PLR is the optimal method to analyze high-dimensional data where variables may have combined effects34. As inflammatory proteins are often colinear, working in-tandem to mediate effects, we prioritized PLR results to draw conclusions.
To explore the relationship between inflammatory mediators associated with different LC symptoms, we performed a network analysis of Olink mediators highlighted by PLR within each LC group. COLEC12 and markers of endothelial and mucosal inflammation (MATN2, PCDH1, ROBO1, ISM1, ANGPTL2, TGF-α and TFF2) were highly correlated within the cardioresp, fatigue and anxiety/depression groups (Fig. 2 and Extended Data Fig. 7). Elevated PCDH1, an adhesion protein modulating airway inflammation35, was highly correlated with other inflammatory proteins associated with the cardioresp group (Fig. 2), suggesting that systemic inflammation may arise from the lung in these individuals. This was supported by increased expression of IL-3RA, which regulates innate immune responses in the lung through interactions with circulating IL-3 (ref. 36), in fatigue (Figs. 1d and 2), which correlated with markers of tissue inflammation, including PCDH1 (Fig. 2). MATN2 and ISM1, mucosal proteins that enhance inflammation37,38, were highly correlated in the GI group (Fig. 2), highlighting the role of tissue-specific inflammation in different LC groups. SCG3 correlated less closely with mediators in the GI group (Fig. 2), suggesting that the brain–gut axis may contribute separately to some GI symptoms. SPON-1, which regulates neural growth21, was the most highly correlated mediator in the cognitive group (Fig. 2 and Extended Data Fig. 7), highlighting that processes within nerve tissue may underlie this group. These observations suggested that inflammation might arise from mucosal tissues and that additional mechanisms may contribute to pathophysiology underlying the GI and cognitive groups.

Network analysis of Olink mediators associated with cardioresp (n = 365), fatigue (n = 314), anxiety/depression (n = 202), GI (n = 124) and cognitive groups (n = 60). Each node corresponds to a protein mediator identified by PLR. The edges (blue lines) were weighted according to the size of Spearman’s rank correlation coefficient between proteins. All edges represent positive and significant correlations (P < 0.05) after FDR adjustment.
Women were more likely to experience LC (Table 1), as found in previous studies1. As estrogen can influence immunological responses39, we investigated whether hormonal differences between men and women with LC in our cohort explained this trend. We grouped men and women with LC symptoms into two age groups (those younger than 50 years and those 50 years and older, using age as a proxy for menopause status in women) and compared mediator levels between men and women in each age group, prioritizing those identified by PLR to be higher in LC compared with recovered. As we aimed to understand whether women with LC had stronger inflammatory responses than men with LC, we did not assess differences in men and women in the recovered group. IL-1R2 and MATN2 were significantly higher in women ≥50 years than men ≥50 years in the cardioresp group (Fig. 3a, IL-1R2 and MATN2) and the fatigue group (Fig. 3b). In the GI group, CSF3 was higher in women ≥50 years compared with men ≥50 years (Fig. 3c), indicating that the inflammatory markers observed in women were not likely to be estrogen-dependent. Women have been reported to have stronger innate immune responses to infection and to be at greater risk of autoimmunity39, possibly explaining why some women in the ≥50 years group had higher inflammatory proteins than men the same group. Proteins associated with the anxiety/depression (IL-1R2 P = 0.11 and MATN2 P = 0.61, Extended Data Fig. 8a) and cognitive groups (CTSO P = 0.64 and NFASC P = 0.41, Extended Data Fig. 8b) were not different between men and women in either age group, consistent with the absent/weak association between sex and these outcomes identified by PLR (Fig. 1e,g). Though our findings suggested that nonhormonal differences in inflammatory responses may explain why some women are more likely to have LC, they require confirmation in adequately powered studies.
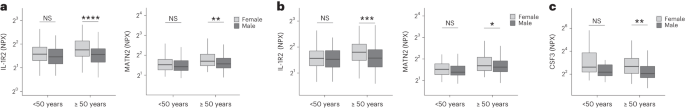
a–c, Olink-measured plasma protein levels (NPX) of IL-1R2 and MATN2 (a and b) and CSF3 (c) between LC men and LC women divided by age (<50 or ≥50 years) in the cardiorespiratory group (<50 years n = 8 and ≥50 years n = 270) (a), fatigue group (<50 years n = 81 and ≥50 years n = 227) (b) and GI group (<50 years n = 34 and ≥50 years n = 82) (c). the median values were compared between men and women using two-sided Wilcoxon signed-rank test, *P < 0.05, **P < 0.01, ***P < 0.001 and ****P < 0.0001. The box plot center line represents the median, the boundaries represent IQR and the whisker length represents 1.5× IQR.
To test whether local respiratory tract inflammation persisted after COVID-19, we compared nasosorption samples from 89 participants (recovered, n = 31; LC, n = 33; and healthy SARS-CoV-2 naive controls, n = 25, Supplementary Tables 4 and 5). Several inflammatory markers were elevated in the upper respiratory tract post COVID (including IL-1α, CXCL10, CXCL11, TNF, VEGF and TFF2) when compared with naive controls, but similar between recovered and LC (Fig. 4a). In the cardioresp group (n = 29), inflammatory mediators elevated in plasma (for example, IL-6, APO-2, TGF-α and TFF2) were not elevated in the upper respiratory tract (Extended Data Fig. 9a) and there was no correlation between plasma and nasal mediator levels (Extended Data Fig. 9b). This exploratory analysis suggested upper respiratory tract inflammation post COVID was not specifically associated with cardiorespiratory symptoms.

a, Nasal cytokines measured by immunoassay in post-COVID participants (n = 64) compared with healthy SARS-CoV-2 naive controls (n = 25), and between the the cardioresp group (n = 29) and the recovered group (n = 31). The red values indicate significantly increased cytokine levels after FDR adjustment (P < 0.05) using two-tailed Wilcoxon signed-rank test. b, SARS-CoV-2 N antigen measured in sputum by electrochemiluminescence from recovered (n = 17) and pooled LC (n = 23) groups, compared with BALF from SARS-CoV-2 naive controls (n = 9). The horizontal dashed line indicates the lower limit of detection of the assay. c, Plasma S- and N-specific IgG responses measured by electrochemiluminescence in the LC (n = 35) and recovered (n = 19) groups. The median values were compared using two-sided Wilcoxon signed-rank tests, NS P > 0.05, *P < 0.05, **P < 0.01, ***P < 0.001 and ****P < 0.0001. The box plot center lines represent the median, the boundaries represent IQR and the whisker length represents 1.5× IQR.
To explore whether SARS-CoV-2 persistence might explain the inflammatory profiles observed in the cardioresp group, we measured SARS-CoV-2 nucleocapsid (N) antigen in sputum from 40 participants (recovered n = 17 and LC n = 23) collected approximately 6 months post hospitalization (Supplementary Table 6). All samples were compared with prepandemic bronchoalveolar lavage fluid (n = 9, Supplementary Table 4). Only four samples (recovered n = 2 and LC n = 2) had N antigen above the assay’s lower limit of detection, and there was no difference in N antigen concentrations between LC and recovered (Fig. 4b, P = 0.78). These observations did not exclude viral persistence, which might require tissues samples for detection40,41. On the basis of the hypothesis that persistent viral antigen might prevent a decline in antibody levels over time, we examined the titers of SARS-CoV-2-specific antibodies in unvaccinated individuals (recovered n = 19 and LC n = 35). SARS-CoV-2 N-specific (P = 0.023) and spike (S)-specific (P = 0.0040) immunoglobulin G (IgG) levels were elevated in LC compared with recovered (Fig. 4c).
Overall, we identified myeloid inflammation and complement activation in the cardioresp, fatigue, anxiety/depression, cognitive and GI groups 6 months after hospitalization (Extended Data Fig. 10). Our findings build on results of smaller studies5,6,42 and are consistent with a genome-wide association study that identified an independent association between LC and FOXP4, which modulates neutrophilic inflammation and immune cell function43,44. In addition, we identified tissue-specific inflammatory elements, indicating that myeloid disturbance in different tissues may result in distinct symptoms. Multiple mechanisms for LC have been suggested, including autoimmunity, thrombosis, vascular dysfunction, SARS-CoV-2 persistence and latent virus reactivation1. All these processes involve myeloid inflammation and complement activation45. Complement activation in LC has been suggested in a proteomic study in 97 mostly nonhospitalized COVID-19 cases42 and a study of 48 LC patients, of which one-third experienced severe acute disease46. As components of the complement system are known to have a short half-life47, ongoing complement activation suggests active inflammation rather than past tissue damage from acute infection.
Despite the heterogeneity of LC and the likelihood of coexisting or multiple etiologies, our work suggests some common pathways that might be targeted therapeutically and supports the rationale for several drugs currently under trial. Our finding of increased sCD58 levels (associated with suppression of monocyte–lymphocyte interactions26) in the recovered group, strengthens our conclusion that myeloid inflammation is central to the biology of LC and that trials of steroids, IL-1 antagonists, JAK inhibitors, naltrexone and colchicine are justified. Although anticoagulants such as apixaban might prevent thrombosis downstream of complement dysregulation, they can also increase the risk of serious bleeding when given after COVID-19 hospitalization48. Thus, clinical trials, already underway, need to carefully assess the risks and benefits of anticoagulants (Supplementary Table 2).
Our finding of elevated S- and N-specific IgG in LC could suggest viral persistence, as found in other studies6,42,49. Our network analysis indicated that inflammatory proteins in the cardioresp group interacted strongly with ISM1 and ROBO1, which are expressed during respiratory tract infection and regulate lung inflammation50,51. Although we were unable to find SARS-CoV-2 antigen in sputum from our LC cases, we did not test for viral persistence in GI tract and lung tissue40,41 or in plasma52. Evidence of SARS-CoV-2 persistence would justify trials of antiviral drugs (singly or in combination) in LC. It is also possible that autoimmune processes could result in an innate inflammatory profile in LC. Autoreactive B cells have been identified in LC patients with higher SARS-CoV-2-specific antibody titers in a study of mostly mild acute COVID cases (59% WHO 2–3)42, a different population from our study of hospitalized cases.
Our observations of distinct protein profiles in GI and cognitive groups support previous reports on distinct associations between Epstein–Barr virus reactivation and neurological symptoms, or autoantibodies and GI symptoms relative to other forms of LC49,53. We did not assess autoantibody induction but found evidence of brain–gut axis disturbance (SCG3) in the GI group, which occurs in many autoimmune diseases54. We found signatures suggestive of neuroinflammation (C1QA) in the cognitive group, consistent with findings of brain abnormalities on magnetic resonance imaging after COVID-19 hospitalization55, as well as findings of microglial activation in mice after COVID-19 (ref. 56). Proinflammatory signatures dominated in the cardioresp, fatigue and anxiety/depression groups and were consistent with those seen in non-COVID depression, suggesting shared mechanisms57. The association between markers of myeloid inflammation, including IL-3RA, and symptoms was greatest for fatigue. Whilst membrane-bound IL-3RA facilitates IL-3 signaling upstream of myelopoesis36 its soluble form (measured in plasma) can bind IL-3 and can act as a decoy receptor, preventing monocyte maturation and enhancing immunopathology58. Monocytes from individuals with post-COVID fatigue are reported to have abnormal expression profiles (including reduced CXCR2), suggestive of altered maturation and migration5,59. Lung-specific inflammation was suggested by the association between PCDH1 (an airway epithelial adhesion molecule35) and cardioresp symptoms.
Our observations do not align with all published observations on LC. One proteomic study of 55 LC cases after generally mild (WHO 2–3) acute disease found that TNF and IFN signatures were elevated in LC3. Vasculoproliferative processes and metabolic disturbance have been reported in LC4,60, but these studies used uninfected healthy individuals for comparison and cannot distinguish between LC-specific phenomena and residual post-COVID inflammation. A study of 63 adults (LC, n = 50 and recovered, n = 13) reported no association between immune cell activation and LC 3 months after infection61, though myeloid inflammation was not directly measured, and 3 months post infection may be too early to detect subtle differences between LC and recovered cases due to residual acute inflammation.
Our study has limitations. We designed the study to identify inflammatory markers identifying pathways underlying LC subgroups rather than diagnostic biomarkers. The ORs we report are small, but associations were consistent across alternative methods of analysis and when using different LC definitions. Small effect sizes can be expected when using PLR, which shrinks correlated mediator coefficients to reflect combined effects and prevent colinear inflation62, and could also result from measurement of plasma mediators that may underestimate tissue inflammation. Although our LC cohort is large compared with most other published studies, some of our subgroups are small (only 60 cases were designated cognitive). Though the performance of the cognitive PLR model was adequate, our findings should be validated in larger studies. It should be noted that our cohort of hospitalized cases may not represent all types of LC, especially those occurring after mild infection. We looked for an effect of acute disease severity within our study and did not find it, and are reassured that the inflammatory profiles we observed were consistent with those seen in smaller studies including nonhospitalized cases42,46. Studies of posthospital LC may be confounded by ‘posthospital syndrome’, which encompasses general and nonspecific effects of hospitalization (particularly intensive care)63.
In conclusion, we found markers of myeloid inflammation and complement activation in our large prospective posthospital cohort of patients with LC, in addition to distinct inflammatory patterns in patients with cognitive impairment or gastrointestinal symptoms. These findings show the need to consider subphenotypes in managing patients with LC and support the use of antiviral or immunomodulatory agents in controlled therapeutic trials.
Methods
Study design and ethics
After hospitalization for COVID-19, adults who had no comorbidity resulting in a prognosis of less than 6 months were recruited to the PHOSP-COVID study (n = 719). Patients hospitalized between February 2020 and January 2021 were recruited. Both sexes were recruited and gender was self-reported (female, n = 257 and male, n = 462). Written informed consent was obtained from all patients. Ethical approvals for the PHOSP-COVID study were given by Leeds West Research Ethics Committee (20/YH/0225).
Symptom data and samples were prospectively collected from individuals approximately 6 months (IQR 5.1–6.8 months and range 3.0–8.3 months) post hospitalization (Fig. 1a), via the PHOSP-COVID multicenter United Kingdom study64. Data relating to patient demographics and acute admission were collected via the International Severe Acute Respiratory and Emerging Infection Consortium World Health Organization Clinical Characterisation Protocol United Kingdom (ISARIC4C study; IRAS260007/IRAS126600) (ref. 65). Adults hospitalized during the SARS-CoV-2 pandemic were systematically recruited into ISARIC4C. Written informed consent was obtained from all patients. Ethical approval was given by the South Central–Oxford C Research Ethics Committee in England (reference 13:/SC/0149), Scotland A Research Ethics Committee (20/SS/0028) and WHO Ethics Review Committee (RPC571 and RPC572l, 25 April 2013).
Data were collected to account for variables affecting symptom outcome, via hospital records and self-reporting. Acute disease severity was classified according to the WHO clinical progression score: WHO class 3–4: no oxygen therapy; class 5: oxygen therapy; class 6: noninvasive ventilation or high-flow nasal oxygen; and class 7–9: managed in critical care9. Clinical data were used to place patients into six categories: ‘recovered’, ‘GI’, ‘cardiorespiratory’, ‘fatigue’, ‘cognitive impairment’ and ‘anxiety/depression’ (Supplementary Table 7). Patient-reported symptoms and validated clinical scores were used when feasible, including Medical Research Council (MRC) breathlessness score, dyspnea-12 score, Functional Assessment of Chronic Illness Therapy (FACIT) score, Patient Health Questionnaire (PHQ)-9 and Generalized Anxiety Disorder (GAD)-7. Cognitive impairment was defined as a Montreal Cognitive Assessment score <26. GI symptoms were defined as answering ‘Yes’ to the presence of at least two of the listed symptoms. ‘Recovered’ was defined by self-reporting. Patients were placed in multiple groups if they experienced a combination of symptoms.
Matched nasal fluid and sputum samples were prospectively collected from a subgroup of convalescent patients approximately 6 months after hospitalization via the PHOSP-COVID study. Nasal and bronchoalveolar lavage fluid (BALF) collected from healthy volunteers before the COVID-19 pandemic were used as controls (Supplementary Table 4). Written consent was obtained for all individuals and ethical approvals were given by London–Harrow Research Ethics Committee (13/LO/1899) for the collection of nasal samples and the Health Research Authority London–Fulham Research Ethics Committee (IRAS project ID 154109; references 14/LO/1023, 10/H0711/94 and 11/LO/1826) for BALF samples.
Procedures
Ethylenediaminetetraacetic acid plasma was collected from whole blood taken by venepuncture and frozen at −80 °C as previously described7,66. Nasal fluid was collected using a NasosorptionTM FX·I device (Hunt Developments), which uses a synthetic absorptive matrix to collect concentrated nasal fluid. Samples were eluted and stored as previously described67. Sputum samples were collected via passive expectoration and frozen at −80 °C without the addition of buffers. Sputum samples from convalescent individuals were compared with BALF from healthy SARS-CoV-2-naive controls, collected before the pandemic. BALF samples were used to act as a comparison for lower respiratory tract samples since passively expectorated sputum from healthy SARS-CoV-2-naive individuals was not available. BALF samples were obtained by instillation and recovery of up to 240 ml of normal saline via a fiberoptic bronchoscope. BALF was filtered through 100 µM strainers into sterile 50 ml Falcon tubes, then centrifuged for 10 min at 400 g at 4 °C. The resulting supernatant was transferred into sterile 50 ml Falcon tubes and frozen at −80 °C until use. The full methods for BALF collection and processing have been described previously68,69.
Immunoassays
To determine inflammatory signatures that associated with symptom outcomes, plasma samples were analyzed on an Olink Explore 384 Inflammation panel70. Supplementary Table 8 (Appendix 1) lists all the analytes measured. To ensure the validity of results, samples were run in a single batch with the use of negative controls, plate controls in triplicate and repeated measurement of patient samples between plates in duplicate. Samples were randomized between plates according to site and sample collection date. Randomization between plates was blind to LC/recovered outcome. Data were first normalized to an internal extension control that was included in each sample well. Plates were standardized by normalizing to interplate controls, run in triplicate on each plate. Each plate contained a minimum of four patient samples, which were duplicates on another plate; these duplicate pairs allowed any plate to be linked to any other through the duplicates. Data were then intensity normalized across all cohort samples. Finally, Olink results underwent quality control processing and samples or analytes that did not reach quality control standards were excluded. Final normalized relative protein quantities were reported as log2 NPX values.
To further validate our findings, we performed conventional electrochemiluminescence (ECL) assays and enzyme-linked immunosorbent assay for Olink mediators that were associated with symptom outcome (Supplementary Methods). Contemporaneously collected plasma samples were available from 58 individuals. Like most omics platforms, Olink measures relative quantities, so perfect agreement with conventional assays that measure absolute concentrations is not expected.
Sputum samples were thawed before analysis and sputum plugs were extracted with the addition of 0.1% dithiothreitol creating a one in two sample dilution, as previously described71. SARS-CoV-2 S and N proteins were measured by ECL S-plex assay at a fixed dilution of one in two (Mesoscale Diagnostics), as per the manufacturers protocol72. Control BALF samples were thawed and measured on the same plate, neat. The S-plex assay is highly sensitive in detecting viral antigen in respiratory tract samples73.
Nasal cytokines were measured by ECL (mesoscale discovery) and Luminex bead multiplex assays (Biotechne). The full methods and list of analytes are detailed in Supplementary Methods.
Statistics and reproducibility
Clinical data was collected via the PHOSP REDCap database, to which access is available under reasonable request as per the data sharing statement in the manuscript. All analyses were performed within the Outbreak Data Analysis Platform (ODAP). All data and code can be accessed using information in the ‘Data sharing’ and ‘Code sharing’ statements at the end of the manuscript. No statistical method was used to predetermine sample size. Data distribution was assumed to be normal but this was not formally tested. Olink assays and immunoassays were randomized and investigators were blinded to outcomes.
To determine protein signatures that associated with each symptom outcome, a ridge PLR was used. PLR shrinks coefficients to account for combined effects within high-dimensional data, preventing false discovery while managing multicollinearity34. Thus, PLR was chosen a priori as the most appropriate model to assess associations between a large number of explanatory variables (that may work together to mediate effects) and symptom outcome34,62,70,74. In keeping with our aim to perform an unbiased exploration of inflammatory process, the model alpha was set to zero, facilitating regularization without complete penalization of any mediator. This enabled review of all possible mediators that might associate with LC62.
A 50 repeats tenfold nested cross-validation was used to select the optimal lambda for each model and assess its accuracy (Extended Data Fig. 1). The performance of the cognitive impairment model was influenced by the imbalance in size of the symptom group (n = 60) relative to recovered (n = 250). The model was weighted to account for this imbalance resulting in a sensitivity of 0.98, indicating its validity. We have expanded on the model performance and validation approaches in Supplementary Information.
Age, sex, acute disease severity and preexisting comorbidities were included as covariates in the PLR analysis (Supplementary Tables 1 and 3). Covariates were selected a priori using features reported to influence the risk of LC and inflammatory responses1,39,64,75. Ethnicity was not included since it has been shown not to predict symptom outcome in this cohort64. Individuals with missing data were excluded from the regression analysis. Each symptom group was compared with the ‘recovered’ group. The model coefficients of each covariate were converted into ORs for each outcome and visualized in a forest plot, after removing variables associated with regularized OR between 0.98 and 1.02 or in cases where most variables fell outside of this range, using mediators associated with the highest decile of coefficients either side of this range. This enabled exclusion of mediators with effect sizes that were unlikely to have clinical or mechanistic importance since the ridge PLR shrinks and orders coefficients according to their relative importance rather than making estimates with standard error. Thus, confidence intervals cannot be appropriately derived from PLR, and forest plot error bars were calculated using the median accuracy of the model generated by the nested cross-validation. To verify observations made through PLR analysis, we also performed an unadjusted PLR, an unadjusted logistic regression and a PLS analysis. Univariate analyses using Wilcoxon signed-rank test was also performed (Supplementary Table 8, Appendix 1). Analyses were performed in R version 4.2.0 using ‘data.table v1.14.2’, ‘EnvStats v2.7.0’ ‘tidyverse v1.3.2’, ‘lme4 v1.1-32’, ‘caret v6.0-93’, ‘glmnet v4.1-6’, ‘mdatools v0.14.0’, ‘ggpubbr v0.4.0’ and ‘ggplot2 v3.3.6’ packages.
To further investigate the relationship between proteins elevated in each symptom group, we performed a correlation network analysis using Spearman’s rank correlation coefficient and false discovery rate (FDR) thresholding. The mediators visualized in the PLR forest plots, which were associated with cardiorespiratory symptoms, fatigue, anxiety/depression GI symptoms and cognitive impairment were used, respectively. Analyses were performed in R version 4.2.0 using ‘bootnet v1.5.6’ and ‘qgraph v1.9.8’ packages.
To determine whether differences in protein levels between men and women related to hormonal differences, we divided each symptom group into premenopausal and postmenopausal groups using an age cutoff of 50 years old. Differences between sexes in each group were determined using the Wilcoxon signed-rank test. To understand whether antigen persistence contributed to inflammation in adults with LC, the median viral antigen concentration from sputum/BALF samples and cytokine concentrations from nasal samples were compared using the Wilcoxon signed-rank test. All tests were two-tailed and statistical significance was defined as a P value < 0.05 after adjustment for FDR (q-value of 0.05). Analyses were performed in R version 4.2.0 using ‘bootnet v1.5.6’ and ‘qgraph v1.9.8’ packages.
Extended Data Fig. 10 was made using Biorender, accessed at www.biorender.com.
Reporting summary
Further information on research design is available in the Nature Portfolio Reporting Summary linked to this article.
Data availability
This is an open access article under the CC BY 4.0 license.
The PHOSP-COVID protocol, consent form, definition and derivation of clinical characteristics and outcomes, training materials, regulatory documents, information about requests for data access, and other relevant study materials are available online at ref. 76. Access to these materials can be granted by contacting phosp@leicester.ac.uk and Phospcontracts@leicester.ac.uk.
The ISARIC4C protocol, data sharing and publication policy are available at https://isaric4c.net. ISARIC4C’s Independent Data and Material Access Committee welcomes applications for access to data and materials (https://isaric4c.net).
The datasets used in the study contain extensive clinical information at an individual level that prevent them from being deposited in an public depository due to data protection policies of the study. Study data can only be accessed via the ODAP, a protected research environment. All data used in this study are available within ODAP and accessible under reasonable request. Data access criteria and information about how to request access is available online at ref. 76. If criteria are met and a request is made, access can be gained by signing the eDRIS user agreement.
Code availability
Code was written within the ODAP, using R v4.2.0 and publicly available packages (‘data.table v1.14.2’, ‘EnvStats v2.7.0’, ‘tidyverse v1.3.2’, ‘lme4 v1.1-32’, ‘caret v6.0-93’, ‘glmnet v4.1-6’, ‘mdatools v0.14.0’, ‘ggpubbr v0.4.0’, ‘ggplot2 v3.3.6’, ‘bootnet v1.5.6’ and ‘qgraph v1.9.8’ packages). No new algorithms or functions were created and code used in-built functions in listed packages available on CRAN. The code used to generate data and to analyze data is publicly available at https://github.com/isaric4c/wiki/wiki/ISARIC; https://github.com/SurgicalInformatics/cocin_cc and https://github.com/ClaudiaEfstath/PHOSP_Olink_NatImm.
References
Davis, H. E., McCorkell, L., Vogel, J. M. & Topol, E. J. Long COVID: major findings, mechanisms and recommendations. Nat. Rev. Microbiol. 21, 133–146 (2023).
Antonelli, M., Pujol, J. C., Spector, T. D., Ourselin, S. & Steves, C. J. Risk of long COVID associated with delta versus omicron variants of SARS-CoV-2. Lancet 399, 2263–2264 (2022).
Talla, A. et al. Persistent serum protein signatures define an inflammatory subcategory of long COVID. Nat. Commun. 14, 3417 (2023).
Captur, G. et al. Plasma proteomic signature predicts who will get persistent symptoms following SARS-CoV-2 infection. EBioMedicine 85, 104293 (2022).
Scott, N. A. et al. Monocyte migration profiles define disease severity in acute COVID-19 and unique features of long COVID. Eur. Respir. J. https://doi.org/10.1183/13993003.02226-2022 (2023).
Klein, J. et al. Distinguishing features of Long COVID identified through immune profiling. Nature https://doi.org/10.1038/s41586-023-06651-y (2023).
Evans, R. A. et al. Clinical characteristics with inflammation profiling of long COVID and association with 1-year recovery following hospitalisation in the UK: a prospective observational study. Lancet Respir. Med. 10, 761–775 (2022).
Houchen-Wolloff, L. et al. Joint patient and clinician priority setting to identify 10 key research questions regarding the long-term sequelae of COVID-19. Thorax 77, 717–720 (2022).
Marshall, J. C. et al. A minimal common outcome measure set for COVID-19 clinical research. Lancet Infect. Dis. 20, e192–e197 (2020).
Post COVID-19 condition (long COVID). World Health Organization https://www.who.int/europe/news-room/fact-sheets/item/post-covid-19-condition#:~:text=Definition,months%20with%20no%20other%20explanation (2022).
Peters, V. A., Joesting, J. J. & Freund, G. G. IL-1 receptor 2 (IL-1R2) and its role in immune regulation. Brain Behav. Immun. 32, 1–8 (2013).
Luo, Z. et al. Monocytes augment inflammatory responses in human aortic valve interstitial cells via β2-integrin/ICAM-1-mediated signaling. Inflamm. Res. 71, 681–694 (2022).
Bendall, L. J. & Bradstock, K. F. G-CSF: from granulopoietic stimulant to bone marrow stem cell mobilizing agent. Cytokine Growth Factor Rev. 25, 355–367 (2014).
Ma, Y. J. et al. Soluble collectin-12 (CL-12) is a pattern recognition molecule initiating complement activation via the alternative pathway. J. Immunol. 195, 3365–3373 (2015).
Laursen, N. S. et al. Functional and structural characterization of a potent C1q inhibitor targeting the classical pathway of the complement system. Front. Immunol. 11, 1504 (2020).
Dejanovic, B. et al. Complement C1q-dependent excitatory and inhibitory synapse elimination by astrocytes and microglia in Alzheimer’s disease mouse models. Nat. Aging 2, 837–850 (2022).
Xue, G., Hua, L., Zhou, N. & Li, J. Characteristics of immune cell infiltration and associated diagnostic biomarkers in ulcerative colitis: results from bioinformatics analysis. Bioengineered 12, 252–265 (2021).
He, T. et al. Integrative computational approach identifies immune‐relevant biomarkers in ulcerative colitis. FEBS Open Bio. 12, 500–515 (2022).
Sundin, J. et al. Fecal chromogranins and secretogranins are linked to the fecal and mucosal intestinal bacterial composition of IBS patients and healthy subjects. Sci. Rep. 8, 16821 (2018).
Kriebel, M., Wuchter, J., Trinks, S. & Volkmer, H. Neurofascin: a switch between neuronal plasticity and stability. Int. J. Biochem. Cell Biol. 44, 694–697 (2012).
Woo, W.-M. et al. The C. elegans F-spondin family protein SPON-1 maintains cell adhesion in neural and non-neural tissues. Development 135, 2747–2756 (2008).
Yadati, T., Houben, T., Bitorina, A. & Shiri-Sverdlov, R. The ins and outs of cathepsins: physiological function and role in disease management. Cells 9, 1679 (2020).
Taquet, M. et al. Acute blood biomarker profiles predict cognitive deficits 6 and 12 months after COVID-19 hospitalization. Nat. Med. https://doi.org/10.1038/s41591-023-02525-y (2023).
Siggins, M. K. et al. Alternative pathway dysregulation in tissues drives sustained complement activation and predicts outcome across the disease course in COVID‐19. Immunology 168, 473–492 (2023).
Pol, J. G., Caudana, P., Paillet, J., Piaggio, E. & Kroemer, G. Effects of interleukin-2 in immunostimulation and immunosuppression. J. Exp. Med. 217, e20191247 (2020).
Zhang, Y., Liu, Q., Yang, S. & Liao, Q. CD58 immunobiology at a glance. Front. Immunol. 12, 705260 (2021).
Demydchuk, M. et al. Insights into Hunter syndrome from the structure of iduronate-2-sulfatase. Nat. Commun. 8, 15786 (2017).
Wang, Z. et al. DNER promotes epithelial–mesenchymal transition and prevents chemosensitivity through the Wnt/β-catenin pathway in breast cancer. Cell Death Dis. 11, 642 (2020).
Bonilla, H. et al. Therapeutic trials for long COVID-19: a call to action from the interventions taskforce of the RECOVER initiative. Front. Immunol. 14, 1129459 (2023).
Wik, L. et al. Proximity extension assay in combination with next-generation sequencing for high-throughput proteome-wide analysis. Mol. Cell. Proteomics 20, 100168 (2021).
Measuring protein biomarkers with Olink—technical comparisons and orthogonal validation. Olink Proteomics https://www.olink.com/content/uploads/2021/09/olink-technical-comparisons-and-orthogonal-validation-1118-v2.0.pdf (2021).
COVID-19 rapid guideline: managing the long-term effects of COVID-19. National Institute for Health and Care Excellence (NICE), Scottish Intercollegiate Guidelines Network (SIGN) and Royal College of General Practitioners (RCGP) https://www.nice.org.uk/guidance/ng188/resources/covid19-rapid-guideline-managing-the-longterm-effects-of-covid19-pdf-51035515742 (2022).
Long COVID or post-COVID conditions. Centers for Disease Control and Prevention https://www.cdc.gov/coronavirus/2019-ncov/long-term-effects/index.html#:~:text=Long%20COVID%20is%20broadly%20defined,after%20acute%20COVID%2D19%20infection (2023).
Firinguetti, L., Kibria, G. & Araya, R. Study of partial least squares and ridge regression methods. Commun. Stat. Simul. Comput 46, 6631–6644 (2017).
Mortensen, L. J., Kreiner-Moller, E., Hakonarson, H., Bonnelykke, K. & Bisgaard, H. The PCDH1 gene and asthma in early childhood. Eur. Respir. J. 43, 792–800 (2014).
Tong, Y. et al. The RNFT2/IL-3Rα axis regulates IL-3 signaling and innate immunity. JCI Insight 5, e133652 (2020).
Wu, Y. et al. Effect of ISM1 on the immune microenvironment and epithelial-mesenchymal transition in colorectal cancer. Front. Cell Dev. Biol. 9, 681240 (2021).
Luo, G. G. & Ou, J. J. Oncogenic viruses and cancer. Virol. Sin. 30, 83–84 (2015).
Klein, S. L. & Flanagan, K. L. Sex differences in immune responses. Nat. Rev. Immunol. 16, 626–638 (2016).
Gaebler, C. et al. Evolution of antibody immunity to SARS-CoV-2. Nature 591, 639–644 (2021).
Bussani, R. et al. Persistent SARS‐CoV‐2 infection in patients seemingly recovered from COVID‐19. J. Pathol. 259, 254–263 (2023).
Woodruff, M. C. et al. Chronic inflammation, neutrophil activity, and autoreactivity splits long COVID. Nat. Commun. 14, 4201 (2023).
Lammi, V. et al. Genome-wide association study of long COVID. Preprint at medRxiv https://doi.org/10.1101/2023.06.29.23292056 (2023).
Ismailova, A. et al. Identification of a forkhead box protein transcriptional network induced in human neutrophils in response to inflammatory stimuli. Front. Immunol. 14, 1123344 (2023).
Beurskens, F. J., van Schaarenburg, R. A. & Trouw, L. A. C1q, antibodies and anti-C1q autoantibodies. Mol. Immunol. 68, 6–13 (2015).
Cervia-Hasler, C. et al. Persistent complement dysregulation with signs of thromboinflammation in active long Covid. Science 383, eadg7942 (2024).
Morgan, B. P. & Harris, C. L. Complement, a target for therapy in inflammatory and degenerative diseases. Nat. Rev. Drug Discov. 14, 857–877 (2015).
Toshner, M. R. et al. Apixaban following discharge in hospitalised adults with COVID-19: preliminary results from a multicentre, open-label, randomised controlled platform clinical trial. Preprint at medRxiv, https://doi.org/10.1101/2022.12.07.22283175 (2022).
Su, Y. et al. Multiple early factors anticipate post-acute COVID-19 sequelae. Cell 185, 881–895.e20 (2022).
Branchfield, K. et al. Pulmonary neuroendocrine cells function as airway sensors to control lung immune response. Science 351, 707–710 (2016).
Rivera-Torruco, G. et al. Isthmin 1 identifies a subset of lung hematopoietic stem cells and it is associated with systemic inflammation. J. Immunol. 202, 118.18 (2019).
Swank, Z. et al. Persistent circulating severe acute respiratory syndrome coronavirus 2 spike is associated with post-acute coronavirus disease 2019 sequelae. Clin. Infect. Dis. 76, e487–e490 (2023).
Peluso, M. J. et al. Chronic viral coinfections differentially affect the likelihood of developing long COVID. J. Clin. Invest. 133, e163669 (2023).
Bellocchi, C. et al. The interplay between autonomic nervous system and inflammation across systemic autoimmune diseases. Int. J. Mol. Sci. 23, 2449 (2022).
Raman, B. et al. Multiorgan MRI findings after hospitalisation with COVID-19 in the UK (C-MORE): a prospective, multicentre, observational cohort study. Lancet Respir. Med 11, 1003–1019 (2023).
Fernández-Castañeda, A. et al. Mild respiratory COVID can cause multi-lineage neural cell and myelin dysregulation. Cell 185, 2452–2468.e16 (2022).
Dantzer, R., O’Connor, J. C., Freund, G. G., Johnson, R. W. & Kelley, K. W. From inflammation to sickness and depression: when the immune system subjugates the brain. Nat. Rev. Neurosci. 9, 46–56 (2008).
Broughton, S. E. et al. Dual mechanism of interleukin-3 receptor blockade by an anti-cancer antibody. Cell Rep. 8, 410–419 (2014).
Ley, K., Miller, Y. I. & Hedrick, C. C. Monocyte and macrophage dynamics during atherogenesis. Arterioscler. Thromb. Vasc. Biol. 31, 1506–1516 (2011).
Iosef, C. et al. Plasma proteome of long-COVID patients indicates HIF-mediated vasculo-proliferative disease with impact on brain and heart function. J. Transl. Med. 21, 377 (2023).
Santopaolo, M. et al. Prolonged T-cell activation and long COVID symptoms independently associate with severe COVID-19 at 3 months. eLife 12, e85009 (2023).
Friedman, J., Hastie, T. & Tibshirani, R. Regularization paths for generalized linear models via coordinate descent. J. Stat. Softw. 33, 1–22 (2010).
Voiriot, G. et al. Chronic critical illness and post-intensive care syndrome: from pathophysiology to clinical challenges. Ann. Intensive Care 12, 58 (2022).
Evans, R. A. et al. Physical, cognitive, and mental health impacts of COVID-19 after hospitalisation (PHOSP-COVID): a UK multicentre, prospective cohort study. Lancet Respir. Med 9, 1275–1287 (2021).
Docherty, A. B. et al. Features of 20,133 UK patients in hospital with covid-19 using the ISARIC WHO clinical characterisation protocol: prospective observational cohort study. BMJ https://doi.org/10.1136/bmj.m1985 (2020).
Elneima, O. et al. Cohort profile: post-hospitalisation COVID-19 study (PHOSP-COVID). Preprint at medRxiv https://doi.org/10.1101/2023.05.08.23289442 (2023).
Liew, F. et al. SARS-CoV-2-specific nasal IgA wanes 9 months after hospitalisation with COVID-19 and is not induced by subsequent vaccination. EBioMedicine 87, 104402 (2023).
Ascough, S. et al. Divergent age-related humoral correlates of protection against respiratory syncytial virus infection in older and young adults: a pilot, controlled, human infection challenge model. Lancet Healthy Longev. 3, e405–e416 (2022).
Guvenel, A. et al. Epitope-specific airway-resident CD4+ T cell dynamics during experimental human RSV infection. J. Clin. Invest. 130, 523–538 (2019).
Greenwood, C. J. et al. A comparison of penalised regression methods for informing the selection of predictive markers. PLoS ONE 15, e0242730 (2020).
Higham, A. et al. Leukotriene B4 levels in sputum from asthma patients. ERJ Open Res. 2, 00088–02015 (2016).
SARS-CoV-2 spike kit. MSD https://www.mesoscale.com/~/media/files/product%20inserts/s-plex%20sars-cov-2%20spike%20kit%20product%20insert.pdf (2023).
Ren, A. et al. Ultrasensitive assay for saliva-based SARS-CoV-2 antigen detection. Clin. Chem. Lab. Med. 60, 771–777 (2022).
Breheny, P. & Huang, J. Penalized methods for bi-level variable selection. Stat. Interface 2, 369–380 (2009).
Thwaites, R. S. et al. Inflammatory profiles across the spectrum of disease reveal a distinct role for GM-CSF in severe COVID-19. Sci. Immunol. 6, eabg9873 (2021).
Resources. PHOSP-COVID https://phosp.org/resource/ (2022).
Acknowledgements
This research used data assets made available by ODAP as part of the Data and Connectivity National Core Study, led by Health Data Research UK in partnership with the Office for National Statistics and funded by UK Research and Innovation (grant ref. MC_PC_20058). This work is supported by the following grants: the PHOSP-COVD study is jointly funded by UK Research and Innovation and National Institute of Health and Care Research (NIHR; grant references MR/V027859/1 and COV0319). ISARIC4C is supported by grants from the National Institute for Health and Care Research (award CO-CIN-01) and the MRC (grant MC_PC_19059) Liverpool Experimental Cancer Medicine Centre provided infrastructure support for this research (grant reference C18616/A25153). Other grants that have supported this work include the UK Coronavirus Immunology Consortium (funder reference 1257927), the Imperial Biomedical Research Centre (NIHR Imperial BRC, grant IS-BRC-1215-20013), the Health Protection Research Unit in Respiratory Infections at Imperial College London and NIHR Health Protection Research Unit in Emerging and Zoonotic Infections at University of Liverpool, both in partnership with Public Health England, (NIHR award 200907), Wellcome Trust and Department for International Development (215091/Z/18/Z), Health Data Research UK (grant code 2021.0155), MRC (grant code MC_UU_12014/12) and NIHR Clinical Research Network for providing infrastructure support for this research. We also acknowledge the support of the MRC EMINENT Network (MR/R502121/1), which is cofunded by GSK, the Comprehensive Local Research Networks, the MRC HIC-Vac network (MR/R005982/1) and the RSV Consortium in Europe Horizon 2020 Framework Grant 116019. F.L. is supported by an MRC clinical training fellowship (award MR/W000970/1). C.E. is funded by NIHR (grant P91258-4). L.-P.H. is supported by Oxford NIHR Biomedical Research Centre. A.A.R.T. is supported by a British Heart Foundation (BHF) Intermediate Clinical Fellowship (FS/18/13/33281). S.L.R.-J. receives support from UK Research and Innovation (UKRI), Global Challenges Research Fund (GCRF), Rosetrees Trust, British HIV association (BHIVA), European & Developing Countries Clinical Trials Partnership (EDCTP) and Globvac. J.D.C. has grants from AstraZeneca, Boehringer Ingelheim, GSK, Gilead Sciences, Grifols, Novartis and Insmed. R.A.E. holds a NIHR Clinician Scientist Fellowship (CS-2016-16-020). A. Horsley is currently supported by UK Research and Innovation, NIHR and NIHR Manchester BRC. B.R. receives support from BHF Oxford Centre of Research Excellence, NIHR Oxford BRC and MRC. D.G.W. is supported by an NIHR Advanced Fellowship. A. Ho has received support from MRC and for the Coronavirus Immunology Consortium (MR/V028448/1). L.T. is supported by the US Food and Drug Administration Medical Countermeasures Initiative contract 75F40120C00085 and the National Institute for Health Research Health Protection Research Unit in Emerging and Zoonotic Infections (NIHR200907) at the University of Liverpool in partnership with UK Health Security Agency (UK-HSA), in collaboration with Liverpool School of Tropical Medicine and the University of Oxford. L.V.W. has received support from UKRI, GSK/Asthma and Lung UK and NIHR for this study. M.G.S. has received support from NIHR UK, MRC UK and Health Protection Research Unit in Emerging and Zoonotic Infections, University of Liverpool. J.K.B. is supported by the Wellcome Trust (223164/Z/21/Z) and UKRI (MC_PC_20004, MC_PC_19025, MC_PC_1905, MRNO2995X/1 and MC_PC_20029). The funders were not involved in the study design, interpretation of data or writing of this manuscript. The views expressed are those of the authors and not necessarily those of the Department of Health and Social Care (DHSC), the Department for International Development (DID), NIHR, MRC, the Wellcome Trust, UK-HSA, the National Health Service or the Department of Health. P.J.M.O. is supported by a NIHR Senior Investigator Award (award 201385). We thank all the participants and their families. We thank the many research administrators, health-care and social-care professionals who contributed to setting up and delivering the PHOSP-COVID study at all of the 65 NHS trusts/health boards and 25 research institutions across the United Kingdom, as well as those who contributed to setting up and delivering the ISARIC4C study at 305 NHS trusts/health boards. We also thank all the supporting staff at the NIHR Clinical Research Network, Health Research Authority, Research Ethics Committee, Department of Health and Social Care, Public Health Scotland and Public Health England. We thank K. Holmes at the NIHR Office for Clinical Research Infrastructure for her support in coordinating the charities group. The PHOSP-COVID industry framework was formed to provide advice and support in commercial discussions, and we thank the Association of the British Pharmaceutical Industry as well the NIHR Office for Clinical Research Infrastructure for coordinating this. We are very grateful to all the charities that have provided insight to the study: Action Pulmonary Fibrosis, Alzheimer’s Research UK, Asthma and Lung UK, British Heart Foundation, Diabetes UK, Cystic Fibrosis Trust, Kidney Research UK, MQ Mental Health, Muscular Dystrophy UK, Stroke Association Blood Cancer UK, McPin Foundations and Versus Arthritis. We thank the NIHR Leicester Biomedical Research Centre patient and public involvement group and Long Covid Support. We also thank G. Khandaker and D. C. Newcomb who provided valuable feedback on this work. Extended Data Fig. 10 was created using Biorender.
Author information
Authors and Affiliations
Consortia
Contributions
F.L. recruited participants, acquired clinical samples, analyzed and interpreted data and cowrote the manuscript, including all drafting and revisions. C.E. analyzed and interpreted data and cowrote this manuscript, including all drafting and revisions. S.F. and M.R. supported the analysis and interpretation of data as well as drafting and revisions. D.S., J.K.S., S.C.M., S.A., N.M., J.N., C.K., O.C.L., O.E., H.J.C.M., A. Shikotra, A. Singapuri, M.S., V.C.H., M.T., N.J.G., N.I.L. and C.C. contributed to acquisition of data underlying this study. L.H.-W., A.A.R.T., S.L.R.-J., L.S.H., O.M.K., D.G.W., T.I.d.S. and A. Ho made substantial contributions to conception/design and implementation of this work and/or acquisition of clinical samples for this work. They have supported drafting and revisions of the manuscript. E.M.H., J.K.Q. and A.B.D. made substantial contributions to the study design as well as data access, linkage and analysis. They have supported drafting and revisions of this work. J.D.C., L.-P.H., A. Horsley, B.R., K.P., M.M. and W.G. made substantial contributions to the conception and design of this work and have supported drafting and revisions of this work. J.K.B. obtained funding for ISARIC4C, is ISARIC4C consortium co-lead, has made substantial contributions to conception and design of this work and has supported drafting and revisions of this work. M.G.S. obtained funding for ISARIC4C, is ISARIC4C consortium co-lead, sponsor/protocol chief investigator, has made substantial contributions to conception and design of this work and has supported drafting and revisions of this work. R.A.E. and L.V.W. are co-leads of PHOSP-COVID, made substantial contributions to conception and design of this work, the acquisition and analysis of data, and have supported drafting and revisions of this work. C.B. is the chief investigator of PHOSP-COVID and has made substantial contributions to conception and design of this work. R.S.T. and L.T. made substantial contributions to the acquisition, analysis and interpretation of the data underlying this study and have contributed to drafting and revisions of this work. P.J.M.O. obtained funding for ISARIC4C, is ISARIC4C consortium co-lead, sponsor/protocol chief investigator and has made substantial contributions to conception and design of this work. R.S.T. and P.J.M.O. have also made key contributions to interpretation of data and have co-written this manuscript. All authors have read and approve the final version to be published. All authors agree to accountability for all aspects of this work. All investigators within ISARIC4C and the PHOSP-COVID consortia have made substantial contributions to the conception or design of this study and/or acquisition of data for this study. The full list of authors within these groups is available in Supplementary Information.
Corresponding authors
Ethics declarations
Competing interests
F.L., C.E., D.S., J.K.S., S.C.M., C.D., C.K., N.M., L.N., E.M.H., A.B.D., J.K.Q., L.-P.H., K.P., L.S.H., O.M.K., S.F., T.I.d.S., D.G.W., R.S.T. and J.K.B. have no conflicts of interest. A.A.R.T. receives speaker fees and support to attend meetings from Janssen Pharmaceuticals. S.L.R.-J. is on the data safety monitoring board for Bexero trial in HIV+ adults in Kenya. J.D.C. is the deputy chief editor of the European Respiratory Journal and receives consulting fees from AstraZeneca, Boehringer Ingelheim, Chiesi, GSK, Insmed, Janssen, Novartis, Pfizer and Zambon. A. Horsley is deputy chair of NIHR Translational Research Collaboration (unpaid role). B.R. receives honoraria from Axcella therapeutics. R.A.E. is co-lead of PHOSP-COVID and receives fees from AstraZenaca/Evidera for consultancy on LC and from AstraZenaca for consultancy on digital health. R.A.E. has received speaker fees from Boehringer in June 2021 and has held a role as European Respiratory Society Assembly 01.02 Pulmonary Rehabilitation secretary. R.A.E. is on the American Thoracic Society Pulmonary Rehabilitation Assembly program committee. L.V.W. also receives funding from Orion pharma and GSK and holds contracts with Genentech and AstraZenaca. L.V.W. has received consulting fees from Galapagos and Boehringer, is on the data advisory board for Galapagos and is Associate Editor for the European Respiratory Journal. A. Ho is a member of NIHR Urgent Public Health Group (June 2020–March 2021). M.M. is an applicant on the PHOSP study funded by NIHR/DHSC. M.G.S. acts as an independent external and nonremunerated member of Pfizer’s External Data Monitoring Committee for their mRNA vaccine program(s), is Chair of Infectious Disease Scientific Advisory Board of Integrum Scientific LLC, and is director of MedEx Solutions Ltd. and majority owner of MedEx Solutions Ltd. and minority owner of Integrum Scientific LLC. M.G.S.’s institution has been in receipt of gifts from Chiesi Farmaceutici S.p.A. of Clinical Trial Investigational Medicinal Product without encumbrance and distribution of same to trial sites. M.G.S. is a nonrenumerated member of HMG UK New Emerging Respiratory Virus Threats Advisory Group and has previously been a nonrenumerated member of the Scientific Advisory Group for Emergencies (SAGE). C.B. has received consulting fees and/or grants from GSK, AstraZeneca, Genentech, Roche, Novartis, Sanofi, Regeneron, Chiesi, Mologic and 4DPharma. L.T. has received consulting fees from MHRA, AstraZeneca and Synairgen and speakers’ fees from Eisai Ltd., and support for conference attendance from AstraZeneca. L.T. has a patent pending with ZikaVac. P.J.M.O. reports grants from the EU Innovative Medicines Initiative 2 Joint Undertaking during the submitted work; grants from UK Medical Research Council, GSK, Wellcome Trust, EU Innovative Medicines Initiative, UK National Institute for Health Research and UK Research and Innovation–Department for Business, Energy and Industrial Strategy; and personal fees from Pfizer, Janssen and Seqirus, outside the submitted work.
Peer review
Peer review information
Nature Immunology thanks Ziyad Al-Aly and the other, anonymous, reviewer(s) for their contribution to the peer review of this work. Ioana Staicu was the primary editor on this article and managed its editorial process and peer review in collaboration with the rest of the editorial team.
Additional information
Publisher’s note Springer Nature remains neutral with regard to jurisdictional claims in published maps and institutional affiliations.
Extended data
Extended Data Fig. 1 Penalized logistic regression performance.
Graphs show classification error and Area under curve (AUC) from the 50 repeats tenfold nested cross-validation used to optimise and assess the performance of PLR testing associations with each LC outcome relative to Recovered (n = 233): Cardio_Resp (n = 398), Fatigue (n = 384), Anxiety/Depression (n = 202), GI (n = 132), (e) Cognitive (n = 6). The distributions of classification error and area under curve (AUC) from the nested cross-validation are shown. Box plot centre line represents the Median and boundaries of the box represent interquartile range (IQR), the whisker length represent 1.5xIQR.
Extended Data Fig. 2 Associations with long COVID symptoms in full study cohort.
(a) Fibrinogen levels at 6 months were compared between pooled LC cases (n = 295) and Recovered (n = 233) and between the Cognitive group (n = 41) and Recovered (n = 233). Box plot centre line represent the Median and boundaries of the box represent interquartile range (IQR), the whisker length represents 1.5xIQR, any outliers beyond the whisker range are shown as individual dots. Median differences were compared using two-sided Wilcoxon signed-rank test *=p < 0·05, **=p < 0·01, ***=p < 0·001, ****=p < 0·0001. Unadjusted p-values are reported. b) Distribution of time from COVID-19 hospitalisation at sample collection applying CDC and NICE definitions of LC (n = 719) (c) Upset plot of symptom groups. Horizontal coloured bars represent the number of patients in each symptom group: Cardiorespiratory (Cardio_Resp), Fatigue, Cognitive, Gastrointestinal (GI) and Anxiety/Depression (Anx_Dep). Vertical black bars represent the number of patients in each symptom combination group. To prevent patient identification, where less than 5 patients belong to a combination group, this has been represented as ‘<5’. The Recovered group (n = 250) were used as controls. Forest plots show Olink protein concentrations (NPX) associated with (d) Cardio_Resp (n = 398), (e) Fatigue (n = 342), (f) Anx_Dep (n = 219), (g) GI (n = 134), and (h) Cognitive (n = 65). Error bars represent the median accuracy of the model.
Extended Data Fig. 3 Validation of olink measurements using conventional assays in plasma.
Olink measured protein (NPX) were compared to chemiluminescence assays (ECL or ELISA, log2[pg/mL]) to validate our findings, where contemporaneously collected plasma samples were available (n = 58). Results from key mediators associated with LC groups were validated: CSF3, IL1R2, IL2, IL3RA, TNFa, TFF2. R= spearman rank correlation coefficient and shaded areas indicated the 95% confidence interval. Samples that fell below the lower limit of detection for a given assay were excluded and the ‘n’ value on each panel indicates the number of samples above this limit.
Extended Data Fig. 4 Univariate analysis of proteins associated with each symptom.
Olink measured plasma protein levels (NPX) compared between LC groups (Cardio_Resp, n = 398, Fatigue n = 384, Anxiety/Depression, n = 202, GI, n = 132 and Cognitive, n = 60) and Recovered (n = 233). Proteins identified by PLR were compared between groups. Median differences were compared using two-sided Wilcoxon signed-rank test. * = p < 0·05, ** = p < 0·01, *** = p < 0·001, ****= p < 0·0001 after FDR adjustment. Box plot centre line represent the Median and boundaries of the box represent interquartile range (IQR), the whisker length represents 1.5xIQR, any outliers beyond the whisker range are shown as individual dots.
Extended Data Fig. 5 Unadjusted Penalised Logistic Regression.
Olink measured proteins (NPX) and their association with Cardio_Resp (n = 398), Fatigue (n = 342), Anx_Dep (n = 219), GI (n = 134), and Cognitive (n = 65). Forest plots show odds of each LC outcome vs Recovered (n = 233), using PLR without adjusting for clinical co-variates. Error bars represent the median accuracy of the model.
Extended Data Fig. 6 Partial Least Squares analysis.
Olink measured proteins (NPX) and their association with Cardio_Resp (n = 398), Fatigue (n = 342), Anx_Dep (n = 219), GI (n = 134), and Cognitive (n = 65) groups. Forest plots show odds of LC outcome vs Recovered (n = 233), using PLS analysis. Error bars represent the standard error of the coefficient estimate.
Extended Data Fig. 7 Network analysis centrality.
Each graph shows the centrality score for each Olink measured protein (NPX) found to have significant associations with other proteins that were elevated in the Cardio_Resp (n = 398), Fatigue (n = 342), Anx_Dep (n = 219), GI (n = 134), and Cognitive (n = 65) groups relative to Recovered (n = 233).
Extended Data Fig. 8 Inflammation in men and women with long COVID.
Olink measured plasma protein levels (NPX) between men and women with symptoms, divided by age (<50 or >=50years): (a) shows IL1R2 and MATN2 in the Anxiety/Depression group (<50 n = 55, >=50 n = 133), (b) shows CTSO and NFASC in the Cognitive group (<50 n = 11, >=50 n = 50). Median values were compared between men and women using two-sided Wilcoxon signed-rank test. Box plot centre line represent the Median and boundaries represent interquartile range (IQR), the whisker length represents 1.5xIQR.
Extended Data Fig. 9 Inflammation in the upper respiratory tract.
Nasal cytokines measured by immunoassay in the CardioResp Group (n = 29) and Recovered (n = 31): (a) shows IL1a, IL1b, IL-6, APO-2, TGFa, TFF2. Median differences were compared using two-sided Wilcoxon signed-rank test. Box plot centre line represents the Median and boundaries of the box represent interquartile range (IQR), the whisker length represent 1.5xIQR. (b) Shows cytokines measured by immunoassay in paired plasma and nasal (n = 70). Correlations between IL1a, IL1b, IL-6, APO-2, TGFa and TFF2 in nasal and plasma samples were compared using Spearman’s rank correlation coefficient (R). Shaded areas indicated the 95% confidence interval of R.
Extended Data Fig. 10 Graphical abstract.
Summary of interpretation of key findings from Olink measured proteins and their association with CardioResp (n = 398), Fatigue (n = 342), Anx/Dep (n = 219), GI (n = 134), and Cognitive (n = 65) groups relative to Recovered (n = 233).
Supplementary information
Supplementary Information
Supplementary Methods, Statistics and reproducibility statement, Supplementary Results, Supplementary Tables 1–7, Extended data figure legends, Appendix 1 (Supplementary Table 8), Appendix 2 (PHOSP-COVID author list) and Appendix 3 (ISARIC4C author list).
Rights and permissions
Open Access This article is licensed under a Creative Commons Attribution 4.0 International License, which permits use, sharing, adaptation, distribution and reproduction in any medium or format, as long as you give appropriate credit to the original author(s) and the source, provide a link to the Creative Commons licence, and indicate if changes were made. The images or other third party material in this article are included in the article’s Creative Commons licence, unless indicated otherwise in a credit line to the material. If material is not included in the article’s Creative Commons licence and your intended use is not permitted by statutory regulation or exceeds the permitted use, you will need to obtain permission directly from the copyright holder. To view a copy of this licence, visit http://creativecommons.org/licenses/by/4.0/.
About this article

Cite this article
Liew, F., Efstathiou, C., Fontanella, S. et al. Large-scale phenotyping of patients with long COVID post-hospitalization reveals mechanistic subtypes of disease. Nat Immunol 25, 607–621 (2024). https://doi.org/10.1038/s41590-024-01778-0
Received:
Accepted:
Published:
Issue Date:
DOI: https://doi.org/10.1038/s41590-024-01778-0
This article is cited by
-
Immune dysregulation in long COVID
Nature Immunology (2024)
-
Long COVID science, research and policy
Nature Medicine (2024)
