
Abstract
An effective rollout of vaccinations against COVID-19 offers the most promising prospect of bringing the pandemic to an end. We present the Our World in Data COVID-19 vaccination dataset, a global public dataset that tracks the scale and rate of the vaccine rollout across the world. This dataset is updated regularly and includes data on the total number of vaccinations administered, first and second doses administered, daily vaccination rates and population-adjusted coverage for all countries for which data are available (169 countries as of 7 April 2021). It will be maintained as the global vaccination campaign continues to progress. This resource aids policymakers and researchers in understanding the rate of current and potential vaccine rollout; the interactions with non-vaccination policy responses; the potential impact of vaccinations on pandemic outcomes such as transmission, morbidity and mortality; and global inequalities in vaccine access.
Main
As of 7 April 2021 there have been 2.89 million confirmed deaths and 133 million confirmed cases of infection with SARS-CoV-2, the virus that causes COVID-191. Since the beginning of the pandemic, virus transmission and mortality have been reduced through a range of measures: precautionary actions from individuals including social distancing, wearing facemasks, hand hygiene and restricting interpersonal contact to outdoor settings; widespread testing to identify individuals infected with the virus; and non-pharmaceutical policy responses from governments, including school and workplace closures, bans on public gatherings, travel restrictions and stay-at-home orders2,3. Now, with the successful development, evaluation and production of multiple vaccines, governments are turning towards vaccination as an essential solution to the pandemic.
To understand the scale and rate of the vaccine rollout, we need timely, comparable data across countries. The Our World in Data COVID-19 vaccination dataset provides a public aggregated global dataset on administered vaccinations. It covers the full period from 13 December 2020—the date the first vaccination data were published—and has been updated regularly ever since. The COVID-19 vaccination dataset is expanding as more countries begin releasing official data on their national vaccination campaigns. As of 7 April 2021, the dataset covers 169 countries. Our intention is to maintain the database for the foreseeable future and include additional countries as they implement their vaccination campaigns.
This dataset tracks the total number of COVID-19 vaccinations administered in each country, broken down by first and second doses (where national data is available), and derived daily vaccination rates and population-adjusted figures. The combination of these metrics enables users to understand the scale and rate of vaccine rollouts relative to population, compare rollout rates between countries and assess differences in priorities for countries with one-dose and two-dose schedules. These data are compiled from official sources, including health ministries, government reports and official social media accounts.
Our COVID-19 vaccination dataset is widely used by journalists, policymakers, researchers and the public. The World Health Organization (WHO) relies on this dataset for its official COVID-19 dashboard (https://covid19.who.int/info). Our dataset is also used by policymakers to benchmark the performance of national vaccination programmes across countries. The WHO has also relied on this dataset to understand the inequities in global vaccine access, using this evidence to support calls for greater financial support for COVAX, a global initiative supported by the WHO that is aimed at equitable access to COVID-19 vaccines.
Our dataset has been used by leading media outlets, including the New York Times (https://www.nytimes.com/interactive/2021/world/covid-vaccinations-tracker.html), the BBC (https://www.bbc.co.uk/news/world-56237778), the Financial Times (https://ig.ft.com/coronavirus-vaccine-tracker/) and The Economist (https://www.economist.com/graphic-detail/tracking-coronavirus-across-the-world). Global media has an important role in informing the public during this global pandemic, and it is essential that leading media outlets have timely, transparent and reliable data to present to their audiences. The demonstration of rapid vaccine rollouts across the world and their potential impacts on transmission and mortality has the potential to shape public attitudes towards vaccinations, reduce vaccine hesitancy and, ultimately, lead to an improved response to the pandemic. An effective vaccination response relies on high uptake rates4. Our dataset has a potential role in the building of public trust that is essential to an effective global response to the COVID-19 pandemic.
Our dataset has been widely used by the scientific community across multiple disciplines. It has been used to highlight global inequalities in vaccine access, leading to strong calls to action to accelerate financial and policy response efforts to close the existing gaps5. It has been used by researchers to identify countries with particularly effective vaccine rollouts, thereby enabling analyses of how this was achieved6. These analyses emphasize a range of drivers that explain the large differences across countries that we document: differences in the funding of the development and production of the vaccines; differences in the scheduling and management of vaccinations; differences in public trust and uptake rates; and differentiated responsibilities between national, regional and local level actors7. Health policy researchers have used this dataset to assess differences in vaccine prioritization strategies—for example, to decide which groups should be offered the vaccine first8. Other research groups have combined the dataset with vaccine development data to provide a complete overview of the global vaccine landscape9. It has been used by researchers examining the role of vaccine hesitancy and how to design public messaging on the basis of these concerns10.
As vaccination campaigns continue to scale, evidence for their effectiveness in reducing transmission, severe disease and death will become increasingly important. Our dataset serves as input for epidemiologists who study these questions. Integrating it with other epidemiological data can help researchers evaluate these outcomes11,12. Evidence of positive impacts of vaccination on transmission and mortality can also help to strengthen public trust.
The rest of this article is organized as follows: Results presents the key metrics used to track vaccine rollout in this dataset and the headline results so far; the Discussion outlines the significance and limitations of this work; and the Methods provides detailed descriptions of the underlying methods and sources used to build this global dataset.
Results
Global coverage of COVID-19 vaccination campaigns
The first published reports of COVID-19 vaccinations outside clinical trials occurred on 13 December 2020 in the United Kingdom. Our live dataset presents the time series of vaccinations across the world since then.
To date, 169 countries have reported vaccinations and are included in this dataset. As of 7 April 2021, there have been 710 million doses administered globally. Five per cent of the world population have received at least one dose of an approved vaccine. This highlights important inequalities in global vaccine access. Figure 1 shows the number of COVID-19 vaccine doses administered by country; these figures are not adjusted for population and should not be used for cross-country comparisons of the scale of the vaccine rollout. It does, however, highlight the countries that have yet to begin vaccinations. At the time of writing most high- and middle-income countries have begun vaccination rollouts, but many low-income countries have not (Fig. 2).
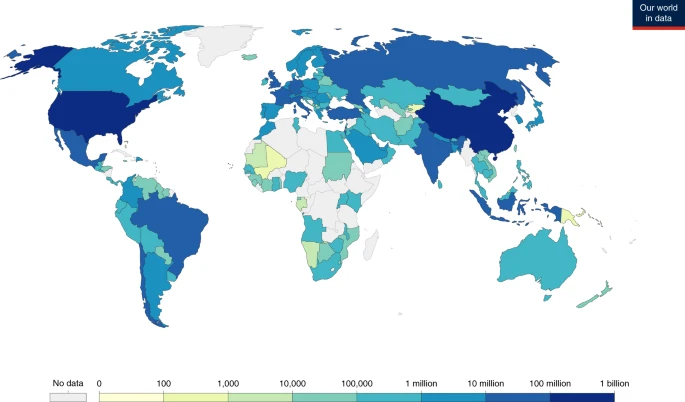
Total number of COVID-19 vaccine doses administered as of 7 Apr 2021. Single doses are counted, and may not equal the total number of people vaccinated, depending on the specific dose regime (some people may have received multiple doses). This represents the current coverage of the global vaccination rollout. Note that these figures are not population-adjusted (see Fig. 3) and should not be used for cross-cross comparison of the scale of the vaccine rollout.

Cumulative number of COVID-19 doses administered per 100 people, measured against gross domestic product (GDP) per capita. GDP per capita is adjusted for purchasing power parity and is measured in international dollars (Int$). Single doses are counted, and may not equal the total number of people vaccinated, depending on the specific dose regime (some people may have received multiple doses).
Large differences in vaccination rates between countries
The data reveal large differences in the scale of the vaccine rollout across countries. As of 7 April 2021, the cumulative number of doses administered per 100 people ranges from 118 per 100 in the case of Israel, to less than 0.1 doses per 100 in countries that have just begun their vaccination campaigns, such as Mali, Namibia and Brunei (Fig. 3). As discussed below, the number of doses can exceed the number of people due to multiple-dose vaccination programmes.

Shown are the global data as of 7 April 2021. Single doses are counted, and may not equal the total number of people vaccinated, depending on the specific dose regime (some people may have received multiple doses).
These differences in vaccination coverage are dependent on several factors. First, the date when countries started national vaccination campaigns: the United Kingdom, for example, began community vaccination on 8 December 2020, while some countries had not begun vaccine rollouts as of 7 April 2020 (Figs. 1 and 3).
Second, the rate of vaccinations over time: there are large differences in these rates between countries (Fig. 4a,b). Israel has received significant attention for the rate of its campaign6. As well as being one of the first countries to begin vaccinations, it has also maintained a consistently high rate of vaccinations over time. This is reflected in its steep linear trend of cumulative doses over time (Fig. 4a) and consistently high rate of daily doses (Fig. 4b). Between the end of December 2020 and mid-March 2021 Israel averaged a rate of approximately one dose per 100 people per day—more than twice the rate of most countries. Rosen et al. looked at the contributors to Israel’s success and identified factors such as the organizational and logistical capacity of its community-based healthcare providers, a clear prioritization framework and effective outreach efforts to the public as being important6. Lee et al. also examined the factors in Israel’s success, and emphasized the high level of public trust7.

a, The cumulative total vaccine doses administered per 100 people over time. b, Daily doses administered per 100 people (7-day smoothed) for selected countries.
Most countries that have achieved the fastest vaccine rollouts to date—Israel, United Arab Emirates, United Kingdom, United States, Bahrain and Chile—are high-income countries. Figure 2 shows that income is an important factor, but the significant variations at different income levels shows that it is not the only factor. This can be the basis for research into effective strategies at different income levels.
Different prioritization strategies between countries
The Our World in Data COVID-19 vaccination dataset allows for comparison of cumulative doses administered, and for a subset of countries, disaggregated data on the number of first and second doses is available. This enables comparison of prioritization strategies—a central policy and research question.
Our data highlight large differences in the approaches taken by different countries. Some countries—the United Kingdom being the most prominent example—have taken a ‘first dose first’ approach, delaying the delivery of a second vaccine dose to achieve wider single-dose coverage within the total population. This is reflected in the data, which show the share of the total people that have received at least one dose of a COVID-19 vaccine (Fig. 5a) and the share that have been fully vaccinated (Fig. 5b). As of 7 April 2021, 46.7% of the total population of the United Kingdom had received at least one dose, but only 8.4% had received both doses. Other countries have placed greater emphasis on giving two doses to a smaller share of the population. In these countries, a large share of those who received the first dose had already received a second dose: in Israel, 61.2% had received at least one dose, and 56.5% had been fully vaccinated. In the United States, 32.9% had received one dose and 19% had been fully vaccinated.

a,b, Shares of the populations of selected countries that have received at least one dose of the COVID-19 vaccine (a) or have been fully vaccinated against COVID-19 (b). Data in b are the share that have received all doses prescribed by the vaccination protocol. These data are only available for countries that report the breakdown of first and second doses administered.
Differences in prioritization have received particular attention in Europe. The ‘first dose first’ approach favoured by the United Kingdom has been frequently contrasted with the approach of many countries in the European Union13,14,15. Germany, for example, has a much smaller gap between the share that have received a first dose (12.9% of the total population) and those that have been fully vaccinated (5.5%).
Discussion
The rapid development, testing and manufacturing of multiple effective vaccines against SARS-CoV-2 was a ground-breaking achievement in 2020. Never before has a vaccination campaign started so very soon after a new pathogen was identified. In many cases, it took many years or decades until a vaccine was developed (Fig. 6). In the case of COVID-19, scientists have developed several highly efficacious vaccines within a year. The question now is whether the global rollout of the vaccines can match the speed with which they were developed: whether they can be administered quickly and equitably across the world.
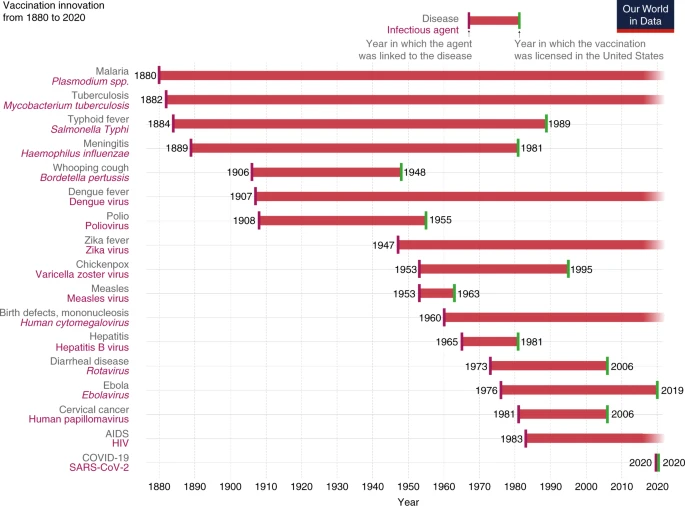
Each bar begins in the year in which the pathogenic agent was first linked to the disease and the bar ends in the year in which a vaccination against that pathogen was licensed in the United States.
To do this, governments and public health officials need to understand the most effective approaches to mass vaccination rollouts and prioritize the administration in a way that minimizes morbidity and mortality from the disease. The dataset that we present here could support this. It allows analysts to track vaccinations over time in a specific country, and to compare vaccination rates and prioritization strategies across countries. Combined with epidemiological data, it serves as input for researchers to understand how vaccination affects the transmission and health outcomes of COVID-19.
Communicating such research on the efficacy of vaccines is in turn essential for building public trust and reducing vaccine hesitancy16,17. Kreps et al. found that perceived vaccine efficacy was the strongest predictor of COVID-19 vaccine uptake in the United States18. Sherman et al. studied people’s willingness to be vaccinated against COVID-19 and their attitude towards vaccines19, finding that the effectiveness of vaccines in reducing disease is a particularly important argument.
It is important to highlight what we are not trying to achieve with this dataset. We are collecting data only on doses administered—we do not include data on the number of doses manufactured, ordered or delivered. In the collection of data on administered doses we do not audit official reports beyond technical validation (Methods), and we do not attempt to assess vaccine effectiveness or the impacts of vaccinations on pandemic outcomes. This is beyond the scope of this resource.
If we want to understand anything about vaccines—such as effectiveness, policy responses or perceptions—then we need to know how many vaccines have been administered. Our dataset fills this gap.
Limitations
The dataset relies on the publication of vaccination data by national governments and other official sources. This raises several limitations to the completeness of the global vaccination dataset. First, it relies on countries making the latest figures on administered doses available in a timely manner. Being able to understand the rate of national rollouts depends on these data being made available frequently, with minimal delay between doses being administered and these being reported. Although most countries provide daily or weekly updates, some publish the latest figures with lower frequency. This makes it difficult to get an accurate understanding of the speed of the rollout for these countries.
Another limitation is the variable completeness of the data provided by official sources. Ideally, all countries would publish multiple metrics that are needed to understand the vaccine rollout: cumulative doses administered, daily doses administered, the breakdown of first versus second doses, and the breakdown of vaccinations by type or manufacturer. Some countries do provide this level of disaggregation, and in these cases we make these metrics available in our global dataset, however this completeness varies by country. Some countries provide data only on cumulative doses administered to date. This limits the cross-country comparability of the dataset. As national vaccination rollouts continue, we hope that this reporting by countries becomes increasingly standardized.
Finally, we included vaccination figures as they are reported publicly by national governments and official sources. This is sometimes published in different languages, which we overcome by using digital translations, and in some cases, input from our global audience. We have yet to encounter a misreporting of the data due to translation issues. The main quality concern for the database itself is whether public announcements represent an accurate record of the official data. We use several strategies to ensure that this is the case (see Methods, ‘Technical validation’), however this contingency remains the largest limitation of the dataset.
Methods
This section provides a description of the metrics made available in this dataset, followed by information on how these data were collected. Finally, we describe how it is published as a complete, open-access dataset and how it can be explored through our online web application.
Metrics included in this dataset
The metrics included in this dataset are a combination of original metrics reported by official sources, and derived metrics calculated by Our World in Data.
The nine metrics included in this dataset are the following:
-
1.
Total doses administered. This is a count of all doses given. Since several vaccines require multiple doses this count may be higher than the total number of people vaccinated.
-
2.
Total doses administered per 100 people. This is ‘Total doses administered’ per 100 people of the total population.
-
3.
Daily vaccinations. If official sources provide daily updates of vaccinations administered, this is included.
-
4.
Rolling average of daily vaccinations over seven days. For countries that do not report data on a daily basis, we assume that the number of administered doses was the same on all days over any period for which no daily data were reported. This produces a complete series of daily figures, which is then averaged over a rolling seven-day window.
-
5.
Daily doses administered per million people. This is the rolling average of daily vaccinations over seven days, per million people within the total population.
-
6.
Number of people that have received at least one vaccine dose. Depending on the vaccine schedule (a one- or two-dose vaccine), this may or may not match the number of people fully vaccinated. If a person receives the first dose of a two-dose vaccine, this metric goes up by one. If they receive the second dose, the metric stays the same.
-
7.
Share of the total population that have received at least one vaccine dose. This is the number of people that have received at least one vaccine dose per 100 people in the total population.
-
8.
Number of people that are fully vaccinated. This is the total number of people who received all doses prescribed by the vaccination protocol. If a person receives the first dose of a two-dose vaccine, this metric stays the same. If they receive the second dose, the metric goes up by one.
-
9.
Share of the total population that are fully vaccinated. This is the number of people that have received all doses prescribed by the vaccination protocol per 100 people in the total population.
Not all metrics are available for all countries. The availability is dependent on the granularity of reporting provided by the official sources. For example, not all countries provide a breakdown of doses administered by first or second doses. In such cases, only the total number of administered doses can be provided for these countries.
One important point to note is how the possibility of ‘booster vaccinations’—additional doses administered at a later date among individuals who have already been fully vaccinated—may be recorded in our dataset. This has not yet been a concern, but could arise as the dataset evolves and countries begin administering booster vaccinations. To ensure that the comparability of the original metrics between countries is not compromised, additional doses would not be included in the existing metrics listed above. For inclusion in our dataset, we would create an additional metric that tracks booster vaccinations separately from the initial vaccine rollout.
Data collection methods
Raw data on vaccination doses administered is collected through a combination of manual and automated means. This collection process differs by country, but can be broadly defined by three methods.
First, for a number of countries, figures reported in official sources—including government websites, health ministries, dedicated dashboards and social media accounts of national authorities—are recorded manually as they are released.
Second, where official sources release vaccination figures in a consistent, machine-readable format, or where structured data are published at a stable location, we have automated the data collection using Python scripts that we execute every day. These automated scripts are made available in our GitHub repository (https://github.com/owid/covid-19-data/blob/master/scripts/scripts/vaccinations/automations/). These are regularly audited for technical bugs to ensure data validity (see ‘Technical validation’). Third, in some instances—where national data are not made available in machine-readable format by official sources, but is aggregated by third-party sources—we source data from non-official publishers (for example, https://covid19tracker.ca/vaccinationtracker.html for Canada). These are also regularly audited for accuracy against the original official sources.
Calculating derived metrics
Derived metrics are calculated from the raw official counts in two ways. (1) Population-adjusted metrics. This normalizes total doses, first doses and second doses to their counts per 100 people in the total population. This enables users to compare the pace and scope of the vaccination rollout across countries. Vaccinations administered per 100 people are calculated by dividing administered doses by total population figures, sourced from the latest revision of the United Nations World Population Prospects20. The exact population values used in these calculations are also provided in our GitHub repository (https://github.com/owid/covid-19-data/blob/master/scripts/input/un/population_2020.csv).
(2) Daily rolling averages. Not all countries report figures at a daily frequency. To facilitate cross-country comparisons over time, we therefore derive a ‘smoothed’ daily vaccination series calculated as the seven-day moving average. It is calculated as the right-aligned rolling seven-day average of a complete series of daily changes. For countries for which no complete series of daily changes is available from our source, we derive it by linearly interpolating the cumulative totals. The exact code used to derive the seven-day moving average is available online (see ‘Code availability’).
Criteria for inclusion and coverage
To be included in this dataset, countries must provide at least one data point on the number of vaccine doses administered through a trusted country-specific source such as a health ministry, government report or official national account. Reports on the number of vaccine doses ordered or distributed are not included; this dataset only includes doses administered. Vaccinations administered in clinical trials are also not included.
As of 7 April 2021, the vaccination dataset covers 169 countries. This coverage will continue to expand as more countries begin vaccination campaigns.
Technical validation
The Our World in Data COVID-19 vaccination database represents a collation of publicly available data published by official sources. The main quality concern for the database itself is whether it represents an accurate record of the official data. We use several strategies to ensure that this is the case.
First, all automated collection of data, whether obtained from official channels or non-official publishers, is subject to initial manual verification when it is added to our database for the first time.
Second, we employ a range of data validation processes, both for our manual and for automated time series. We continually check for invalid figures, such as negative or illogical values, out-of-sequence dates, implausible changes in time-series data, invalid population-adjusted values and we test for abrupt changes in vaccination rates for each country.
Third, our vaccination data is viewed and used by millions of people every day—either through direct usage or third-party usage (such as news reports, social media and other sharing channels). This includes employees of health ministries, researchers, journalists and policymakers from across the world. We receive large amounts of feedback from this user base. This provides a final crowd-sourced verification method that has been shown to be effective in highlighting any discrepancies in official data sources.
Data access and publication
Vaccination data are updated daily and are made available via two channels. First, all data and scripts used for data collection are published and updated in our public GitHub repository (https://github.com/owid/covid-19-data/tree/master/public/data/vaccinations). This provides a transparent resource for users to download the data in CSV and JSON formats, replicate the data collection and metric derivation process, and monitor any changes or additions to this process.
To allow journalists, researchers, policymakers and the public to understand the evolution of the global COVID-19 vaccination rollout, we make all of this data explorable at our online web publication (https://ourworldindata.org/covid-vaccinations). There, we provide interactive visualizations of all available vaccination metrics to enable users to track and compare the vaccination campaigns around the world. These interactive visualizations are built with our custom visualization tool—the Our World in Data Grapher—and are made available by open access. They are updated daily in sync with updates in our GitHub repository.
Reporting Summary
Further information on research design is available in the Nature Research Reporting Summary linked to this article.
Data availability
A live version of the vaccination dataset and documentation are available in a public GitHub repository at https://github.com/owid/covid-19-data/tree/master/public/data/vaccinations. These data can be downloaded in CSV and JSON formats.
Code availability
Our scripts for data collection, processing and transformation are available for inspection in the public GitHub repository that hosts our data (https://github.com/owid/covid-19-data/tree/master/scripts/scripts/vaccinations). All scripts are also made publicly available on figshare (https://figshare.com/articles/software/A_global_database_of_COVID-19_vaccinations/14387702).
Change history
17 June 2021
A Correction to this paper has been published: https://doi.org/10.1038/s41562-021-01160-2
References
COVID-19 Data Repository by the Center for Systems Science and Engineering (CSSE) at Johns Hopkins University (Johns Hopkins University, accessed 7 April 2021); https://arcg.is/0fHmTX
Hale, T. et al. A global panel database of pandemic policies (Oxford COVID-19 Government Response Tracker). Nat. Hum. Behav. 5, 529–538 (2021).
Hasell, J. et al. A cross-country database of COVID-19 testing. Sci. Data. 7, 345 (2020).
Kim, J. H., Marks, F. & Clemens, J. D. Looking beyond COVID-19 vaccine phase 3 trials. Nat. Med. 27, 205–211 (2021).
Sachs, J. et al. Priorities for the COVID-19 pandemic at the start of 2021: statement of the Lancet COVID-19 Commission. Lancet 397, 947–950 (2021).
Rosen, B., Waitzberg, R. & Israeli, A. Israel’s rapid rollout of vaccinations for COVID-19. Isr. J. Health Policy Res. 10, 6 (2021).
Lee, T. H. & Chen, A. H. Last-mile logistics of Covid vaccination—the role of health care organizations. New Engl. J. Med. 384, 685–687 (2021).
Cylus, J., Panteli, D. & Van Ginneken, E. Who should be vaccinated first? Comparing vaccine prioritization strategies in Israel and European countries using the Covid-19 Health System Response Monitor. Isr. J. Health Policy Res. 10, 16 (2021).
Shrotri, M., Swinnen, T., Kampmann, B. & Parker, E. P. K. An interactive website tracking COVID-19 vaccine development. Lancet Glob. Health 9, 590–592 (2021).
Alkandari, D., Herbert, J. A., Alkhalaf, M. A., Yates, C. & Panagiotou, S. SARS-CoV-2 vaccines: fast track versus efficacy. Lancet Microbe 2, e89–e90 (2021).
Dagan, N. et al. BNT162b2 mRNA Covid-19 vaccine in a nationwide mass vaccination setting. New Engl. J. Med. 384, 1412–1423 (2021).
Ramos, A. M., Vela-Perez, M., Ferrandez, M. R., Kubik, A. B. & Ivorra, B. Modeling the impact of SARS-CoV-2 variants and vaccines on the spread of COVID-19. Preprint at ResearchGate.net https://doi.org/10.13140/RG.2.2.32580.24967/2 (2021).
Iacobucci, G. & Mahase, E. Covid-19 vaccination: what’s the evidence for extending the dosing interval? BMJ 372, 18 (2021).
Mahase, E. Covid-19: medical community split over vaccine interval policy as WHO recommends six weeks. BMJ 372, 226 (2021).
Baraniuk, C. Covid-19: how the UK vaccine rollout delivered success, so far. BMJ 372, 421 (2021).
Vanderslott, S., Dadonaite, B. & Roser, M. Vaccination. OurWorldinData.org https://ourworldindata.org/vaccination (2013).
Verger, P. & Dubé, E. Expert review of vaccines restoring confidence in vaccines in the COVID-19 era. Expert Rev. Vaccines 19, 991–994 (2020).
Kreps, S. et al. Factors associated with US adults’ likelihood of accepting COVID-19 vaccination. JAMA Netw. Open 3, e2025594 (2020).
Sherman, S. M. et al. COVID-19 vaccination intention in the UK: results from the COVID-19 vaccination acceptability study (CoVAccS), a nationally representative cross-sectional survey. Hum. Vaccin. Immunother. https://doi.org/10.1080/21645515.2020.1846397 (2020).
Population Dynamics. World Population Prospects: The 2019 Revision, DVD Edn (United Nations, Department of Economic and Social Affairs, 2019).
Acknowledgements
We thank the many citizens and journalists who have helped improve, maintain, and expand this dataset. They include, among many others, D. Baković, R. Barros, D. Bauer, N. Berrod, Y. Bleijenberg, Daniel B., J.-P. Chognot, B. Dale, R. Freeman, J. Galindo, R. H. Gunaratne, J. Holder, O. Kokes, A. Macali, E. Mäkinen, V. Mouret, M. Pavliscak, Juan P., A. Redfern, L. Rodés-Guirao, V. Thoss, J. Vaesen and M. Zelenskiy. We also acknowledge the funding sources that supported the work. Our World in Data is produced as a collaborative effort between researchers at the University of Oxford, who are the scientific contributors of the website content, and the non-profit organization Global Change Data Lab, which owns, publishes and maintains the website and the data tools. Global Change Data Lab (Registered Charity Number 1186433, Charities Commission for England and Wales) is supported by grants from the Department of Health and Social Care in the United Kingdom and the Bill and Melinda Gates Foundation, as well as donations from thousands of individuals and organizations. The list of all donors is available at https://ourworldindata.org/supporters. This work was supported, in whole or in part, by the Bill & Melinda Gates Foundation [Grant Number: INV-008629]. Under the grant conditions of the Foundation, a Creative Commons Attribution 4.0 Generic License has already been assigned to the Author Accepted Manuscript version that might arise from this submission. The funders had no role in study design, data collection and analysis, decision to publish or preparation of the manuscript.
Author information
Authors and Affiliations
Contributions
E.M. led the study and collected vaccination data with input from C.A., C.G. and L.R.-G. H.R. wrote the manuscript, with input from all authors. E.O.-O. and J.H. provided background research and edited the manuscript. M.R. managed the project.
Corresponding author
Ethics declarations
Competing interests
The authors declare no competing interests.
Additional information
Peer review information Nature Human Behaviour thanks Weihsueh Chiu, Shengjie Lai and Edward Parker for their contribution to the peer review of this work.
Publisher’s note Springer Nature remains neutral with regard to jurisdictional claims in published maps and institutional affiliations.
Supplementary information
Rights and permissions
About this article

Cite this article
Mathieu, E., Ritchie, H., Ortiz-Ospina, E. et al. A global database of COVID-19 vaccinations. Nat Hum Behav 5, 947–953 (2021). https://doi.org/10.1038/s41562-021-01122-8
Received:
Accepted:
Published:
Issue Date:
DOI: https://doi.org/10.1038/s41562-021-01122-8
This article is cited by
-
Predictive models for health outcomes due to SARS-CoV-2, including the effect of vaccination: a systematic review
Systematic Reviews (2024)
-
COVID-19 vaccination hesitancy among Malawians: a scoping review
Systematic Reviews (2024)
-
Medical student´s motivational changes during the COVID-19 university lockdown: a mixed-method study
BMC Medical Education (2024)
-
Timing of preventive behavior in the case of a new and evolving health risk: the case of COVID-19 vaccination
Health Economics Review (2024)
-
The association between interest of nutritional supplements and COVID-19 pandemic - evidence from Google Trends
BMC Public Health (2024)
