Abstract
Earth’s hydrocarbon degassing through gas-oil seeps, mud volcanoes and diffuse microseepage is a major natural source of methane (CH4) to the atmosphere. While carbon dioxide degassing is typically associated with extensional tectonics, volcanoes, and geothermal areas, CH4 seepage mostly occurs in petroleum-bearing sedimentary basins, but the role of tectonics in degassing is known only for some case studies at local scale. Here, we perform a global scale geospatial analysis to assess how the presence of hydrocarbon fields, basin geodynamics and the type of faults control CH4 seepage. Combining georeferenced data of global inventories of onshore seeps, faults, sedimentary basins, petroleum fields and heat flow, we find that hydrocarbon seeps prevail in petroleum fields within convergent basins with heat flow ≤ 98 mW m−2, and along any type of brittle tectonic structure, mostly in reverse fault settings. Areas potentially hosting additional seeps and microseepage are identified through a global seepage favourability model.
Introduction
Among the natural sources of greenhouse gases that may contribute to climate changes, geological emissions of carbon dioxide (CO2) and methane (CH4) from Earth degassing have a specific role, as evidenced by field measurements, inventories, process-based models, bottom-up and top-down estimates1,2,3,4,5,6. CO2 degassing from volcanic and geothermal areas may have played a climatic role over geological-time scales7,8 but it appears to represent a minimal component in the present-day global CO2 atmospheric budget; global geo-CO2 emission (likely < 1000 Mt yr−1)1,4 is three orders of magnitude lower than the total CO2 emissions from natural plus anthropogenic sources9. Quite another matter is the relative importance of geological CH4 (hereafter geo-CH4) emissions: bottom-up and top-down estimates suggest that geo-CH4 emission globally amount to ~45 Mt yr−16,10, about 8% of total (natural plus anthropogenic) CH4 sources (~560 Mt yr−1)11. Lower geo-CH4 emissions derived from preindustrial-era ice core radiocarbon 14CH4 analyses12 opened a debate, suggesting the need of further checks of global geo-CH4 estimates. In this respect, an important step is improving the knowledge of global seepage distribution and extension, and its controlling geological factors. While geo-CO2 degassing is mainly controlled by extensional tectonics, along normal faults and rift systems that mostly drive CO2 release from crustal geothermal reservoirs, magmatic chambers and the mantle5,7,8, geo-CH4 degassing (seepage) takes place primarily in sedimentary, petroleum (oil and gas)-rich basins, where CH4 can have a microbial or thermogenic origin2,6,13,14,15. However, the role of the basin geodynamics (convergent or divergent) and the type of faulting (reverse, normal, strike-slip) on gas seepage was examined only sporadically, without statistical quantification on a global scale14,16. CH4 migration and seepage are primarily driven by advection (Darcy’s flow), controlled by gas pressure and rock permeability related to fracture networks and faults15. Whether a specific type of tectonics and fault (such as extensional tectonics for CO2) is needed for CH4 degassing is unknown. Addressing this issue is critical to assess the pathways of CH4 release and to identify potential, not yet inventoried, geo-CH4 emission regions, including those hosting the invisible, diffuse exhalations (microseepage)6,17,18. Knowing the area and spatial distribution of methane seepage is fundamental for both atmospheric methane budget studies and petroleum exploration. In the first case, it allows to refine global and regional estimates of geo-CH4 emission to the atmosphere: the area where the emission takes place represents in fact the activity to be associated to the average gas flux, over that area (emission factors), in bottom-up gas emission estimates6,10,11. This is particularly critical for microseepage, which represents a major class of geo-CH4 source, estimated in the order of 15–33 Mt yr−1 10. In the second case, maps of spatial distribution of seepage in sedimentary basins may drive the exploration for the identification of subsurface petroleum reservoirs14. Knowing the type of tectonics favouring hydrocarbon seepage is also important in the study of potential methane source regions on other planets as Mars, where recent atmospheric CH4 detections have raised the question on what are the tectonic features that may have released the gas19.
Here, we address the above issues using geospatial analysis of global datasets of onshore hydrocarbon seeps (Supplementary Notes 1 and 2 and Supplementary Fig. 1). We analyse the different geological factors that could control the CH4 seepage on continents, e.g., the existence of petroleum fields, type of sedimentary basins (convergent and divergent), heat flow and fault type. The work does not include offshore seeps because available inventories, referring to relatively wide areas, do not report geographic coordinates of individual seeps6. The role of tectonics is investigated by fault density maps and by examining the spatial association between seeps and type of faulting (a logical flow scheme is shown in Supplementary Fig. 2). We show that geo-CH4 seepage preferably develops in convergent basins, secondarily in divergent settings, and is mainly associated with reverse faults. Gas seepage however occurs along any type of brittle tectonic structure. We develop a model of seepage favourability with the aim to identify potential seepage areas not documented so far.
Results
Influence of basin geodynamics and petroleum fields
We applied GIS-based geospatial and geostatistical analyses to evaluate the relationship between hydrocarbon seep distribution, basin geodynamics and petroleum fields (see Methods).
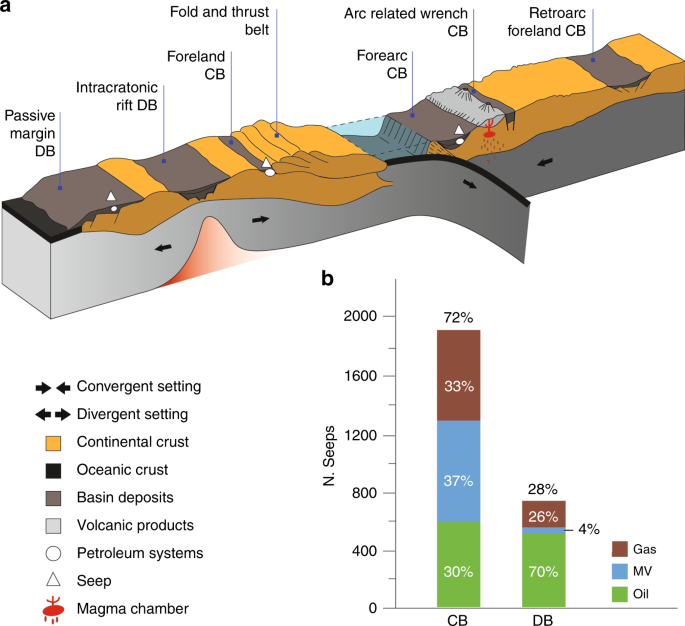
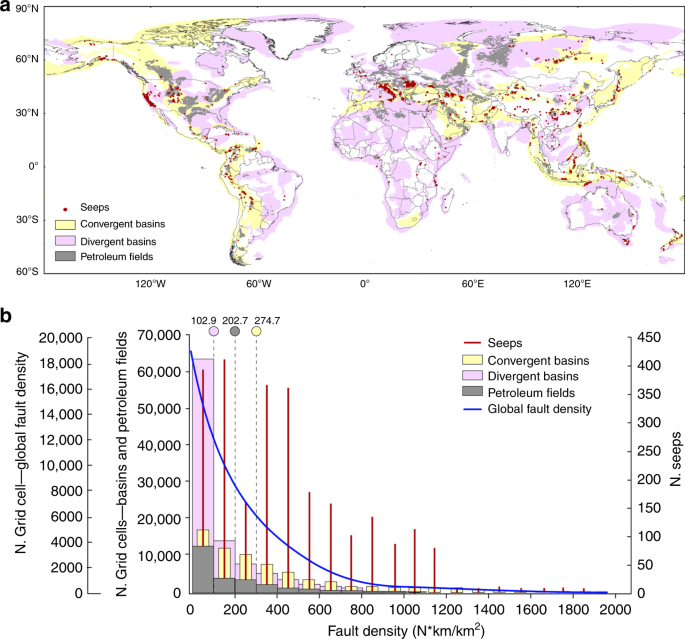
Convergent basins include retroarc, forearc, arc-related wrench and foreland basins associated with fold-and-thrust belts and form in geodynamic settings characterised by continental shortening and tectonic loading20 (Fig.1a). Divergent basins include intra-cratonic, rift and post-rift sags, passive margins and wrenches (see details in Supplementary Note 3).
Geospatial analysis shows that out of 2699 seeps, 1941 seeps (72%) occur in convergent basins (Table 1 and Supplementary Fig. 3), although these basins cover an area smaller than that of divergent basins (Fig. 1b and Table 1).
There is not a well defined prevailing type of seep in convergent basins: 33% are gas seeps, 30% oil seeps and 37% mud volcanoes. About 95% of the worldwide mud volcanoes occur in these basins (Fig. 1b), which are closely related to thrust systems and sedimentary diapirism21. Divergent basins host 758 seeps (28% of the total), of which 70% is oil, 26% gas and 4% mud volcanoes (Fig. 1b).
Convergent and divergent basins host 58% and 42% of petroleum fields, respectively. As expected, most seeps (81%) occur within the area covered by petroleum fields (Fig. 2a; Table 1). The remaining 19% of seeps can be related to minor fields not included in the petroleum field inventory, direct fluid migration from source rocks, also not included in the inventory, and long-distance lateral migration of gas and oil14. Seeps prevail at the margins of petroleum fields, which are typically more faulted and fractured (examples in Supplementary Note 3 and Supplementary Fig. 4). The result of our analysis demonstrates that seeps are a fundamental component of petroleum systems according to the definition of Petroleum Seepage System22, and gas-oil reservoirs are the source of most seeps15. In addition, seepage mostly (95%) occurs in areas with heat flow ≤98 mWm−2 (Supplementary Table 1), which are values typical of the thermal status of petroleum systems23 (Supplementary Note 3 and Supplementary Fig. 5).
a Map of sedimentary basins (convergent, light yellow; divergent, light violet), petroleum field areas (grey) and geo-CH4 seeps (red dots). b Multiple histograms of fault density values at global scale (blue line), in convergent (light yellow) and divergent (light violet) basins, in petroleum fields (grey), and at seep location (red). Grid cell is 0.2° × 0.2°. The fault density mean value for divergent basins, petroleum fields and convergent basins is indicated above the light violet, grey and yellow circles, respectively.
Seeps and faults
It is known that hydrocarbon seeps, especially gas seeps and mud volcanoes, develop along fracture and/or fault networks14,24. Therefore, we have evaluated the spatial occurrence of faults within convergent and divergent basins and within the petroleum fields. We built a fault density map (1° × 1°) as a proxy of brittle tectonics occurrence using onshore, active and non-active faults from a worldwide fault database integrating published global and regional datasets (Supplementary Figs. 6 and 7a–e). Fault density, in terms of number of faults, weighted for their length (km) per km2 (Nf kmf km−2) is mapped by using a kernel density algorithm25,26 (Methods, Supplementary Note 4 and Supplementary Figs. 8 and 9a–c). We then compared the statistical distribution of the global fault density with fault density values in convergent and divergent basins in petroleum fields and at seep locations (Fig. 2b). Results show that convergent basins are, on average, more fractured than divergent basins (mean fault density values are 274.7 and 102.9 Nf kmf km−2, respectively). This is likely due to the presence, in convergent basins, of longer faults, mainly thrusts associated with orogenic belts. These fault systems concentrate along the edges of thrust-and-fold belts and may be related to ruptures from shallow decollement layers up to the surface with multiple short-cuts, back-thrusts, and ancillary high-angle fracturing20,27. Petroleum fields show a mean fault density value (202.7 Nf kmf km−2) comparable to that of convergent basins. Interestingly, seeps occur for any value of fault density. This means that both isolated faults and regions with fault clusters can host seeps (Fig. 2b). Petroleum fields and seeps prevail in convergent basins (Table 1). This can be explained by the fact that convergent basins, although covering a smaller area than that of divergent basins, are more fractured and faulted (Fig. 2b)28.
To summarise, we found that seeps occur for any type of fault density, preferably at the boundaries of petroleum fields hosted mainly in convergent basins with heat flow values ≤98 mWm−2 (Supplementary Note 3).
We evaluated the role of faulting regime in gas seepage by correlating the seep location and type to the style (reverse, normal, and strike-slip) of the fault.
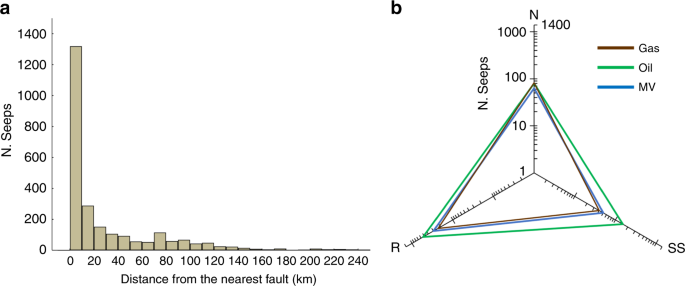
The distance between each seep and the nearest fault is calculated by proximity analysis (see Methods, Supplementary Note 4 and Supplementary Table 2). We stress that the nearest fault considered in this analysis solely serves as the source of information on the faulting regime of the area associated with seepage, and does not necessarily represent the actual fault system along which fluids migrated originating the seep.
The results show that the distance between each seep and the nearest fault, used to extract information on the fault style, is mostly less than 20 km (Fig. 3a, Supplementary Fig. 10). This value corresponds to the nearest threshold distance common to all types of seeps (Supplementary Fig. 11) and it is within the uncertainty of geographic position of either seep and/or global fault inventories (see Methods). Accordingly, this distance has been used to analyse the association between seeps and fault type. The radar diagram in Fig. 3b shows that all types of seeps, i.e., gas seeps, oil seeps and mud volcanoes, occur in areas characterised by any fault style, with a preference for reverse faults, which is the type of faulting more frequent within petroleum field areas (Supplementary Table 3). The close spatial relation between mud volcanoes and reverse faults was evidenced in local and regional studies and it can be related to low-angle thrusts14,16. Also, mud volcanoes can be observed in strike-slip/transpressive29,30,31, and extensional32,33 settings. Extensional basins are characterised by higher rates of sedimentation, a depositional condition necessary for the trapping and migration of hydrocarbons14. A case study in Northern Italy demonstrates that mud volcanoes tend to occur on top of thrust-related anticlines hosting the main reservoir34. Our global analysis reveals that oil seeps are more frequently associated with reverse faults. It must be noted, however, that oil seeps may be not associated with any fault, as oil can migrate along permeable stratigraphic layers (e.g., homocline seeps)15,24. In our database, for example, we recognise 134 oil seeps located at distances >100 km from the nearest fault (most of them in the cratonic Siberian oil provinces). The association between gas seeps and normal faults (Fig. 3b) is similar to the one observed for geothermal CO2 degassing, which is mainly controlled by extensional structures5. This is the only analogy between CH4 and CO2 degassing and fault association. Basically, our results show that hydrocarbon seepage is not exclusively associated with any given fault type. The observed association between the tectonic style and seepage can, in theory, be also applied to offshore areas, where presently geospatial analyses cannot be performed due to the lack of a global inventory with precise seep geographic location6.
a Histogram of the distances between seeps and the nearest fault bearing the faulting style information, as available in the global fault dataset. The distinction by fault type is shown in Supplementary Fig. 10. b Radar diagram showing the number and the type of seeps related to fault type (nearest fault); N: normal, SS: strike-slip, R: reverse; Gas: gas seeps, Oil: oil seeps, MV: mud volcanoes.
Global spatial model of geo-CH4 seepage favourability
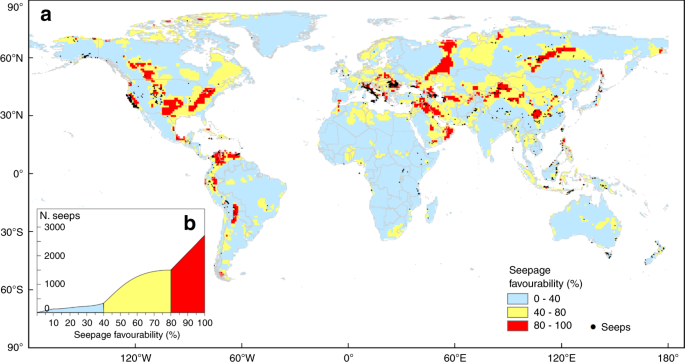
On the basis of the results of the geospatial analysis, we developed a conceptual spatial model of seepage occurrence providing a global map of the potential geo-CH4 emission areas. We used a GIS-based Spatial Multi-Criteria Decision Analysis (SMCDA) and, in particular, the Analytical Hierarchy Process (AHP) (Methods and Supplementary Note 5). The conceptual spatial model of seepage occurrence includes the following geological input parameters: basin type (convergent, divergent); global petroleum fields; heat flow; fault density, and faulting style. These factors are weighted by using AHP, an effective tool for determining the best combinations of factors. The model, represented by a raster map with 1° × 1° grid cell, has been normalised to obtain a final favourability map of seepage, expressed as spatial probability (%) of occurrence (Fig. 4a and Supplementary Fig. 12).
The model has been validated by verifying that the number of known (inventoried) seeps increases with seepage favourability. The test shows that about 70% of the seeps fall in the probability exceeding 50% (Fig. 4b). The model also suggests that, in addition to the known seepage areas (black dots in Fig. 4a), wide areas of geo-CH4 emissions potentially occur in North America, Northern and Arctic Europe, Western Russia, Caucasus and Eastern Europe, Western Siberia, China, Turkmenistan, Kyrgyzstan and the Arabian Peninsula (Supplementary Note 5, Supplementary Fig. 12). The favourability model also allows to identify potential areas of microseepage, i.e., diffuse degassing of methane and other light hydrocarbons. The favourability model is in fact applicable to any type of seepage, focused (seeps or macro-seeps) and diffused (microseepage), since the gas migration mechanism (fundamentally advective, i.e., driven by pressure gradients, and whose intensity is mainly controlled by fault-related permeability) is the same15,18,22. Besides the relevance for oil-gas exploration14,35, microseepage was estimated as the major geo-CH4 source to the atmosphere (about 24 (15–33) Mt yr−1)6,10. The main uncertainty in the global CH4 source strength is related to the limited knowledge of the global microseepage area. Our model suggests a high probability (≥50%) microseepage area of 8.1 Mkm2, a value consistent with that previously predicted by process-based modelling (8.6 Mkm2)6.
Discussion
As mentioned above, the results of our global geospatial analysis are consistent with previous qualitative and local scale observations14,16. We also checked specific examples where the type of fault in correspondence with the seepage is known. For example, gas seepage along normal faults occurs in the Katakolo Bay in Greece36 and in the Tiber Delta in Italy37. The Giswil seep (Switzerland) is an example of gas exhalation along a strike-slip fault38. Mud volcanoes along thrust faults were studied in particular in Northern Italy and Azerbaijan16,21.
We have shown that the tectonics style does not significantly affect the methane release. In fact, while compressional and extensional stresses may play a role in controlling water and oil migration (i.e., hydraulic conductivity), they do not significantly affect the gas-bearing property of faults, as a fault that is impermeable to water can be permeable to gas, as well known in studies on gas flow in fractured media39,40,41. Other factors, including lithology, rheology, fault activity and self-sealing processes (e.g., secondary mineral depositional processes) control the gas permeability of a fault42,43.
The role of fault activity could not be examined in our geospatial analyses, because available datasets include only active faults (GEM dataset) or do not distinguish active from inactive faults. However, gas migration studies demonstrated that non-active, ancient faults in stable and poorly fractured terrains (e.g., in granites, within cratons) can also be gas-bearing44,45. This is consistent with our analysis that showed no relationship between fault density and seepage.
The fact that CH4 can potentially be released by any type of fault is a key conclusion in fixing the criteria to search areas of CH4 release on Mars, where reverse and normal faults are recognised46. Recent CH4 spike detections in the Martian atmosphere have raised the question about the tectonic structures potentially favouring the release of methane19. By analogy with what is observed on Earth, any type of fault on Mars, regardless the fault density of the area, may potentially be methane-bearing. Therefore, even isolated faults, either the extensional faults of the Tharsis region and along the Martian dichotomy, or the compressional faults in the lowlands (e.g., Acidalia, Utopia) and in the highlands (e.g., Arabia Terra) can potentially host gas seepage. Like on Earth, potential mud volcanism on Mars should preferentially occur within reverse fault areas. Morphological structures resembling mud volcanoes were actually identified in regions with compressional tectonic settings47,48,49. Whether methane source rocks, which are essential for Earth’s seepage, do exist on Mars as yet remains an unknown factor49.
Methods
Datasets
Reported input data refer to a series of geological and geographic databases available in shapefile (either points, polylines or polygons), csv, ASCII, and/or grid formats, managed and elaborated in ArcGIS Pro (Copyright © 1999-2018 Esri Inc.). Geographic coordinates of all datasets are expressed in decimal longitude and latitude in the GCS WGS 1984 world projection system. All raster maps are reported in 1° × 1° square grid format. The source of the several datasets (onshore seeps, sedimentary basins, petroleum fields, heat flow and faults) are described in Data Availability.
Geospatial analysis
All datasets were analysed by using geospatial and geostatistical analyses in GIS environment. The output raster values of 1° × 1° grid maps were extracted at each seep location using the Spatial Analyst Tool (Extract Multi Values to Points command).
The Kernel Density algorithm was used to calculate the fault density map, weighted by fault length, expressed as number of faults multiplied by fault length and divided by unit area (Nf·kmf km−2) (Supplementary Figs. 8 and 9a–c). The kernel function is described in Silverman25. We calculated the density of faults around each output raster cell by fitting a smoothly curved surface over each fault line. The surface value is higher at the location of the fault and decreases with increasing distance, tapering to zero at the search radius distance from the fault.
We used proximity analysis (Near Distance) to define the distance of each seep from the nearest fault in order to identify the faulting style (normal, strike slip and reverse) of the seep near-field.
Exploratory Spatial Data Analysis allows by charts, graphs, and tables to explore and interpret the correlation among different datasets. In this work, bar charts were used to highlight the spatial relationships between seeps and basins. Histograms and normal probability plots were used to highlight the statistical distribution of the seep distances from the nearest fault system bearing the information of the faulting style (Supplementary Figs. 10 and 11). Histograms were also used to represent and compare fault density data at different scales (global, basins and petroleum fields). Radar diagram was used to investigate the seep distribution in relation to the type of fault.
Spatial modelling of global geo-CH4 seepage favourability
We used a Spatial (GIS-based) MultiCriteria Decision Analysis (SMCDA) to identify the most favourable areas for seepage based on the results of the geospatial analysis, highlighting the relationships among seeps, basins, petroleum fields, heat flow, fault density and fault type (Supplementary Note 5). SMCDA represents a significant evolution of the conventional MCDA in the spatial context50,51,52,53. We used, in particular, the Analytical Hierarchy Process (AHP) (Supplementary Note 5, Supplementary Tables 4, 5a–b and 6)54,55,56.
Uncertainty of geospatial analysis and original datasets
Most seeps (2313, 86% of total) have geographic coordinates provided by GPS measurement with uncertainty in the orders of a few metres. For about 14% of seeps (386 seeps) the exact position was not available and geographic coordinates were assigned57 based on the closest village, generally with the same name of the seep as reported in the literature or other inventories. The actual location of the seep would not exceed, anyway, a few kilometres. Since all inventoried seeps have geographic coordinates with an error <1°, the uncertainty of the spatial location of the seeps at the 1° × 1° grid scale is negligible.
The uncertainty in fault location in the individual datasets used for our global inventory is generally not quantified. The GEM database reports an accuracy corresponding to the denominator of map scale. Since faults were typically compiled and digitised from different maps ranging from 1:100,000 to 1: 1,000,000 scale, the accuracy of the fault location should be in the order of 1–10 km. Australia dataset reports a location accuracy between 50 and 1000 m, depending on the quality and scale of the original source data58. New Zealand fault database was intended to be represented at 1:250,000 by the designers (GNS Science). Metadata do not report uncertainty and data accuracy59. Other used fault databases do not report any indication of uncertainty and accuracy and thus may not have been subject to any verification or other quality control process. Gaps in the global fault distribution may occur due to the fact that some individual datasets mostly report undefined faults (not included in our integrated dataset), as it happens for Africa, Australia and North America. The final, integrated fault database was checked in terms of geometric duplicates by using the Data Reviewer tool available in ArcGIS. The results of this analysis do not return geometric duplicates.
The first version of the Heat Flow dataset compiled by60, released by the International Heat Flow Commission61, indicated that the location of heat flow measurements is of uncertain origin and that the references, as cited in Global Heat Flow Database, were incomplete. GIS capture and quality control were carried out by the Cartographic Services (part of the Geography Department) at Oklahoma State University.
The dataset repository of petroleum fields [https://www.prio.org/Data/Geographical-and-Resource-Datasets/Petroleum-Dataset/Petroleum-Dataset-v-12]62 did not quantify the uncertainty of the petroleum field locations. In the original dataset, several of the sources for field locations were not provided in GIS readable format (e.g., shapefiles), and thus they were digitised from original pdf maps. Details are reported at [https://www.prio.org/Global/upload/CSCW/Data/Geographical/codebook.pdf].
Data availability
Onshore hydrocarbon seeps. We used the most comprehensive inventory of onshore hydrocarbon seeps, including 2699 gas and oil seeps, and mud volcanoes (MV), derived from ref. 6 (Fig. S1). The dataset includes the seep inventory of CGG57, which due to license restrictions can be requested at [https://www.cgg.com/en/What-We-Do/Multi-Client-Data/Geological/Robertson-Geochemistry]. Sedimentary Basins. We used the map of the world sedimentary basins from CGG [http://www.datapages.com/associatedwebsites/gisopenfiles/robertstellussedimentarybasinsoftheworldmap.aspx]. We extracted 733 onshore basins classified as convergent and divergent (see Supplementary Note 3). Petroleum fields. We used the global distribution of petroleum (oil and gas) fields from PETRODATA Dataset by PRIO (Peace Research Institute Oslo; [https://www.prio.org/Data/Geographical-and-Resource-Datasets/Petroleum-Dataset/Petroleum-Dataset-v-12/]62. The dataset includes 891 onshore petroleum fields from 114 countries. It also includes information about the geographic location of hydrocarbon reserves and is specifically designed for display, manipulation and analysis in geographic information systems. Heat Flow Database. International Heat Flow Commission61. Global Heat flow database from the International Heat Flow Commission 2011. [http://www.webservice-energy.org/record/3d51419ad85280a84570ef17e880daf89d46be56/]. Fault datasets. A new global dataset of faults was developed combining the GEM (Global Earthquake Model) GAF (Global Active Faults) database and national/regional datasets (listed below). Additional national/regional databases, including non-active faults, available on the web, were also considered. The global fault database includes 114,317 onshore faults (70,732 normal faults; 12,026 strike slip faults; 31,559 reverse faults). We excluded the faults with missing movement information. GEM Global Active Fault Database. The GEM-GAF dataset [https://github.com/GEMScienceTools/gem-global-active-faults] consists of GIS files of shallow fault traces with relevant attributes (i.e., fault geometry, style) and it is licensed under a Creative Commons Attribution License. Global Faults layer from ArcAtlas (ESRI). [http://www.arcgis.com/home/item.html?id=a5496011fa494b99810e4deb5c618ae2#overview]. Afghanistan. U.S. Dep. of the Interior, Data.gov team [https://catalog.data.gov/dataset/geologic-faults-of-afghanistan-fltafg]. Australia. Geoscience Australia and Australian Stratigraphy Commission. (2017). Australian Stratigraphic Units. Bangladesh. U.S. Dep. of the Interior, Data.gov team, [https://catalog.data.gov/dataset/faults-and-tectonic-contacts-of bangladesh-flt8bg]. Caribbean Region. U.S. Dep. of the Interior, Data.gov team [https://catalog.data.gov/dataset/faults-of-the-caribbean-region-flt6bg]. Central Asia. Central Asia Fault Database available at [https://esdynamics.geo.uni-tuebingen.de/faults/]. Crimea. Faults digitised from ref. 63. Europe. including Turkey. U.S. Dep. of the Interior, Data.gov team [https://catalog.data.gov/dataset/faults-of-europe-including-turkey-flt4-2l]. Georgia. Tectonic map of Georgia from ref. 64. Greece. [http://diss.rm.ingv.it/share-edsf/]. Iran. U.S. Dep. of the Interior, Data.gov team [https://catalog.data.gov/dataset/major-faults-in-iran-flt2cg]. Ireland. Geological Survey Ireland, Ireland [www.gsi.ie]. Italy. Elementi tettonici presenti nella Carta Geologica d’Italia alla scala 1:100.000. Copyright: Servizio Geologico d’Italia—ISPRA. Portale del Servizio geologico d’Italia [http://sgi.isprambiente.it/geoportal/]. New Zealand. GNS Science, http://data.gns.cri.nz/af/, New Zealand Active fault database. North America. U.S. Geological Survey (and supporting agency if appropriate-see list below), 2006, Quaternary fault and fold database for the United States, accessed DATE, from USGS web site: [https://earthquake.usgs.gov/hazards/qfaults/]. South America. https://github.com/ActiveTectonicsAndes/ATA. Spain. QAFI v.3-Quaternary Active Faults Database of Iberia.: http://info.igme.es/qafi/About.aspx. Switzerland. Opendata Swiss, 2005. Mappa tettonica della Svizzera (GK500-Tekto). Ufficio federale di topografia [http://opendata.swiss/themes/geography]. United Kingdom. British Geological Survey, BGS Geology 625k (DiGMapGB-625) data 1: 625000 ESRI® Faults. [http://www.bgs.ac.uk/products/digitalmaps/dataInfo.html#_625].
Change history
15 July 2020
The original version of this Article was updated shortly after publication following an error that resulted in the ORCID IDs of Giancarlo Ciotoli, Monia Procesi, Giuseppe Etiope, Umberto Fracassi and Guido Ventura being omitted.
References
Mörner, N. A. & Etiope, G. Carbon degassing from the lithosphere. Glob. Planet. Change 33, 185–203 (2002).
Etiope, G. & Klusman, R. W. Geologic emissions of methane to the atmosphere. Chemosphere 49, 777–789 (2002).
Etiope, G., Lassey, K. R., Klusman, R. W. & Boschi, E. Reappraisal of the fossil methane budget and related emission from geologic sources. Geophys. Res. Lett. 35, L09307 (2008a).
Burton, M., Sawyer, G. M. & Granieri, D. Deep carbon emissions from volcanoes. Rev. Min. Geochem. 75, 323–354 (2013).
Tamburello, G., Pondrelli, S., Chiodini, G. & Rouwet, D. Global-scale control of extensional tectonics on CO2 Earth degassing. Nat. Comm. 9, 4608 (2018).
Etiope, G., Ciotoli, G., Schwietzke, S. & Schoell, M. Gridded maps of geological methane emissions and their isotopic signature. Earth Syst. Sci. Data 11, 1–22 (2019).
Kerrick, D. M. Present and past non anthropogenic CO2 degassing from the solid earth. Rev. Geophys. 39, 565–585 (2001).
Brune, S., Williams, S. E. & Muller, R. D. Potential links between continental rifting, CO2 degassing and climate change through time. Nat. Geosci. 10, 941–946 (2017).
Ciais, P., et al. Carbon and Other Biogeochemical Cycles In: Climate Change 2013: The Physical Science Basis. (eds. Stocker, T. F., et al.), Contribution of Working Group I to the Fifth Assessment Report of IPCC.
Etiope, G. & Schwietzke, S. Global geological methane emissions: an update of top-down and bottom-up estimates. Elem. Sci. Anth 7, 47 (2019).
Saunois, M. et al. The global methane budget 2000-2012. Earth Syst. Sci. Data 8, 697–751 (2016).
Hmiel, B. et al. Preindustrial 14CH4 indicates greater anthropogenic fossil CH4 emissions. Nature 578, 409–412 (2020).
Kvenvolden, K. A. & Rogers, B. W. Gaia’s breath-global methane exhalations. Mar. Petrol. Geol. 22, 579–590 (2005).
Macgregor, D. S. Relationships between seepage, tectonics and subsurface petroleum reserves. Mar. Petrol. Geol. 10, 606–619 (1993).
Etiope, G. Natural Gas Seepage, The Earth’s Hydrocarbon Degassing, 199, (Springer, Switzerland, 2015).
Bonini, M. Fluid seepage variability across the external Northern Apennines (Italy): structural controls with seismotectonic and geodynamic implications. Tectonophysics 590, 151–174 (2013).
Etiope, G. & Klusman, R. W. Methane microseepage in drylands: soil is not always a CH4 sink. J. Integr. Env. Sci. 7, 31–38 (2010).
Etiope, G. & Klusman, R. W. Microseepage in drylands: flux and implications in the global atmospheric source/sink budget of methane. Glob. Planet. Change 72, 265–274 (2010).
Giuranna, M. et al. Independent confirmation of a methane spike on Mars and a source region east of Gale Crater. Nat. Geosci. 12, 326–332 (2019).
Ingersoll, R.V. Tectonics of sedimentary basins with revised nomenclature (eds. Busby, C. & Azor, A.) In Tectonics of Sedimentary Basins: Recent Advances (John Wiley, Chichester, 2012).
Mazzini, A. & Etiope, G. Mud volcanism: an updated review. Earth Sci. Rev. 168, 81–112 (2017).
Abrams, M. A. Significance of hydrocarbon seepage relative to petroleum generation and entrapment. Mar. Pet. Geol. 22, 457–477 (2005).
Hunt, J.M. Petroleum Geochemistry and Geology (2nd edn.) (W.H. Freeman, New York, 1996).
Link, W. K. Significance of oil and gas. Seeps in world oil exploration. AAPG Bull. 36, 1505–1541 (1952).
Silverman, B. W. Density Estimation for Statistics and Data Analysis. (Chapman and Hall, New York, 1986).
Hiemer, S. et al. Smoothed stochastic earthquake rate model considering seismicity and fault moment release for Europe. Geophys. J. Int. 198, 1159–1172 (2014).
McClay, K.R. Thrust Tectonics. (Chapman and Hall, London, 1992).
Burk, C.A. & Drake C.L., The Geology of Continental Margins. (Springer-Verlag, New York, 1974)
Mazzini, A. et al. Strike-slip faulting as a trigger mechanism for overpressure release through piercement structures. Implications for the Lusi mud volcano, Indonesia. Mar. Petrol. Geol. 26, 1751–1765 (2009).
Medialdea, T. et al. Tectonics and mud volcano development in the Gulf of Cádiz. Mar. Geol. 261, 48–63 (2009).
Hensen, C. et al. Strike-slip faults mediate the rise of crustal-derived fluids and mud volcanism in the deep sea. Geology 43, 339–342 (2015).
Slack, J. F., Turner, R. J. W. & Ware, P. L. G. Boron-rich mud volcanoes of the Black Sea region: Modern analogues to ancient sea-floor tourmalinites associated with Sullivan-type Pb-Zn deposits? Geology 26, 439–442 (1998).
Kopf, A. J. Significance of mud volcanism. Rev. Geophys. 40, 1005 (2002).
Maestrelli, D., Bonini, M. & Sani, F. Linking structures with the genesis and activity of mud volcanoes: examples from Emilia and Marche (Northern Apennines, Italy). Int. J. Earth Sci. 108, 1683–1703 (2019).
Schumacher, D. Surface geochemical exploration for oil and gas: new life for an old technology. Lead. Edge 19, 258–261 (2000).
Etiope, G., Christodoulou, D., Kordella, S., Marinaro, G. & Papatheodorou, G. Offshore and onshore seepage of thermogenic gas at Katakolo Bay (Western Greece). Chem. Geol. 339, 115–126 (2013).
Ciotoli, G. et al. Tiber delta CO2‐CH4 degassing: a possible hybrid, tectonically active sediment‐hosted geothermal system near Rome. J. Geophys. Res. 121, 48–69 (2016).
Etiope, G., Zwahle, C., Anselmetti, F. S., Kipfer, R. & Schubert, C. J. Origin and flux of a gas seep in the Northern Alps (Giswil, Switzerland). Geofluids 10, 476–485 (2010).
Muskat, M. The Flow of Homogeneous Fluids Through Porous Media (Edwards Inc., Ann Arbor, Michigan, 1946).
Horseman, S. T., Harrington, J. F. & Sellin, P. Gas migration in clay barriers. Eng. Geol. 54, 139–149 (1999).
Etiope, G. & Martinelli, G. Migration of carrier and trace gases in the geosphere: an overview. Phys. Earth Planet. 129, 185–204 (2002).
Sibson, R. H. Structural permeability of fluid-driven fault fracture meshes. J. Struct. Geol. 20, 655–660 (1996).
Sheldon, H. A. & Micklethwaite, S. Damage and permeability around faults: Implications for mineralization. Geology 35, 903–906 (2007).
Malmqvist, L. & Kristiansson, K. Experimental evidence for an ascending microflow of geogas in the ground. Earth Planet. Sci. Lett. 70, 407–416 (1984).
Malmqvist, L. & Kristiansson, K. A physical mechanism for the release of free gases in the lithosphere. Geoexploration 23, 447–453 (1985).
Knapmeyer, M. et al. Working models for spatial distribution and level of Mars’ seismicity. J. Geophys. Res. 111, E11006 (2006).
Skinner, J. A. Jr. & Tanaka, K. L. Evidence for and implications of sedimentary diapirism and mud volcanism in the southern Utopia highland-lowland boundary plain, Mars. Icarus 186, 41–59 (2007).
Oehler, D. Z. & Allen, C. C. Evidence for pervasive mud volcanism in Acidalia Planitia, Mars. Icarus 208, 636–657 (2010).
Oehler, D. Z. & Etiope, G. Methane seepage on Mars: where to look and why. Astrobiology 17, 1233–1264 (2017).
Saaty, T. L. A scaling method for priorities in hierarchical structure. J. Math. Psychol. 15, 234–281 (1977).
Saaty, R. W. The analytic hierarchy process - what it is and how it is used. Math. Model. 9, 161–176 (1987).
Saaty, T. L. Decision making with the analytic hierarchy process. Int. J. Serv. Sci. 1, 83–98 (2008).
Chen, J. & Zhu, Q. Uncertainty and decision strategy analysis of GIS-based ordered weighted averaging method. International Conference on Information Networking and Automation (ICINA) (2010).
Malczewski, J. & Rinner, C. Multicriteria Decision Analysis in Geographic Information Science (Springer, 2015).
Malczewski, J. GIS‐based multicriteria decision analysis: a survey of the literature. Int. J. Geogr. Inf. Sci. 20, 703–726 (2006).
Malczewski, J. GIS and Multicriteria Decision Analysis (John Wiley and Sons, New York, 1999).
CGG: Organic Geochemistry Data from FRogi and Fluid Features Database. https://www.cgg.com/en/What-We-Do/Multi-Client-Data/Geological/Robertson-Geochemistry (Accessed 30 Nov 2018), 2015.
Raymond, O.L., Liu, S., Gallagher, R., Highet, L.M. & Zhang, W. Surface Geology of Australia, 1:1 000 000 scale, 2012 edn. Digital Dataset. Geoscience Australia (Commonwealth of Australia, Canberra, 2012).
Langridge, R. M. et al. The New Zealand active faults database. N.Z. J. Geol. Geoph. 59, 86–96 (2016).
Jessop, A.M., Hobart, M.A., & Sclater, J.G. The World Heat Flow Data Collection-1975. Geological Survey of Canada, Earth Physics Branch, Geothermal Series, Vol. 5, 10 (1976).
IHFC. The Global Heat Flow Database of the International Heat Flow Commission. http://www.datapages.com/gis-map-publishing-program/gis-open-files/global-framework/global-heat-flow-database (2016).
Lujala, P., Rød, J. K. & Thieme, N. Fighting over oil: introducing a new dataset. Conf. Manag. Peace Sci. 24, 239–256 (2007).
Kopf, A. et al. Isotopic evidence (He, B, C) for deep fluid and mud mobilization from mud volcanoes in the Caucasus continental collision zone. Int. J. Earth Sci. 92, 407–425 (2003).
Gamkrelidze, I., Gamkrelidze, M., Loladze, M. & Tsamalashvili, T. New tectonic map of Georgia (Explanatory Note). Bull. Georgian Nat. Acad. Sci. 9, 201 (2000).
Author information
Authors and Affiliations
Contributions
G.C. and G.E. conceived the study. G.C. and M.P. carried out the geospatial analysis. G.C., M.P., G.E., U.F. and G.V. analysed and interpreted the data and wrote the manuscript.
Corresponding author
Ethics declarations
Competing interests
The authors declare no competing interests.
Additional information
Peer review information Nature Communications thanks Ken McCaffrey and Dietmar Schumacher for their contribution to the peer review of this work. Peer reviewer reports are available.
Publisher’s note Springer Nature remains neutral with regard to jurisdictional claims in published maps and institutional affiliations.
Supplementary information
Rights and permissions
Open Access This article is licensed under a Creative Commons Attribution 4.0 International License, which permits use, sharing, adaptation, distribution and reproduction in any medium or format, as long as you give appropriate credit to the original author(s) and the source, provide a link to the Creative Commons license, and indicate if changes were made. The images or other third party material in this article are included in the article’s Creative Commons license, unless indicated otherwise in a credit line to the material. If material is not included in the article’s Creative Commons license and your intended use is not permitted by statutory regulation or exceeds the permitted use, you will need to obtain permission directly from the copyright holder. To view a copy of this license, visit http://creativecommons.org/licenses/by/4.0/.
About this article
Cite this article
Ciotoli, G., Procesi, M., Etiope, G. et al. Influence of tectonics on global scale distribution of geological methane emissions. Nat Commun 11, 2305 (2020). https://doi.org/10.1038/s41467-020-16229-1
Received:
Accepted:
Published:
DOI: https://doi.org/10.1038/s41467-020-16229-1
This article is cited by
-
Dynamic tensile behaviour under impact loading for rocks damaged by static precompression
Archives of Civil and Mechanical Engineering (2023)
-
Macro-seepage based potential new hydrocarbon prospects in Assam-Arakan Basin, India
Scientific Reports (2022)
-
Global thermal spring distribution and relationship to endogenous and exogenous factors
Nature Communications (2022)
-
Human carcinogenic risk analysis and utilization of shale gas water-based drilling cuttings in road materials
Environmental Science and Pollution Research (2022)
Comments
By submitting a comment you agree to abide by our Terms and Community Guidelines. If you find something abusive or that does not comply with our terms or guidelines please flag it as inappropriate.

