
Abstract
Situated at over 5,000 meters above sea level in the Himalayan Mountains, Roopkund Lake is home to the scattered skeletal remains of several hundred individuals of unknown origin. We report genome-wide ancient DNA for 38 skeletons from Roopkund Lake, and find that they cluster into three distinct groups. A group of 23 individuals have ancestry that falls within the range of variation of present-day South Asians. A further 14 have ancestry typical of the eastern Mediterranean. We also identify one individual with Southeast Asian-related ancestry. Radiocarbon dating indicates that these remains were not deposited simultaneously. Instead, all of the individuals with South Asian-related ancestry date to ~800 CE (but with evidence of being deposited in more than one event), while all other individuals date to ~1800 CE. These differences are also reflected in stable isotope measurements, which reveal a distinct dietary profile for the two main groups.
Introduction
Nestled deep in the Himalayan mountains at 5029 m above sea level, Roopkund Lake is a small body of water (~40 m in diameter) that is colloquially referred to as Skeleton Lake due to the remains of several hundred ancient humans scattered around its shores (Fig. 1)1. Little is known about the origin of these skeletons, as they have never been subjected to systematic anthropological or archaeological scrutiny, in part due to the disturbed nature of the site, which is frequently affected by rockslides2, and which is often visited by local pilgrims and hikers who have manipulated the skeletons and removed many of the artifacts3. There have been multiple proposals to explain the origins of these skeletons. Local folklore describes a pilgrimage to the nearby shrine of the mountain goddess, Nanda Devi, undertaken by a king and queen and their many attendants, who—due to their inappropriate, celebratory behavior—were struck down by the wrath of Nanda Devi4. It has also been suggested that these are the remains of an army or group of merchants who were caught in a storm. Finally, it has been suggested that they were the victims of an epidemic5.
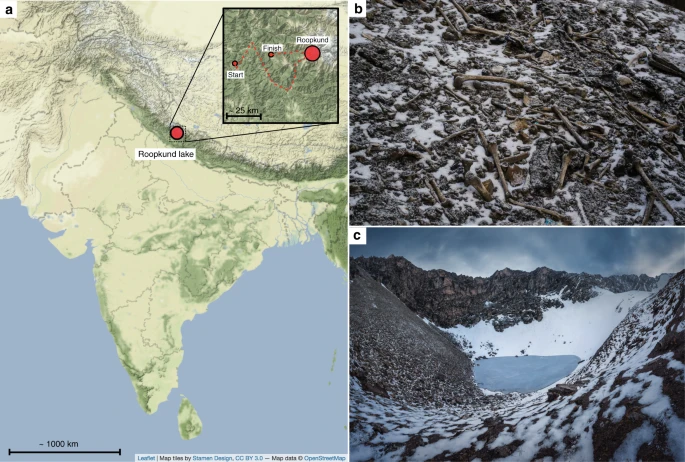
Context of Roopkund Lake. a Map showing the location of Roopkund Lake. The approximate route of the Nanda Devi Raj Jat pilgrimage relative to Roopkund Lake is shown in the inset. b Image of disarticulated skeletal elements scattered around the Roopkund Lake site. Photo by Himadri Sinha Roy. c Image of Roopkund Lake and surrounding mountains. Photo by Atish Waghwase
To shed light on the origin of the skeletons of Roopkund, we analyzed their remains using a series of bioarcheological analyses, including ancient DNA, stable isotope dietary reconstruction, radiocarbon dating, and osteological analysis. We find that the Roopkund skeletons belong to three genetically distinct groups that were deposited during multiple events, separated in time by approximately 1000 years. These findings refute previous suggestions that the skeletons of Roopkund Lake were deposited in a single catastrophic event.
Results
Bioarcheological analysis of the Roopkund skeletons
We obtained genome-wide data from 38 individuals by extracting DNA from powder drilled from long bones, producing next-generation sequencing libraries, and enriching them for approximately 1.2 million single nucleotide polymorphisms (SNPs) from across the genome6,7,8,9, obtaining an average coverage of 0.51 × at targeted positions (Table 1, Supplementary Data 1). We also obtained PCR-based mitochondrial haplogroup determinations for 71 individuals (35 of these were ones for whom we also obtained genome-wide data that confirmed the PCR-based determinations) (Table 2, Supplementary Note 1). We generated stable isotope measurements (δ13C and δ15N) from 45 individuals, including 37 for whom we obtained genome-wide genetic data, and we obtained direct radiocarbon dates for 37 individuals for whom we also had both genetic and isotope data (Table 1).
In this study, we also present an osteological assessment of health and stature performed on a different set of bones from Roopkund; this report was drafted well before genetic results from Roopkund were available but was never formally published (an edited version of the original report is presented here as Supplementary Note 2). The analysis suggests that the Roopkund individuals were broadly healthy, but also identifies three individuals with unhealed compression fractures; the report hypothesizes that these injuries could have transpired during a violent hailstorm of the type that sometimes occurs in the vicinity of Roopkund Lake, while also recognizing that other scenarios are plausible. The report also identifies the presence of both very robust and tall individuals (outside the range of almost all South Asians), and more gracile individuals, and hypothesizes based on this the presence of at least two distinct groups of individuals, consistent with our genetic findings (Supplementary Note 2).
Our analysis of the genome-wide data from 38 Roopkund individuals shows that they include both genetic males (n = 23) and females (n = 15)—consistent with the physical anthropology evidence for the presence of both males and females (Supplementary Note 2). The relatively similar proportions of males and females is difficult to reconcile with the suggestion that these individuals might have been part of a military expedition. We detected no relative pairs (3rd degree or closer) among the sequenced individuals10, providing evidence against the idea that the Roopkund skeletons might represent the remains of groups of families. We also found no evidence that the individuals were infected with bacterial pathogens, providing no support for the suggestion that these individuals died in an epidemic, although we caution that failure to find evidence for pathogen DNA in long bone powder may simply reflect the fact that it was present at too low a concentration to detect (Supplementary Note 3)11.
Roopkund skeletons form three genetically distinct groups
We explored the genetic diversity of the 38 Roopkund individuals using a previously established Principal Component Analysis (PCA) that is effective at visualizing genetic variation of diverse present-day people from South Asia (a term we use to refer to the territories of the present day countries of India, Pakistan, Nepal, Bhutan, Bangladesh, and Bhutan) relative to West Eurasian-related groups (a term we use to refer to the cluster of ancestry types common in Europe, the Near East, and Iran) and East Asian-related groups (a term we apply to the cluster of ancestry types common in East Asia including China, Japan, Southeast Asia, and western Indonesia)12. We find that the Roopkund individuals cluster into three distinct groups, which we will henceforth refer to as Roopkund_A, Roopkund_B, and Roopkund_C (Fig. 2a). Individuals in Roopkund_A (n = 23) fall along a genetic gradient that includes most present-day South Asians. However, they do not fall in a tight cluster along this gradient, suggesting that they do not comprise a single endogamous group, and instead derive from a diversity of groups. Individuals belonging to the Roopkund_B cluster (n = 14) do not fall along this gradient, and instead fall near present-day West Eurasians, suggesting that Roopkund_B individuals possess West Eurasian-related ancestry. A single individual, Roopkund_C, falls far from all other Roopkund individuals in the PCA, between the Onge (Andaman Islands) and Han Chinese, suggesting East Asian-related ancestry.
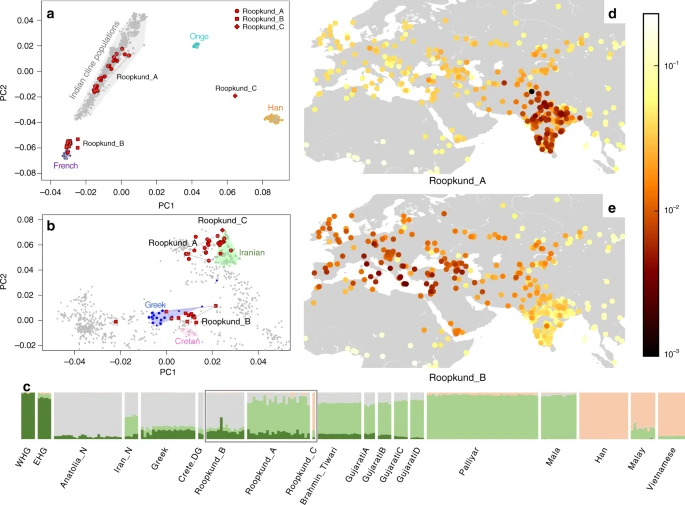
Genetic Structure of the Skeletons of Roopkund Lake. a Principal component analysis (PCA) of 1,453 present day individuals from selected groups throughout mainland South Asia (highlighted in gray). French individuals (representing the location where West Eurasian populations are known to cluster) are shown in purple, Chinese individuals are shown (representing the location where East Asian populations are known to cluster) in orange, and Andamanese individuals are shown in teal; the 38 Roopkund individuals are projected. b PCA of 988 present day West Eurasians with the Roopkund individuals projected. The PCA plot is truncated to remove Sardinians and southern Levantine groups; Present-day Greeks are shown in blue, Cretans in pink, Iranians in green, and all other West Eurasian populations in gray. A gray polygon encloses all the individuals in each Roopkund group with > 100,000 SNPs. c ADMIXTURE analysis of 2344 present-day and 1877 ancient individuals with K = 4 ancestral components. Only a subset of individuals with ancestries relevant to the interpretation of the Roopkund individuals are shown. Consistent with the PCA, Roopkund_A has ancestry most closely matching Indian groups; Roopkund_B has ancestry most closely matching Greek and Cretan groups; and Roopkund_C has ancestry most closely matching Southeast Asian groups. Genetic differentiation (FST) between Roopkund_A (d) and diverse present-day populations, and Roopkund_B (e) and diverse present-day populations. We only plotted present-day populations for which we have latitudes and longitudes; deeper red coloration indicates less differentiation to the Roopkund genetic cluster being analyzed. The plotted data are provided in a Source Data file
To further understand the West Eurasian-related affinity in the Roopkund_B cluster, we projected all the Roopkund individuals onto a second PCA designed to distinguish between sub-components of West Eurasian-related ancestry13,14 (Fig. 2b). Individuals assigned to the Roopkund_A and Roopkund_C groups cluster towards the top right of the PCA plot, close to present-day groups with Iranian ancestry, consistent with where populations with South Asian or East Asian ancestry cluster when projected onto such a plot13. Individuals belonging to the Roopkund_B group cluster toward the center of the plot, close to present-day people from mainland Greece and Crete15. We observe consistent patterns using the automated clustering software ADMIXTURE16 (Fig. 2c) and in pairwise FST statistics (Fig. 2d, e, Supplementary Data 2). The visual evidence from the PCA suggests that two individuals from the Roopkund_B group might represent genetic outliers (Fig. 2b). However, symmetry f4-statistics show that the two apparent outliers (one of which has relatively low coverage) are statistically indistinguishable in ancestry from individuals of the main Roopkund_B cluster relative to diverse comparison populations (Supplementary Data 3), and so we lump all the Roopkund_B individuals together in what follows.
Skeletons at Roopkund Lake were deposited in multiple events
The discovery of multiple, genetically distinct groups among the skeletons of Roopkund Lake raises the question of whether these individuals died simultaneously or during separate events. We used Accelerator Mass Spectrometry (AMS) radiocarbon dating to determine the age of the remains. We successfully generated radiocarbon dates from all but one of the individuals for which we have genetic data, using the same stocks of bone powder that we used for genetic analysis to ensure that the dates correspond directly to the genetic groupings. We find that the Roopkund_A and Roopkund_B groups are separated in time by ~1000 years, with the calibrated dates for individuals assigned to the Roopkund_A group ranging from the 7th–10th centuries CE, and the calibrated dates for individuals assigned to the Roopkund_B group ranging from the 17th–20th centuries CE (Table 1; Fig. 3a; Supplementary Data 4). The single individual assigned to Roopkund_C also dates to this later period. These results demonstrate that the skeletons of Roopkund Lake perished in at least two separate events. For Roopkund_A, we detect non-overlapping 95% confidence intervals (for example individual I6943 dates to 675–769 CE, while individual I6941 dates to 894–985 CE), suggesting that even these individuals may not have died simultaneously (Fig. 3a). In contrast, the calibrated dates obtained for 13 Roopkund_B individuals and the single Roopkund_C individual all have mutually overlapping 95% confidence intervals.
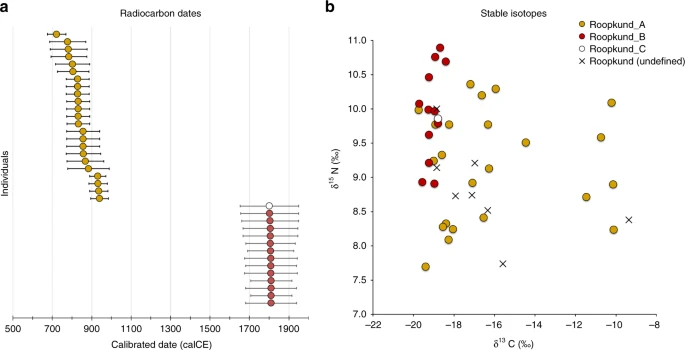
Radiocarbon and Isotopic Evidence of Distinct Origins of Roopkund Genetic Groups. a We generated 37 accelerator mass spectrometry radiocarbon dates and calibrated them using OxCal v4.3.2. The dating reveals that the individuals were deposited in at least two events ~1000 years apart. In fact, the Roopkund_A individuals (shown in yellow) may have been deposited over an extended period themselves, as the 95% confidence intervals for some of the radiocarbon dates (for example I6943 and I6941) do not overlap. Radiocarbon dates indicate that Roopkund_B (shown in red) and Roopkund_C (shown in white) individuals may have been deposited during a single event. Error bars indicate 95.4% confidence intervals. Calibration curves are shown in Supplementary Fig. 1. b We show normalized δ13C and δ15N values for samples with isotopic data: 37 for which genetic data were generated (circles with colors indicating their cluster), and eight for which no genetic data were generated (labeled Roopkund_U). In cases where multiple measurements were obtained, we plot the average of all measurements. The plotted data are provided as a Source Data file
Differences in diet correlate with genetic groupings
We carried out carbon and nitrogen isotope analysis of femur bone collagen for 45 individuals. Femur bone collagen is determined by diet in the last 10–20 years of life17, and therefore is not necessarily correlated with the genetic ancestry of a population, which reflects processes occurring over generations. Nevertheless, we find evidence of dietary heterogeneity across the genetic ancestry groupings, providing additional support for the presence of multiple distinct groups at Roopkund Lake. We first observed that the Roopkund individuals are characterized by a range of δ13C values indicating diets reliant on both C3 and C4 plant sources, as well as δ15N values indicating varying degrees of consumption of protein derived from terrestrial animals (Fig. 3b and Supplementary Note 4). The δ13C values are non-randomly associated with the genetic groupings for the 37 individuals for whom we had both measurements. We find that all the Roopkund_B individuals (with typically eastern Mediterranean ancestry), as well as the Roopkund_C individual, have δ13C values between −19.7‰ and −18.2‰ reflecting consumption of terrestrial C3 plants, such as wheat, barley, and rice (and/or animals foddered on such plants). In contrast, the Roopkund_A individuals (with typically South Asian ancestry) have much more varied δ13C values (−18.9‰ to −10.1‰), with some implying C3 plant reliance and others reflecting either a mixed C3 and C4 derived diet, or alternatively consumption of C3 plants along with animals foddered with millet, a C4 plant (a practice that has been documented ethnographically in South Asia17). The difference in the δ13C distribution between the Roopkund_A and Roopkund_B groupings is highly significant (p = 0.00022 from a two-sided Mann-Whitney test).
Genetic affinities of the Roopkund subgroups
We used qpWave18,19 to test whether Roopkund_B is consistent with forming a genetic clade with any present-day population (that is, whether it is possible to model the two populations as descending entirely from the same ancestral population with no mixture with other groups since their split). We selected 26 present-day populations for comparison, with particular emphasis on West Eurasian-related groups (we analyzed the West Eurasian-related groups Basque, Crete, Cypriot, Egyptian, English, Estonian, Finnish, French, Georgian, German, Greek, Hungarian, Italian_North, Italian_South, Norwegian, Spanish, Syrian, Ukranian, and the non-West-Eurasian-related groups Brahmin_Tiwari, Chukchi, Han, Karitiana, Mala, Mbuti, Onge, and Papuan). We find that Roopkund_B is consistent with forming a genetic clade only with individuals from present-day Crete. These results by no means imply that the Roopkund_B individuals originated in the island of Crete itself, although they suggest that their recent ancestors or they themselves came from a nearby region (Supplementary Note 5; Supplementary Data 5).
We performed a similar analysis on individuals belonging to the Roopkund_A group and find that they cannot be modeled as deriving from a homogeneous group (Supplementary Note 6). Instead, Roopkund_A individuals vary significantly in their relationship to a diverse set of present-day South Asians, consistent with the heterogeneity evident in PCA (Fig. 2a). We were unable to model the Roopkund_C individual as a genetic clade with any present-day populations, but we were able to model its ancestry as ~82% Malay-related and ~18% Vietnamese-related using qpAdm7, showing that this individual is consistent with being of Southeast Asian origin. We tested if any of the Roopkund groups show specific genetic affinity to present-day groups from the Himalayan region, including four neighboring villages in the northern Ladakh region for which we report new genome-wide sequence data, but we find no such evidence (Supplementary Note 7). Within the Roopkund_A group which has ancestry that falls within the variation of present-day South Asians, we observe a weakly significant difference in the proportion of West Eurasian-related ancestry in males and females (p = 0.015 by a permutation test across individuals; Supplementary Note 8), with systematically lower proportions of West Eurasian-related ancestry in males than females. This suggests that the males and females were drawn from significantly different mixtures of groups within South Asia.
Discussion
The genetically, temporally, and isotopically heterogeneous composition of the groups at Roopkund Lake was unanticipated from the context in which the skeletons were found. Radiocarbon dating reveals at least two key phases of deposition of human remains separated by around one thousand years and with significant heterogeneity in the dates for the earlier individuals indicating that they could not all have died in a single catastrophic event.
Combining multiple lines of evidence, we suggest a possible explanation for the origin of at least some of the Roopkund_A individuals. Roopkund Lake is not situated on any major trade route, but it is on a present-day pilgrimage route—the Nanda Devi Raj Jat pilgrimage which today occurs every 12 years (Fig. 1a). As part of the event, pilgrims gather for worship and celebration along the route. Reliable descriptions of the pilgrimage ritual do not appear until the late-19th century, but inscriptions in nearby temples dating to between the 8th and 10th centuries suggest potential earlier origins20. We view the hypothesis of a mass death during a pilgrimage event as a plausible explanation for at least some of the individuals in the Roopkund_A cluster.
The Roopkund_B cluster is more puzzling. It is tempting to hypothesize that the Roopkund_B individuals descend from Indo-Greek populations established after the time of Alexander the Great, who may have contributed ancestry to some present-day groups like the Kalash21. However, this is unlikely, as such a group would be expected to have admixture with groups with more typical South Asian ancestry (as the Kalash do), or would be expected to be inbred and to have relatively low genetic diversity. However, the Roopkund_B individuals have evidence for neither pattern (Supplementary Note 9). Combining different lines of evidence, the data suggest instead that what we have sampled is a group of unrelated men and women who were born in the eastern Mediterranean during the period of Ottoman political control. As suggested by their consumption of a predominantly terrestrial, rather than marine-based diet, they may have lived in an inland location, eventually traveling to and dying in the Himalayas. Whether they were participating in a pilgrimage, or were drawn to Roopkund Lake for other reasons, is a mystery. It would be surprising for a Hindu pilgrimage to be practiced by a large group of travelers from the eastern Mediterranean where Hindu practices have not been common; Hindu practice in this time might be more plausible for a southeast Asian individual with an ancestry type like that seen in the Roopkund_C individual. Given that the Roopkund_B and Roopkund_C individuals died only in the last few centuries, an important direction for future investigation will be to carry out archival research to determine if there were reports of large foreign traveling parties dying in the region over the last few hundred years.
Taken together, these results have produced meaningful insights about an enigmatic ancient site. More generally, this study highlights the power of biomolecular analyses to obtain rich information about the human story behind archaeological deposits that are so highly disturbed that traditional archaeological methods are not as informative.
Methods
The genetic analysis of Himalayan populations (described in Supplementary Note 7) was approved by the Institutional Ethical Committee of the Centre for Cellular and Molecular Biology in Hyderabad, India.
Ancient DNA laboratory Work
A total of 76 skeletal samples (72 long bones and four teeth) were sampled at the Anthropological Survey of India, Kolkata. Skeletal sampling was performed for all samples in dedicated ancient DNA facilities at the Centre for Cellular and Molecular Biology (CCMB) in Hyderabad, India. A subset of samples that underwent preliminary ancient DNA screening at CCMB, including three samples that did not yield sufficient data to assign mitochondrial DNA haplogroups during preliminary screening (see Supplementary Note 1), were further processed at Harvard Medical School, Boston, USA, consistent with recommendations in the ancient DNA literature for repeating analyses in two independent laboratories to increase confidence in results22.
At CCMB, samples were prepared for processing by wiping with a bleach solution, followed by deionized water. The samples were then subjected to UV irradiation for 30 min on each side to minimize surface DNA contamination. Bone powder was then produced using a sterile dentistry drill.
We successfully generated genome-wide DNA for 38 individuals (Supplementary Data 1). For each sample, approximately 75 mg of bone powder originally prepared at CCMB was further processed in dedicated ancient DNA clean rooms at Harvard Medical School using standard protocols, including DNA extraction optimized for ancient DNA recovery23, modified by replacing the Zymo extender/MinElute column assemblage with a preassembled spin column device24, followed by library preparation with partial UDG treatment25. The quality of authentic ancient DNA preservation in each sample was assessed by carrying out a preliminary screening of all libraries via targeted DNA enrichment, designed to capture mitochondrial DNA in addition to 50 nuclear targets26. We sequenced the enriched libraries on an Illumina NextSeq500 instrument for 2 × 76 cycles with an additional 2 × 7 cycles for identification of indices. Based on this preliminary assessment, libraries that were deemed promising underwent a further enrichment using a reagent that targeted ~1.2 million SNPs6,7,8,9, and then were sequenced using an Illumina NextSeq500 instrument.
Bioinformatic processing
We used SeqPrep to trim adapters and molecular barcodes, and then merged paired-end reads that overlapped by a minimum of 15 base pairs (with up to one mismatch allowed) and aligned to the mitochondrial rsrs genome27 (for the mitochondrial screening analysis) or hg19 (for whole-genome analysis) using samse in bwa (v0.6.1)28. We identified duplicate sequences based on having the same start position, end position, orientation, and library-specific barcode, and only retained the copy with the highest quality sequence. We restricted to sequences with a minimum mapping quality (MAPQ ≥ 10) and minimum base quality (≥20) after excluding two bases from each end of the sequence. We obtained pseudo-haploid SNP calls by using a single randomly chosen sequence at SNPs covered by at least one sequence.
We subjected the resulting data to three tests of ancient DNA authenticity: (1) we analyzed the mitochondrial genome data to determine the rate of matching to the consensus sequence using contamMix, and excluded from analysis samples that exhibited a match rate less than 97%8. (2) We removed samples that exhibited a rate of C-to-T substitutions less than 3%: the minimum recommended threshold for authentic ancient DNA that has been subjected to partial UDG treatment25. (3) We used ANGSD29 to determine the degree of heterogeneity on the X-chromosome in males (who should only have one X chromosome) and excluded from analysis individuals with contamination rates greater than 1.5%.
We determined the mitochondrial haplogroup of each individual in two ways. For individuals with whole mitochondrial genome data, we determined the mitochondrial haplogroups using haplogrep230. We also determined mitochondrial haplogroups from mitochondrial DNA genotyping using multiplex PCR (see Supplementary Note 1).
We determined the genetic sex of the individuals by computing the ratio of the number of sequences that align to the X chromosome versus the Y chromosome. We searched for 1st, 2nd, and 3rd degree relative pairs in the dataset by analyzing patterns of allele sharing between pairs of individuals (we found none)10.
To identify Y-chromosome haplogroups in genetically male individuals, we used a modified version of the procedure reported in Poznik, et al.31, which performs a breadth-first search of the Y-chromosome tree. We made Y chromosome haplogroup calls using the ISOGG tree from 04.01.2016 [http://isogg.org], and recorded the derived and ancestral allele calls for each informative position on the tree. We counted the number of mismatches in the observed derived alleles on each branch of the tree and used this information to assign a score to each haplogroup, accounting for damage by down-weighting derived mutations that are the result of transitions to 1/3 of that of transversions. We assigned the closest matching Y-chromosome reference haplogroup to each male based on this score (Supplementary Data 6). We caution that males with fewer than 100,000 SNPs have too little data to confidently assign a haplogroup.
Population genetic analyses
We report data for 38 samples that passed contamination and quality control tests, with an average coverage of 0.51 × [range: 0.026–1.547] and 350088 SNPS covered at least once [range 30592–728448]. We processed the data in conjunction with published DNA obtained from ancient6,9,13,14,15,32,33,34,35,36,37,38,39,40,41,42,43,44,45,46,47,48,49,50,51,52,53,54,55,56,57,58,59,60,61 and present-day groups from throughout the world62,63,64,65,66,67,68, including ~175 modern groups from the Indian subcontinent12. The resulting merged dataset included 1521 ancient and 7985 present-day individuals at 591,304 SNPs.
We used smartpca69 to perform principal component analysis (PCA) using default parameters, with the settings lsqproject:YES and numoutlier:0. We projected the Roopkund individuals onto two PCA plots designed either to reveal a cline of West Eurasian-related ancestry in South Asian populations18, or to reveal the genetic substructure in present-day West Eurasians13. The first PCA (Fig. 2a) included 1453 present-day populations12 in addition to the Roopkund individuals, while the second PCA (Fig. 2b) included 986 present-day populations13, in addition to the Roopkund individuals and two individuals from present-day Crete (population label Crete.DG). The PCA plots show that the samples cluster into three distinct groups, which we label Roopkund_A, Roopkund_B and Roopkund_C, and treat separately for subsequent analyses.
We used smartpca69 to compute FST between the two major Roopkund groups (Roopkund_A and Roopkund_B) and all other groups composed of at least 2 individuals in the dataset, using default parameters, with the settings inbreed:YES and fstonly:YES.
We performed clustering using ADMIXTURE16. We carried out this analysis on all samples used for the PCA analyses, although we display only selected populations for the sake of clarity. Prior to analysis, SNPs in linkage disequilibrium with one another were pruned in PLINK using the parameters–indep-pairwise 200 25 0.4. We performed an ADMIXTURE analysis on the remaining 344,363 SNPs in the pruned dataset for values of k between 2 and 10, and carried out 20 replicates at each value of k. We retained the highest likelihood replicate at each k and displayed results for k (k = 4), which we chose because we observed that it is most visually helpful for discriminating the ancestry of the groups of interest.
We used qpWave18,19, with default parameters and allsnps:YES, to determine if any of the Roopkund populations was consistent with being a clade with any present-day populations. We included a base set of nine populations in each test, chosen to represent diverse ancestry from throughout the world. We include an additional 5–15 populations of either South Asian, West Eurasian, or Southeast/East Asian ancestry in tests involving Roopkund_A, Roopkund_B and Roopkund_C respectively, chosen to provide additional resolution for each group based on their position in the previous PCA. Based on the observed genetic heterogeneity in the Roopkund_A population, we modeled each individual separately (Supplementary Note 6). For each test, the Left population set included the Roopkund population or individual of interest in addition to one of the selected present-day analysis populations, while the remaining populations were included in the Right population set. In the case of individuals belonging to the Roopkund_A and Roopkund_C groups, we also used qpAdm7, with default parameters and allsnps: YES, to determine whether these populations could be considered to be the product of a two-way admixture between any of the selected present-day populations (Supplementary Note 6). In this case, the Left population set included the Roopkund individual of interest in addition to all possible combinations of two of the selected present-day analysis populations, while the remaining populations were included in the Right population set.
AMS radiocarbon dating
We subjected bone powder from 37 samples to radiocarbon dating. We dated the remaining bone powder (360–750 mg) from the same samples that were processed for ancient DNA. We were unable to generate a radiocarbon date for individual I3401, as there was not enough remaining bone powder for analysis.
At the Pennsylvania State University AMS radiocarbon dating facility, bone collagen for 14C and stable isotope analyses was extracted and purified using a modified Longin method with ultrafiltration70. Samples (200–400 mg) were demineralized for 24–36 h in 0.5 N HCl at 5 °C followed by a brief (<1 h) alkali bath in 0.1 N NaOH at room temperature to remove humates. The residue was rinsed to neutrality in multiple changes of Nanopure H2O, and then gelatinized for 12 h at 60 °C in 0.01 N HCl. The resulting gelatin was lyophilized and weighed to determine percent yield as a first evaluation of the degree of bone collagen preservation. Rehydrated gelatin solution was pipetted into pre-cleaned Centriprep71 ultrafilters (retaining >30 kDa molecular weight gelatin) and centrifuged 3 times for 20 min, diluted with Nanopure H2O and centrifuged 3 more times for 20 min to desalt the solution.
In some instances, collagen samples were too poorly preserved and were pre-treated at Penn State using a modified XAD process72 (Supplementary Data 4 shows that there were no systematic differences in the dates obtained based on the XAD and modified Longin pretreatment extraction methods.) Samples were demineralized in 0.5 N HCl for 2–3 days at 5 °C. The demineralized collagen pseudomorph was gelatinized at 60 °C in 1–2 mL 0.01 N HCl for 8–10 h. The gelatin was then lyophilized and percent gelatinization and yield determined by weight. The sample gelatin was then hydrolyzed in 2 mL 6 N HCl for 24 h at 110 °C. Supelco ENVI-Chrom® SPE (Solid Phase Extraction; Sigma-Aldrich) columns were prepped with 2 washes of methanol (2 mL) and rinsed with 10 mL DI H2O. Supelco ENVIChrom® SPE (Solid Phase Extraction; Sigma-Aldrich) columns with 0.45 µm Millex Durapore filters attached were equilibrated with 50 mL 6 N HCl and the washings discarded. 2 mL collagen hydrolyzate as HCl was pipetted onto the SPE column and driven with an additional 10 mL 6 N HCl dropwise with the syringe into a 20 mm culture tube. The hydrolyzate was finally dried into a viscous syrup by passing UHP N2 gas over the sample heated at 50 °C for ~12 h.
For all bone samples that were subject to radiocarbon dating, carbon and nitrogen concentrations and stable isotope ratios of the ultrafiltered gelatin or XAD amino acid hydrolyzate were measured at the Yale Analytical and Stable Isotope Center with a Costech elemental analyzer (ECS 4010) and Thermo DeltaPlus analyzer. Sample quality was evaluated by percentage crude gelatin yield, %C, %N, and C/N ratios before AMS 14C dating. C/N ratios for all samples fell between 2.9 and 3.6, indicating good collagen preservation73. Samples (~2.1 mg) were then combusted for 3 h at 900 °C in vacuum-sealed quartz tubes with CuO and Ag wires. Sample CO2 was reduced to graphite at 550 °C using H2 and a Fe catalyst, with reaction water drawn off with Mg(ClO4)274.
Graphite samples were pressed into targets in Al boats and loaded on a target wheel with OX-1 (oxalic acid) standards, known-age bone secondaries, and a 14C-free Pleistocene whale blank. 14C measurements were performed at UCIAMS on a modified National Electronics Corporation compact spectrometer with a 0.5 MV accelerator (NEC 1.5SDH-1). The 14C ages were corrected for mass-dependent fractionation with δ13C values75 and compared with samples of Pleistocene whale bone (backgrounds, 48,000 14C BP), late Holocene bison bone (~1850 14C BP), late 1800s CE cow bone and OX-2 oxalic acid standards for calibration. All calibrated 14C ages were computed using OxCal version 4.376 using the IntCal13 northern hemisphere curve77.
Stable isotope measurements
The isotopic measurement procedure at Yale University for the 37 samples for which we performed direct radiocarbon dating are described in the previous section.
We also obtained isotopic measurements for long bone samples from 19 individuals (including data from 11 of the same individuals that were also analyzed at Yale) at the Max Planck Institute for the Science of Human History. Bone samples of 1 g were subsequently cleaned using an air abrasive system with 5 μm aluminum oxide powder and then crushed into chunks. Collagen was extracted following standard procedures78. Approximately 1 g of pre-cleaned bone was demineralized in 10 mL aliquots of 0.5 M HCl at 4 °C, with changes of acid until CO2 stopped evolving. The residue was then rinsed three times in deionized water before being gelatinized in pH 3 HCl at 80 °C for 48 h. The resulting solution was filtered, with the supernatant then freeze-dried over a period of 24 h.
Purified collagen samples (1 mg) were analyzed at the Department of Archaeology, Max Planck Institute for the Science of Human History, in duplicate by EA-IRMS on a ThermoFisher Elemental Analyzer coupled to a ThermoFisher Delta V Advantage Mass Spectrometer via a ConFloIV system. Accuracy was determined by measurements of international standard reference materials within each analytical run. These were USGS 40,40 δ13Craw = −26.4 ± 0.1, δ13Ctrue = −26.4 ± 0.0, δ15Nraw = −4.4 ± 0.1, δ15Ntrue = −4.5 ± 0.2; IAEA N2, δ15Nraw = 20.2 ± 0.1, δ15Ntrue = 20.3 ± 0.2; IAEA C6 δ13Craw = -10.9 ± 0.1, δ13Ctrue = −10.8 ± 0.0. An in-house fish gelatin sample was also used as a standard in each run. Reported δ13C values were measured against Vienna Pee Dee Belemnite (VPDB), while δ15N values are measured against ambient air.
Reporting summary
Further information on research design is available in the Nature Research Reporting Summary linked to this article.
Data availability
The aligned DNA sequences from the 38 individuals are available from the European Nucleotide Archive under accession number PRJEB29537. Genotype files are available at https://reich.hms.harvard.edu/datasets. All other relevant data is available upon request.
References
Bengtsson, L. Ice covered lakes in Encyclopedia of Lakes and Reservoirs. 357–360 (Springer, Dordrecht, 2012).
Pham, B. T., Pradhan, B., Bui, D. T., Prakash, I. & Dholakia, M. A comparative study of different machine learning methods for landslide susceptibility assessment: a case study of Uttarakhand area (India). Environ. Model Softw. 84, 240–250 (2016).
Gupta, S. Tourism in Garhwal Himalaya: Strategy for sustainable development in Domestic tourism in India. 199–218 (Indus Publishing Company, New Delhi, 1998).
Budhwar, K. Where gods dwell: central Himalayan folktales and legends. 19–27 (Penguin Books India, 2010).
“Skeleton Lake”. Riddles of the Dead. Television. (National Geographic, Hoggard Films, 2004).
Fu, Q. et al. An early modern human from Romania with a recent Neanderthal ancestor. Nature 524, 216–219 (2015).
Haak, W. et al. Massive migration from the steppe was a source for Indo-European languages in Europe. Nature 522, 207–211 (2015).
Fu, Q. et al. DNA analysis of an early modern human from Tianyuan Cave, China. Proc. Natl Acad. Sci. USA 110, 2223–2227 (2013).
Mathieson, I. et al. Genome-wide patterns of selection in 230 ancient Eurasians. Nature 528, 499–512 (2015).
Kuhn, J. M. M., Jakobsson, M. & Günther, T. Estimating genetic kin relationships in prehistoric populations. PLoS ONE 13, e0195491 (2018).
Herbig, A. et al. MALT: Fast alignment and analysis of metagenomic DNA sequence data applied to the Tyrolean Iceman. Preprint at https://www.biorxiv.org/content/10.1101/050559v050551 (2016).
Nakatsuka, N. et al. The promise of discovering population-specific disease-associated genes in South Asia. Nat. Genet. 49, 1403–1407 (2017).
Lazaridis, I. et al. Genomic insights into the origin of farming in the ancient Near East. Nature 536, 419–424 (2016).
Broushaki, F. et al. Early Neolithic genomes from the eastern Fertile Crescent. Science 353, 499–503 (2016).
Lazaridis, I. et al. Genetic origins of the Minoans and Mycenaeans. Nature 548, 214–218 (2017).
Alexander, D. H., Novembre, J. & Lange, K. Fast model-based estimation of ancestry in unrelated individuals. Genome Res. 19, 1655–1664 (2009).
Hedges, R. E., Clement, J. G., Thomas, C. D. L. & O’Connell, T. C. Collagen turnover in the adult femoral mid‐shaft: Modeled from anthropogenic radiocarbon tracer measurements. Am. J. Phys. Anthropol. 133, 808–816 (2007).
Moorjani, P. et al. Genetic evidence for recent population mixture in India. Am. J. Hum. Genet. 93, 422–438 (2013).
Reich, D. et al. Reconstructing native American population history. Nature 488, 370–374 (2012).
Sax, W. From Procession to Heritage: The Royal Procession of the Goddess Shri Nanda in Prozessionen, Wallfahrten, Aufmärsche: Bewegung zwischen Religion und Politik in Europa und Asien seit dem Mittelalter 4, 277–287 (Böhlau Verlag, Köln, 2008).
Hellenthal, G. et al. A genetic atlas of human admixture history. Science 343, 747–751 (2014).
Cooper, A. & Poinar, H. N. Ancient DNA: do it right or not at all. Science 289, 1139–1139 (2000).
Dabney, J. et al. Complete mitochondrial genome sequence of a Middle Pleistocene cave bear reconstructed from ultrashort DNA fragments. Proc. Natl Acad. Sci. USA 110, 15758–15763 (2013).
Korlević, P. et al. Reducing microbial and human contamination in DNA extractions from ancient bones and teeth. Biotechniques 59, 87–93 (2015).
Rohland, N., Harney, E., Mallick, S., Nordenfelt, S. & Reich, D. Partial uracil–DNA–glycosylase treatment for screening of ancient. Dna. Philos. Trans. R. Soc. B 370, 20130624 (2015).
Maricic, T., Whitten, M. & Pääbo, S. Multiplexed DNA sequence capture of mitochondrial genomes using PCR products. PLoS ONE 5, e14004 (2010).
Behar, D. M. et al. A “Copernican” reassessment of the human mitochondrial DNA tree from its root. Am. J. Hum. Genet. 90, 675–684 (2012).
Li, H. & Durbin, R. Fast and accurate short read alignment with Burrows–Wheeler transform. Bioinformatics 25, 1754–1760 (2009).
Korneliussen, T. S., Albrechtsen, A. & Nielsen, R. ANGSD: analysis of next generation sequencing data. BMC Bioinforma. 15, 356 (2014).
Weissensteiner, H. et al. HaploGrep 2: mitochondrial haplogroup classification in the era of high-throughput sequencing. Nucleic Acids Res. 44, W58–W63 (2016).
Poznik, G. D. et al. Punctuated bursts in human male demography inferred from 1,244 worldwide Y-chromosome sequences. Nat. Genet. 48, 593 (2016).
Allentoft, M. E. et al. Population genomics of bronze age Eurasia. Nature 522, 167–172 (2015).
de Barros Damgaard, P. et al. 137 ancient human genomes from across the Eurasian steppes. Nature 557, 369 (2018).
de Barros Damgaard, P. et al. The first horse herders and the impact of early Bronze Age steppe expansions into Asia. Science 360, eaar7711 (2018).
Fu, Q. et al. Genome sequence of a 45,000-year-old modern human from western Siberia. Nature 514, 445–449 (2014).
Fu, Q. et al. The genetic history of ice age Europe. Nature 534, 200 (2016).
Haber, M. et al. Continuity and admixture in the last five millennia of Levantine history from ancient Canaanite and present-day Lebanese genome sequences. Am. J. Hum. Genet. 101, 274–282 (2017).
Jeong, C. et al. Long-term genetic stability and a high-altitude East Asian origin for the peoples of the high valleys of the Himalayan arc. Proc. Natl Acad. Sci USA 113, 7485–7490 (2016).
Jones, E. R. et al. Upper Palaeolithic genomes reveal deep roots of modern Eurasians. Nat. Commun. 6, 8912 (2015).
Jones, E. R. et al. The Neolithic transition in the Baltic was not driven by admixture with early European farmers. Curr. Biol. 27, 576–582 (2017).
Lazaridis, I. et al. Ancient human genomes suggest three ancestral populations for present-day Europeans. Nature 513, 409–413 (2014).
Lipson, M. et al. Parallel palaeogenomic transects reveal complex genetic history of early European farmers. Nature 551, 368 (2017).
Llorente, M. G. et al. Ancient Ethiopian genome reveals extensive Eurasian admixture in Eastern Africa. Science 350, 820–822 (2015).
Malaspinas, A.-S. et al. Two ancient human genomes reveal Polynesian ancestry among the indigenous Botocudos of Brazil. Curr. Biol. 24, R1035–R1037 (2014).
Martiniano, R. et al. Genomic signals of migration and continuity in Britain before the Anglo-Saxons. Nat. Commun. 7, 10326 (2016).
Mathieson, I. et al. The genomic history of southeastern Europe. Nature 555, 197 (2018).
Meyer, M. et al. A high-coverage genome sequence from an archaic Denisovan individual. Science 338, 222–226 (2012).
Mittnik, A. et al. The genetic prehistory of the Baltic Sea region. Nat. Commun. 9, 442 (2018).
Olalde, I. et al. Derived immune and ancestral pigmentation alleles in a 7,000-year-old Mesolithic European. Nature 507, 225 (2014).
Olalde, I. et al. The Beaker phenomenon and the genomic transformation of northwest Europe. Nature 555, 190 (2018).
Prüfer, K. et al. The complete genome sequence of a Neanderthal from the Altai Mountains. Nature 505, 43 (2014).
Raghavan, M. et al. Upper Palaeolithic Siberian genome reveals dual ancestry of Native Americans. Nature 505, 87 (2014).
Raghavan, M. et al. Genomic evidence for the Pleistocene and recent population history of Native Americans. Science 349, aab3884 (2015).
Rasmussen, S. et al. Early divergent strains of Yersinia pestis in Eurasia 5,000 years ago. Cell 163, 571–582 (2015).
Schiffels, S. et al. Iron age and Anglo-Saxon genomes from East England reveal British migration history. Nat. Commun. 7, 10408 (2016).
Schuenemann, V. J. et al. Ancient Egyptian mummy genomes suggest an increase of Sub-Saharan African ancestry in post-Roman periods. Nat. Commun. 8, 15694 (2017).
Skoglund, P. et al. Genetic evidence for two founding populations of the Americas. Nature 525, 104 (2015).
Skoglund, P. et al. Genomic insights into the peopling of the Southwest Pacific. Nature 538, 510 (2016).
Skoglund, P. et al. Reconstructing prehistoric African population structure. Cell 171, 59–71. e21 (2017).
Veeramah, K. R. et al. Population genomic analysis of elongated skulls reveals extensive female-biased immigration in Early Medieval Bavaria. Proc. Natl Acad. Sci. USA 115, 3494–3499 (2018).
Harney, É. et al. Ancient DNA from Chalcolithic Israel reveals the role of population mixture in cultural transformation. Nat. Commun. 9, 3336 (2018).
1000 Genomes Project Consortium. A global reference for human genetic variation. Nature 526, 68 (2015).
Mallick, S. et al. The Simons genome diversity project: 300 genomes from 142 diverse populations. Nature 538, 201 (2016).
Mondal, M. et al. Genomic analysis of Andamanese provides insights into ancient human migration into Asia and adaptation. Nat. Genet. 48, 1066–1070 (2016).
Patterson, N. et al. Ancient admixture in human history. Genetics 192, 1065–1093 (2012).
Pickrell, J. K. et al. The genetic prehistory of southern Africa. Nat. Commun. 3, 1143 (2012).
Qin, P. & Stoneking, M. Denisovan ancestry in East Eurasian and native American populations. Mol. Biol. Evol. 32, 2665–2674 (2015).
Vyas, D. N., Al‐Meeri, A. & Mulligan, C. J. Testing support for the northern and southern dispersal routes out of Africa: an analysis of Levantine and southern Arabian populations. Am. J. Phys. Anthropol. 164, 736–749 (2017).
Patterson, N., Price, A. L. & Reich, D. Population structure and eigenanalysis. PLoS Genet. 2, e190 (2006).
Kennett, D. J. et al. Archaeogenomic evidence reveals prehistoric matrilineal dynasty. Nat. Commun. 8, 14115 (2017).
McClure, S. B., Puchol, O. G. & Culleton, B. J. AMS dating of human bone from Cova de la Pastora: new evidence of ritual continuity in the prehistory of eastern Spain. Radiocarbon 52, 25–32 (2010).
Lohse, J. C., Culleton, B. J., Black, S. L. & Kennett, D. J. A precise chronology of middle to late Holocene Bison exploitation in the Far Southern Great Plains. J. Tex. Archeol. Hist. 1, 94–126 (2014).
Van Klinken, G. J. Bone collagen quality indicators for palaeodietary and radiocarbon measurements. J. Archaeol. Sci. 26, 687–695 (1999).
Santos, G. M., Southon, J. R., Druffel-Rodriguez, K. C., Griffin, S. & Mazon, M. Magnesium perchlorate as an alternative water trap in AMS graphite sample preparation: a report on sample preparation at KCCAMS at the University of California, Irvine. Radiocarbon 46, 165–173 (2004).
Stuiver, M. & Polach, H. A. Discussion reporting of 14 C data. Radiocarbon 19, 355–363 (1977).
Ramsey, C. B. & Lee, S. Recent and planned developments of the program OxCal. Radiocarbon 55, 720–730 (2013).
Reimer, P. J. et al. IntCal13 and Marine13 radiocarbon age calibration curves 0–50,000 years cal BP. Radiocarbon 55, 1869–1887 (2013).
Richards, M. P. & Hedges, R. E. Stable isotope evidence for similarities in the types of marine foods used by Late Mesolithic humans at sites along the Atlantic coast of Europe. J. Archaeol. Sci. 26, 717–722 (1999).
Acknowledgements
We acknowledge the people living and dead whose samples we analyzed in this study. We thank Professor Subhash Walimbe of the Deccan College Post-Graduate and Research Institute in Pune India (retired) who prepared the physical anthropology report on the Roopkund skeletons that was used as the basis of a National Geographic documentary; we reprint it in edited form in Supplementary Note 2, updated in light of the genetic findings. We are grateful to Dr. Lalji Singh (deceased) for his longstanding support for this project, to the Lucknow University anthropology department and the Anthroplogical Survey of India for permission to analyze their skeletal collection, and to Iosif Lazaridis, Michael McCormick, Arie Shaus, John Wakeley for critical comments. E.H. was supported by a graduate student fellowship from the Max Planck-Harvard Research Center for the Archaeoscience of the Ancient Mediterranean (MHAAM). A.N., P.R., and N.B. are funded by the Max Planck Society. D.J.K. and B.J.C. were supported by NSF BCS-1460367. K.T. was supported by grant NCP (MLP0117) from the Council of Scientific and Industrial Research (CSIR), Government of India. D.R. was supported by the U.S. National Science Foundation HOMINID grant BCS-1032255, the U.S. National Institutes of Health grant GM100233, by an Allen Discovery Center grant, by grant 61220 from the John Templeton Foundation, and is an investigator of the Howard Hughes Medical Institute.
Author information
Authors and Affiliations
Contributions
N.B., K.T., D.R., and N.Ra. conceived the study. N.Ro., D.R., and K.T. supervised the ancient DNA work and analysis of DNA from modern population samples. P.J., H., M.S.B., and V.M.-T. collected the archaeological samples. S.C.D. and S.K. collected blood samples from present-day Indian populations. J.S. assisted with interpretations of archaeological background and isotopic data. N.Ro., N.A., R.B., M.F., M.M., J.O. and K.S. performed or supervised wet laboratory work. S.M. and Z.Z. performed bioinformatics analyses. A.N. performed the sampling, pretreatment, and interpretation for the stable isotope analysis under the supervision of P.R., N.Ra., and N.B. D.J.K., B.J.C. and T.K.H. supervised or performed the AMS radiocarbon dating analysis. E.H. performed statistical analyses, with guidance from N.P. and D.R. The paper was written by E.H., D.R., and N.Ra. with input from all coauthors.
Corresponding author
Ethics declarations
Competing interests
The authors declare no competing interests.
Additional information
Peer review information: Nature Communications thanks Carles Lalueza-Fox and other anonymous reviewer(s) for their contribution to the peer review of this work. Peer reviewer reports are available.
Publisher’s note: Springer Nature remains neutral with regard to jurisdictional claims in published maps and institutional affiliations.
Supplementary information
Rights and permissions
Open Access This article is licensed under a Creative Commons Attribution 4.0 International License, which permits use, sharing, adaptation, distribution and reproduction in any medium or format, as long as you give appropriate credit to the original author(s) and the source, provide a link to the Creative Commons license, and indicate if changes were made. The images or other third party material in this article are included in the article’s Creative Commons license, unless indicated otherwise in a credit line to the material. If material is not included in the article’s Creative Commons license and your intended use is not permitted by statutory regulation or exceeds the permitted use, you will need to obtain permission directly from the copyright holder. To view a copy of this license, visit http://creativecommons.org/licenses/by/4.0/.
About this article

Cite this article
Harney, É., Nayak, A., Patterson, N. et al. Ancient DNA from the skeletons of Roopkund Lake reveals Mediterranean migrants in India. Nat Commun 10, 3670 (2019). https://doi.org/10.1038/s41467-019-11357-9
Received:
Accepted:
Published:
DOI: https://doi.org/10.1038/s41467-019-11357-9
This article is cited by
-
The Allen Ancient DNA Resource (AADR) a curated compendium of ancient human genomes
Scientific Data (2024)
-
correctKin: an optimized method to infer relatedness up to the 4th degree from low-coverage ancient human genomes
Genome Biology (2023)
-
Validation of whole genome sequencing from dried blood spots
BMC Medical Genomics (2021)
-
Origin of ethnic groups, linguistic families, and civilizations in China viewed from the Y chromosome
Molecular Genetics and Genomics (2021)
-
Beyond broad strokes: sociocultural insights from the study of ancient genomes
Nature Reviews Genetics (2020)
Comments
By submitting a comment you agree to abide by our Terms and Community Guidelines. If you find something abusive or that does not comply with our terms or guidelines please flag it as inappropriate.
