
Abstract
Purpose
Absence of heterozygosity (AOH) is a genetic characteristic known to cause human genetic disorders through autosomal recessive or imprinting mechanisms. However, the analysis of AOH via low-pass genome sequencing (GS) is not yet clinically available.
Methods
Low-pass GS (fourfold) with different types of libraries was performed on 17 clinical samples with previously ascertained AOH by chromosomal microarray analysis (CMA). In addition, AOH detection was performed with low-pass GS data in 1,639 cases that had both GS and high-probe density CMA data available from the 1000 Genomes Project. Cases with multiple AOHs (coefficient of inbreeding F ≥ 1/32) or terminal AOHs ≥5 Mb (suspected uniparental disomy [UPD]) were reported based on the guidelines of the American College of Medical Genetics and Genomics.
Results
Low-pass GS revealed suspected segmental UPD and multiple AOHs (F ≥ 1/32) in nine and eight clinical cases, respectively, consistent with CMA. Among the 1,639 samples, low-pass GS not only consistently detected multiple AOHs (F ≥ 1/32) in 18 cases, but also reported 60 terminal AOHs in 44 cases including four mosaic AOHs at a level ranging from 50% to 75%.
Conclusion
Overall, our study demonstrates the feasibility of AOH analysis (≥5 Mb) with low-pass GS data and shows high concordance compared with CMA.
INTRODUCTION
Absence of heterozygosity (AOH) is a well-recognized genomic change by which heterozygous alleles are absent rendering the sequence effectively homozygous. This homozygosity can result in human diseases including congenital1 and somatic disorders2,3 due to absence of wild-type alleles or biparental expression of an imprinted region. Although AOH can be a result of heterozygous or hemizygous deletions in the diploid genome, it can commonly manifest as copy-number neutral events that are also known as runs of homozygosity (ROH) or long contiguous stretches of homozygosity.4 They can be caused by parental consanguinity (identity-by-descent),5 mitotic recombination errors (such as mosaic uniparental isodisomy),6 meiotic segregation errors (such as germline uniparental disomy [UPD])7 or replication-based mechanisms underlying complex chromosomal rearrangements.8 The incidence of human diseases caused by imprinted gene(s) through UPD is estimated to be 1 in 3,500 to 5,000 live births,9 commonly involving chromosomes 6, 7, 11, 14, 15, or 20. For instance, ~25% of cases with Prader–Willi syndrome (OMIM 176270) are caused by maternal UPD of chromosome 1510 including uniparental isodisomy (iUPD; with AOH) or heterodisomy (hUPD, without AOH). Owing to meiotic recombination, UPD often presents as mixed UPD (mixUPD) including both isodisomic and heterodisomic regions, with either a noncentromeric (meiosis I error) or centromeric (meiosis II error) region of AOH.11 In contrast, a segmental UPD (segUPD) could be the consequence of chromosomal imbalance through mitotic recombination.11 Recent studies demonstrate that genome-wide UPD can occur with an overall prevalence as high as 1 in 176 among patients with developmental delay,12 1 in 160 among prenatal cases,13 1 in 234 among spontaneous abortuses,14 but lower in the general population at 1 in 2,000 live births.15 The clinical significance of AOH include imprinting related disorders as well as considerations of autosomal recessive disease mechanisms.5 Therefore, a method for genome-wide investigation of AOH is warranted to determine its potential clinical implications and etiologies of UPD/consanguinity.
In genetic diagnostic laboratories, chromosomal microarray analysis (CMA) with single-nucleotide polymorphism (SNP) probes is the gold standard method16 for the detection of AOH. Reflex testing with short tandem repeat (STR) markers and methylation analyses are warranted for confirmation of UPD and for parental origin assignment. Currently, the size cutoff for reporting regions of AOH is 5 Mb for identification of whole-chromosome or segmental UPD as recommended by the American College of Medical Genetics and Genomics (ACMG).16 It is also important to consider the size and location of the AOH and whether the chromosome affected is subject to imprinting. Although most SNP-based CMA assays are capable of detecting genome-wide AOH, the resolution of detection will vary depending on the probe density within the platform and specifically within the particular region being examined; typically a resolution of 2~3 Mb can be reproducibly obtained with a high-resolution SNP array.17 Currently, clinical GS approaches are widely used in the context of low-pass (low-coverage and high-throughput) GS (<5-fold), both for the detection of copy-number variants (CNVs)18,19,20 with improved resolution and for chromosomal structural rearrangements,21,22,23,24 which is superior to that of routine CMA. GS in a low-pass setting is capable of detecting limited genotyping information that is potentially furthermore applicable for AOH detection. Evaluation of the AOH detection accuracy by low-pass GS compared with CMA is a requisite for its clinical application in comprehensive detection of CNVs, structural variants (SVs) and AOHs. Recently, two studies showed the detection of AOH/UPD using GS data by visualizing B-allele frequencies; however, critical parameters as well the performance of detection were not described.25,26 In addition, the detection of AOH by low-pass GS is not widely in practice. Particularly, current clinical GS applications utilize a variety of platforms with different library construction methods (such as small insert25 or mate-pair23). Therefore, a systematic evaluation of AOH detection by low-pass GS is warranted.
To study the feasibility and concordance of AOH detection with low-pass GS compared with the current gold standard CMA, we applied our in-house AOH detection method on 17 clinical samples with previously ascertained AOH by routine CMA and 1,639 cases with both GS and high probe density CMA data available from the commonly referenced 1000 Genomes Project (1KGP). We also investigate the spectrum of AOH in the 1KGP, which has not been reported previously.
MATERIALS AND METHODS
Case recruitment
Low-pass GS was performed on 19 DNA samples retrieved from 17 prenatal/postnatal cases (chorionic villus sampling [CVS], amniotic fluid [AF], cord blood [CB], or peripheral blood [PB]) with a positive finding of AOH/UPD by CMA (Table 1 and Supplementary Table S1). Among them, one case had three samples available (CVS [sample ID 18C1493], AF [18C1564], and CB [aCGH15274]). Parental DNA samples were also obtained in six cases (Table 1).
Chromosomal microarray analysis and verification of parental inheritance
A well-established customized CMA 8X60k Fetal DNA Chip v2.0 (Agilent Technologies, Santa Clara, CA), containing both SNP and comparative genomic hybridization (CGH) probes20 was used. CNV and AOH analyses were evaluated with CytoGenomics (Agilent). The parental origin of UPD was confirmed by quantitative fluorescent polymerase chain reaction (QF-PCR) with STR markers selected from the University of California–Santa Cruz (UCSC) Genome Browser as previously described.27
Low-pass GS
For small-insert size libraries, genomic DNA was sheared (300~500 bp) with the Covaris E220 Evolution Focused-Ultrasonicator (Covaris, Inc., Woburn, MA) and subjected to library construction using the MGIEasy FS DNA Library Prep kit according to the manufacturer’s protocol. Libraries were pooled and sequenced to paired-end 100 bp with a read depth of ~4-fold for each sample on an MGISEQ-2000 platform (MGI Tech Co., Ltd, Shenzhen, China).
For mate-pair libraries, 1 μg of genomic DNA was sheared (3~8 kb) by a HydroShear device (Digilab, Inc., Hopkinton, MA),22 and subjected to library construction as previously described (Supplementary methods).28 Samples were pooled and sequenced on an MGISEQ-2000 platform (MGI) for a read depth of ~4-fold (paired-end 100 bp) for each sample.
AOH and CNV analysis
After quality control (QC) assessment, the read/read-pairs were aligned to the human reference genome (GRCh37/hg19) by Burrows–Wheeler Aligner (BWA).29 With SAMtools,30 the alignment file was reformatted, reads due to PCR duplication were removed, and the coverage of each genomic location summarized. SNVs with a read depth of 5- to 20-fold with read(s) supporting a variant base type (or B-allele, Supplementary Fig. S1) were selected for AOH analysis (Supplementary methods and Fig. S2).
-
1.
Defining B-allele frequency (BAF): Variant allele fraction (VAF) was calculated as the number of reads supporting the mutant base type divided by the total number of reads at the locus. SNVs were classified into three categories based on the VAF: (1) homozygous SNV (B allele), (2) diploid heterozygous SNV (AB allele), and (3) nondiploid heterozygous SNV (AAB/ABB allele). For each category, the rates of SNVs in 100-kb fixed genomic windows were calculated and normalized by (1) the average rate among all windows in this case and (2) the average rate among the datasets with similar read depth in the particular window.
-
2.
Identification of candidate AOH and refinement of the precise boundaries: Regions with AOH are indicated by a simultaneous decrease in the rate of heterozygous SNVs and increase in the rate of homozygous SNVs (Supplementary Figs. S1 and S3). Thus, candidate AOH regions are reported based on a combination of parameters: (1) at least five consecutive sliding windows with normalized rates of heterozygous SNVs <1 (500 kb); and (2) within this region, at least 25% of the windows have normalized rates of homozygous SNVs >1.25. Precise boundaries of the candidate AOH regions were determined using a combination of normalized rates of heterozygous/homozygous SNVs with nonoverlapping windows (100 kb). Constitutional AOH represents germline abnormalities that are present in all cells, whereas mosaic AOH is defined as AOH present in only a proportion of cells. The level of mosaicism was determined by the difference of the average rate of heterozygous SNVs from 1. For instance, an average rate of heterozygous SNVs of 0.2 in a region would equate to 80% mosaicism of AOH. Due to the deviation of rate of heterozygosity across the genome (approximately 0.1), regions with average rates of heterozygous SNVs ≤0.1 would be regarded as constitutional AOH (which equates to a mosaic level of ≥90%).
-
3.
Individual CNV annotation and interpretation: Fig. 1 shows a case with AOH regions (≥5 Mb) (Table 1) reported. Classification of AOH was based on the ACMG guidelines.16 For instance, cases with multiple AOHs (coefficient of inbreeding F ≥ 1/32)5 or suspected whole-chromosome or segmental UPD (e.g., terminal AOH ≥ 5 Mb)16 were reported.
Fig. 1: Absence of heterozygosity (AOH) detected in an amniotic fluid (AF) sample with uniparental disomy (UPD)(6). 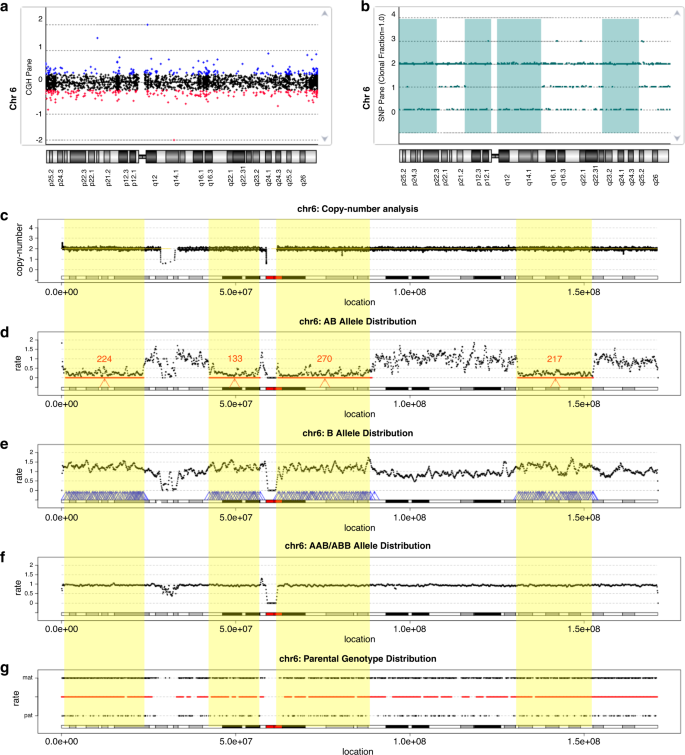
Distribution of copy ratio (log2) (a) and genotype (b) reported by chromosomal microarray (CMA). The X-axis indicates the genomic location in (a) and (b). The Y-axis in (a) shows the log2 copy ratio, while the Y-axis in (b) shows the distribution of different numbers of genotypes: 0, 1, 2, and 3 indicate the genotype as AA allele, AB, BB, and AAB/ABB, respectively. In (a), each point represents a probe; the copy ratios classified as gain, neutral, or loss are shown in blue, black, and red, respectively. In (b), each genotype is shown as a green point and the regions with AOH reported are highlighted in green. (c) Copy-number distribution reported by low-pass genome sequencing (GS) are indicated by black points. The X-axis in (c–g) indicates genomic locations across chromosome 6, while in (c), the Y-axis represents the copy number. (d–f) Distribution of rates of diploid heterozygous single-nucleotide variants (SNVs) (AB allele), homozygous SNVs (B allele), and nondiploid heterozygous SNVs (AAB/ABB allele), respectively. (d) The candidate AOH regions detected are indicated by red arrows and the number of windows that support the AOH is shown in red (e) Windows with increased rate of homozygous SNVs within regions reported in (d) are shown by blue arrows. (f) Windows with increased rate of nondiploid heterozygous SNVs are shown by blue arrows. Regions with AOHs (≥5 Mb) are highlighted in yellow. In (g), the Y-axis shows the rate of maternally inherited genotypes at the top and paternally inherited genotypes at the bottom. The color of the horizontal line in the middle indicates the excess of maternally or paternally inherited genotypes; red if the ratios of maternal/paternal genotypes are >5 and blue if the rates are <0.2. In this case, UPD of the entire chromosome 6 is of maternal origin.

CNV detection was conducted as described in our previous studies (see Supplementary methods).19,20,31 CNV analysis results were used for the determination of copy-number status of candidate AOH region(s).
Determination of parental inheritance
Parental low-pass GS results were available in six cases. SNV detection was performed for each parent. Loci for parents who were homozygous for different alleles were selected to calculate the ratio of maternally and paternally inherited SNVs in fixed 1-Mb windows. Regions with ratios >5 indicate maternal isodisomy or heterodisomy (the homozygous SNVs in the proband were consistent with the ones in the mother), while regions with rates <0.2 indicate paternal inheritance.
Validation of AOH detection with low-pass GS in the 1KGP
In the 1KGP, 1,639 cases with both high density SNP-based CMA and high read depth GS data available were further selected for analysis (genome sequencing data were generated by the New York Genome Center; unpublished data, https://doi.org/10.1101/2021.02.06.430068). To obtain fourfold read depth GS data for each sample, 40 million read-pairs were randomly selected,22 and subjected to AOH analysis based on the method described above. The AOH detection calls from CMA (see Supplementary methods) and low-pass GS data were generated independently and blinded to the results of the other method. SNV call sets generated from original high read depth GS data were used to solve potential differences of AOH detection between the two platforms (Fig. 2).

Mosaic terminal AOH regions were identified in case HG00281 (seq[GRCh38] chr7:g.41421_41469920) with 50% mosaic level (a) and in case NA19462 (seq[GRCh38] chr1:g.753806_20897760) with 20% mosaic level (b). In each figure, five panels show (i) the distributions of B-allele frequency reported by chromosomal microarray analysis (CMA) with the regions of AOHs highlighted in light red, (ii) distributions of logR ratio detected by CMA, (iii) distributions of variant allele frequency (VAF) of single-nucleotide variants identified by high read depth genome sequencing (GS), (iv) distributions of the normalized rates of heterozygous SNVs (NRGi, indicated by blue dots), homozygous single-nucleotide variants (SNVs) (NRHi, red dots), and (v) nondiploid heterozygous SNVs reported by low-pass GS with the region of AOH highlighted in yellow.
RESULTS
Validation of AOH analysis with clinical cases with known AOH/UPD
First, we generated low-pass GS data with both small-insert and mate-pair libraries for two cases (16C0836 and 17C1176) with constitutional and mosaic AOH previously reported by CMA. In addition, data simulation was performed to generate low-pass GS data with different sequencing modes (single-end or paired-end), read lengths, and read amounts (see Supplementary methods). After comparing the AOH regions reported by CMA, results indicated the minimal read depth of low-pass GS for AOH analysis was as low as fourfold regardless of sequencing parameters and library construction methods (Supplementary Table S1 and Figs. S4–S6).
We further applied low-pass GS to 17 samples in which constitutional or mosaic AOH were previously detected by CMA (Table 1). Among them, fourfold GS with small-insert libraries was performed on ten samples and fourfold GS with mate-pair libraries was performed on seven samples, respectively. In addition, parental DNA were available in eight samples. The same library construction method was performed on parental DNA respective to the proband to determine the parental inheritance and contribution to AOH/UPD.
Among the 17 samples, multiple regions of AOH were detected by low-pass GS in eight (fetuses of consanguineous couples) and UPD in nine samples (Table 1). Four of the nine samples had UPD in conjunction with mosaic trisomies (Table 1). AOH detected by low-pass GS (with both library constructions) at a resolution of 5 Mb (Fig. 1 and Supplementary Fig. S7) were consistent with previous CMA results (Table 1). Among cases with mosaic AOH, the mosaic level was estimated by the average rate of heterozygous SNVs, which showed a strong correlation with the mosaic level of the trisomy. For example, in case 18C1493 (CVS sample) with right multicystic dysplastic kidney by fetal ultrasound screening, five mosaic AOHs were detected on chromosome 6 with an average mosaic level of 45%, while the mosaic level of trisomy 6 was estimated as 40% by CNV analysis (Supplementary Fig. S4). In addition, the sizes of these mosaic AOHs were consistent with constitutional AOHs reported in the AF sample (18C1564, Fig. 1) and the cord blood sample (aCGH15274, Supplementary Fig. S9) from the same case.
In addition, among six cases with parental DNA available, three were confirmed with maternal UPD by low-pass GS, consistent with previous STR analysis (shown in Fig. 1). The three remaining cases had AOH detected across multiple chromosomes.
Evaluation of GS: AOH in the 1KGP
In the 1KGP dataset, among the 2,504 cases with high read depth GS, high-density CMA data were available in 1,639 cases (65.5%). Overall, 663 AOH regions were called using default parameters (≥5 Mb) of the CMA analysis platform. We adjusted the call set to 867 AOH regions (413 samples, Table 2 and Supplementary Table S2) by manual inspection of genome-wide B-allele frequency plots of each case. The reasons for adjustment included combination of small AOH regions in close proximity (Supplementary Fig. S10), AOH calls removed with genome build conversion errors (Supplementary Fig. S11), or AOH regions that are not autocalled by GenomeStudio’s default settings (Supplementary Fig. S12). Interestingly, in case NA20509, CMA results indicated a 31.2-Mb terminal AOH arr[GRCh38] 21q11.2q22.3(15469641_46709983)x2 hmz. Low-pass GS did not detect any AOH regions on chromosome 21. Genotyping data from high read depth GS showed an abundance of heterozygous SNVs in this region, supporting the heterozygous state (Supplementary Fig. S13). To investigate further the potential reason for the discrepancy between CMA and GS data, we further retrieved a set of low-pass GS data of NA20509 from 1KGP that were generated in phases 1 to 3 (see Supplementary methods).32,33 As the CMA experiments from the 1KGP were originally conducted for verification of the variants identified from that low-pass GS dataset, the DNA used for the two experiments were likely from the same or similar passage(s) of the cell line. Indeed, AOH detection in this dataset reported a similar terminal AOH on the long arm of chromosome 21 seq[GRCh38] hmz(21)(q21.1q22.3) chr21.g.15000000_46800000hmz, consistent with the original CMA results (Supplementary Fig. S13). Therefore, the inconsistent results between CMA and high-coverage GS in our original analysis potentially resulted from cell culture artifacts that were present in one of the cell passages used for analysis but not the other.34
Low-pass GS identified 957 regions of AOH (≥5 Mb) (Table 2) in the 1KGP data. Among them, 873 AOH regions overlapped with those reported by CMA (≥5 Mb) (Table 2). The overall reported sizes were consistent between the two platforms. The discrepancy of the number of AOH regions was due to several instances of AOH regions being split into subregions by one platform and not the other. For instance, on the short arm of chromosome 1 in case NA19462 (Fig. 2b), low-pass GS reported two AOH regions separated by a 600-kb gap, within which were heterozygous SNVs can be detected by high read depth GS.
Among the 957 regions of AOH, 84 regions ranging from 5 to 8 Mb were detected additionally by low-pass GS and all were interstitial regions (Table 2 and Supplementary Table S3). All additional regions of AOH reported by low-pass GS overlapped with at least 50% of AOH regions reported by CMA (Supplementary Fig. S14). Of note, 70 (83.3%) overlapped with at least 75% of AOH regions reported by CMA, while 50 (59.5%) overlapped with at least 90% of AOH regions reported by CMA.
The spectrum of AOH identified in the 1KGP
The distribution of AOH detected among the 413 cases (21.2%, 413/1,639) with consistent AOH regions identified by both platforms is shown in Fig. 3a,b. More than one region of AOH was found in 152 cases. In 18 of the 152 cases, the overall proportion of the autosomal genome identified that is homozygous was larger than 3.125% (F = 1/32). Five cases with overall proportions larger than 6.25% (F = 1/16) may indicate third-degree or second-degree parental consanguinity (Supplementary Table S3 and Fig. S15). Although further confirmation analysis with parental samples is warranted, parental samples are not available from 1KGP.

(a) Consistent identification of AOH regions between CMA (indicated by orange bars in the inner circle) and low-pass GS (green bars in the outer circle) across the genome when reported size cutoff set as 5 Mb. (b) Additional identification of AOH regions by low-pass GS (indicated by green bars in the outer circle) compared with CMA (orange bars in the inner circle) when reported size cutoff set as 5 Mb. In each bar, the number of AOH regions is shown in log2 scale plus 1. Chromosomal nucleotide positions and bands are shown according to the University of California–Santa Cruz Genome Viewer Table Browser. (c,d) Terminal AOH regions in different resolution cutoffs. Distribution of terminal AOH regions identified on each chromosome, short arm (p) and long arm (q) when AOH detection resolution set at 5 Mb (c) or 15 Mb (d).
There were 60 constitutional and mosaic terminal AOH regions (≥5 Mb) identified in 44 cases (10 cases had more than one terminal region of AOH ≥5 Mb, Supplementary Table S5 and Fig. 3c, d). Fourteen of these terminal AOH regions were larger than 15 Mb and were identified by both platforms. Terminal AOH may be an indication of whole-chromosome or segmental UPD based on the ACMG guideline.16 They involved all chromosomes except chromosome 13. Particularly, there were 21 cases with terminal AOH (≥5 Mb) located on chromosomes associated with imprinted genes (chromosomes 6, 7, 11, 14, 15, and 20). Interestingly, four terminal AOH regions were identified on chromosomes 6, 7, and 20, while six terminal AOH were identified on chromosome 11. Also, one region of terminal AOH was detected on chromosome 14 and two regions of terminal AOH were detected on chromosome 15. Parental samples are warranted for the confirmation of UPD; however, as previously stated above, parental samples are not available from the 1KGP.
In addition, among these terminal regions of AOH, there were four instances of mosaic AOH in copy-number neutral states (mosaic levels ranging from 50% to 75%; Fig. 2, Supplementary Fig. S16, and Table S6), consistently detected by the two platforms.
DISCUSSION
This study was designed to evaluate the feasibility of applying low-pass GS for AOH analysis and the concordance of AOH detection compared with CMA. In both clinical cases (N = 17) and GS data from the 1KGP (N = 1,639), low-pass GS was 100% consistent with CMA analysis for reporting clinically significant constitutional and mosaic AOHs.
We first evaluated the optimal sequencing parameters including read length, read amount, sequencing mode (paired-end or single-end), and two methods of library construction (small insert or mate pair). Our study demonstrates the minimal read depth for AOH analysis to be fourfold regardless of sequencing parameters and library construction methods. By conducting small-insert and mate-pair libraries and sequencing to fourfold for 17 clinical cases with AOHs previously ascertained by CMA (Table 1), low-pass GS consistently reported AOH associated with whole-chromosome or segmental UPD and consanguinity in these cases. Particularly, the parental inheritance of UPD can be determined with integrated analysis using parental low-pass GS data; parental inheritance was previously confirmed by STR analysis (shown in Fig. 1).
To enlarge our sample size, we further evaluated the performance of AOH detection in 1,639 samples with data available for both CMA and high read depth GS. After genome build conversion, some AOH reported by CMA were smaller in size (Supplementary Fig. S10) resulting from conversion errors (Supplementary Fig. S11) or even missed detection by CMA (Supplementary Fig. S12), likely owing to the high density of probes under the default settings. Interestingly, by comparing the distribution of SNP probes and genotyping data from high read depth GS, we identified an inconsistent finding on chromosome 21 of case NA20509 (Supplementary Fig. S13). It is unlikely it resulted in the original construction of the Epstein–Barr virus (EBV)–transformed B lymphoblastoid (EBV-B) cell line, which led to a consistent finding among different passages. Thus, the different findings between two platforms might be due to culture artifacts.34 After refinement of the sizes of AOHs, exclusion of AOHs resulting from conversion errors or inconsistent results between CMA and high read depth GS and inclusion of AOHs missed by the original CMA, the overall number of AOHs (≥5 Mb) identified by CMA platforms was 867 regions from 413 cases (Table 2); all AOHs were also reported by low-pass GS.
In addition, low-pass GS identified 84 additional interstitial AOHs ranging from 5 to 8 Mb, all of which overlapped with smaller regions of AOH called by CMA. Fourteen were due to subsectioning of large AOHs as a result of the presence of small regions (<200 kb) with heterozygous SNVs (Supplementary Fig. S14). Although this limitation can be overcome by increasing read depth to over 30-fold, the cost would increase by at least fivefold, which would hinder large-scale clinical application. Seventy additional low-pass GS AOH findings had smaller AOHs (2.81 to 4.98 Mb) detected by CMA but did not reach the 5 Mb cutoff for CMA automated calling. The additional findings of AOH by low-pass GS can be explained by marginal size differences of AOH detected between the two platforms instead of false positives. Furthermore, all additional AOH regions detected by low-pass GS had >50% overlap with regions showing evidence of AOH on CMA, and most (83.3%, 70/84) overlapped with >75%. Nonetheless, the most recent ACMG document regarding diagnostic testing for UPD suggests an interstitial AOH cutoff of ≥15 Mb to be sufficient,16 none of the additionally reported AOH regions would be considered worthy of follow-up (e.g., STR validation or methylation analysis).
Among the 413 cases (21.2%, 413/1,639) with consistent AOHs identified by both platforms, 18 cases have multiple AOHs resulting in overall homozygous proportions of the autosomal genome of larger than 3.125% (F = 1/32, Supplementary Table S4).5 Five of the 18 cases had overall percentages ≥6.25%, which could indicate third-degree or second-degree parental consanguinity (unable to be confirmed from the 1KGP). Nonetheless, our study identified ~1.1% (18/1,639) cases from potential consanguineous matings. Currently, consanguineous matings are not uncommon and occur in up to 10% of the world’s population (rates ranging from 80.6% in certain provinces in the Middle East to less than 1% in Western societies).35 Therefore, the rate we observed in these 1,639 samples might represent the diverse composition of participants in the 1KGP. In addition, although participants in the 1KGP are ostensibly clinically normal, we cannot exclude potential pathogenicity of SNVs located in autosomal recessive genes in these AOH regions.
Furthermore, among the 413 cases, 60 terminal AOH regions (≥5 Mb) were identified in 44 cases (Supplementary Table S5). Terminal AOH rarely occurs in non-UPD cases, and may warrant reporting and follow-up even when the size is relatively small (5 Mb).16,36 Notably, there were 21 cases with terminal AOH on chromosomes involved with imprinted genes (chromosomes 6, 7, 11, 14, 15, and 20). Constitutional terminal AOHs might be an indication for segmental UPD resulting from meiotic segregation errors.16 In contrast, among these terminal AOHs, there were four mosaic AOH regions in copy-number neutral states (mosaic levels ranging from 50% to 75%) consistently detected by both platforms. Mosaic levels of AOH were calculated using BAF values from CMA. By low-pass GS, the mosaic level is determined by the average rate of heterozygous SNVs instead of genotypes. Although the mosaic level by low-pass GS reflected that of CMA in the four cases with mosaic AOH, they will generally be less precise compared with levels detected by CMA (Supplementary Table S6). Mosaic terminal AOHs would likely result from mitotic recombination errors.16 Although further validation of whole-chromosome or segmental UPD such as STR and methylation analyses is warranted, this is not attainable due to lack of parental samples. Nonetheless, our study detected 60 cases with terminal AOH, providing an estimate of 1 in 27.3 (60/1,639) cases with potential whole-chromosome or segmental UPD, which is significantly higher than previously reported by a large-scale study in a general population (1 in 2,000, Chi-square test P < 0.00001).15 As data from the 1KGP serve as a good standard dataset for estimation of minor allele frequencies, knowing the existence of AOHs in the particular samples might be helpful for accurate interpretation of genomic variants.
In the first phase of this study, 19 DNA samples with a positive finding of AOH/UPD by CMA were retrieved for low-pass GS and AOH analysis. A blinded study with the use of clinical samples with unknown AOH status would be important as a second phase study for translation to clinical application. However, due to the rarity of AOH/UPD identified in clinical genetic studies, a representative comparison requires a large sample size (n > 1,000) with involvement across different chromosomes, which is challenging to collect. In this study, we sought another approach. There were 1,639 samples with both high-density SNP-based CMA and high coverage GS data available in the 1KGP. Furthermore, the landscape of AOH in the 1KGP has not been reported. We used this dataset for parallel detection and comparison of AOH in a blinded setting in the second phase of this study. Nonetheless, a future blinded study with the use of clinical samples with unknown AOH status is still warranted as a translational proposal for clinical use.
Overall, our study shows the feasibility of applying low-pass GS in identification of clinically significant AOHs and demonstrates the high concordance compared with both routine and high-probe density CMA. In the context of prenatal/postnatal genetic testing, AOH detection is highly recommended; however, currently most of the laboratories utilizing low-pass GS are reporting CNVs and/or structural rearrangements. This study demonstrated that the performance of AOH detection by low-pass GS is comparable with CMA. AOH detection should be incorporated and implemented in those laboratories that routinely utilize low-pass GS with a minimum read depth of fourfold in both research and clinical settings. In general, low-pass GS with AOH detection could be offered to fetuses or individuals for UPD testing.16 For fetuses or individuals with a suspected genetic etiology of imprinting disorders (e.g., intrauterine growth restriction in Russell–Silver syndrome) or consanguineous mating, low-pass GS with AOH detection would also be applicable. Low-pass GS is being widely used for the detection of structural rearrangements and CNVs,37,38 incorporating AOH analysis will expand its scope of detection of chromosomal abnormalities, and is superior to the current gold standard G-banded chromosome analysis and CMA.
Data availability
Genome sequencing data used in this study have been made available in the CNGB Nucleotide Sequence Archive (CNSA: https://db.cngb.org/cnsa/) under the accession number CNP0000558.
Code availability
All programs relevant to this pipeline are available at https://sourceforge.net/projects/lpgsaoh/files/.
References
Liu, S. et al. Uniparental disomy of chromosome 15 in two cases by chromosome microarray: a lesson worth thinking. Cytogenet. Genome Res. 152, 1–8 (2017).
Margraf, R. L. et al. Utilization of whole-exome next-generation sequencing variant read frequency for detection of lesion-specific, somatic loss of heterozygosity in a neurofibromatosis type 1 cohort with tibial pseudarthrosis. J. Mol. Diagn. 19, 468–474 (2017).
Liu, X., Li, A., Xi, J., Feng, H. & Wang, M. Detection of copy number variants and loss of heterozygosity from impure tumor samples using whole exome sequencing data. Oncol. Lett. 16, 4713–4720 (2018).
D’Amours, G. et al. SNP arrays: comparing diagnostic yields for four platforms in children with developmental delay. BMC Med. Genomics 7, 70 (2014).
Rehder, C. W. et al. American College of Medical Genetics and Genomics: standards and guidelines for documenting suspected consanguinity as an incidental finding of genomic testing. Genet. Med. 15, 150–152 (2013).
Cooper, W. N., Curley, R., Macdonald, F. & Maher, E. R. Mitotic recombination and uniparental disomy in Beckwith-Wiedemann syndrome. Genomics. 89, 613–617 (2007).
Potapova, T. & Gorbsky, G. J. The consequences of chromosome segregation errors in mitosis and meiosis. Biology (Basel). 6, 12 (2017).
Carvalho, C. M. et al. Absence of heterozygosity due to template switching during replicative rearrangements. Am. J. Hum. Genet. 96, 555–564 (2015).
Robinson, W. P. Mechanisms leading to uniparental disomy and their clinical consequences. Bioessays. 22, 452–459 (2000).
Conlin, L. K. et al. Mechanisms of mosaicism, chimerism and uniparental disomy identified by single nucleotide polymorphism array analysis. Hum. Mol. Genet. 19, 1263–1275 (2010).
Yauy, K., de Leeuw, N., Yntema, H. G., Pfundt, R. & Gilissen, C. Accurate detection of clinically relevant uniparental disomy from exome sequencing data. Genet. Med. 22, 803–808 (2020).
King, D. A. et al. A novel method for detecting uniparental disomy from trio genotypes identifies a significant excess in children with developmental disorders. Genome Res 24, 673–687 (2014).
Sensi, A. et al. Nonhomologous Robertsonian translocations (NHRTs) and uniparental disomy (UPD) risk: an Italian multicentric prenatal survey. Prenat. Diagn. 24, 647–652 (2004).
Wang, B. T. et al. Abnormalities in spontaneous abortions detected by G-banding and chromosomal microarray analysis (CMA) at a national reference laboratory. Mol. Cytogenet. 7, 33 (2014).
Nakka, P. et al. Characterization of prevalence and health consequences of uniparental disomy in four million individuals from the general population. Am. J. Hum. Genet. 105, 921–932 (2019).
Del Gaudio, D. et al. Diagnostic testing for uniparental disomy: a points to consider statement from the American College of Medical Genetics and Genomics (ACMG). Genet. Med. 22, 1133–1141 (2020).
Wiszniewska, J. et al. Combined array CGH plus SNP genome analyses in a single assay for optimized clinical testing. Eur. J. Hum. Genet. 22, 79–87 (2014).
Liang, D. et al. Copy number variation sequencing for comprehensive diagnosis of chromosome disease syndromes. J. Mol. Diagn. 16, 519–526 (2014).
Dong, Z. et al. Low-pass whole-genome sequencing in clinical cytogenetics: a validated approach. Genet. Med. 18, 940–948 (2016).
Wang, H. et al. Low-pass genome sequencing versus chromosomal microarray analysis: implementation in prenatal diagnosis. Genet. Med. 22, 500–510 (2020).
Dong, Z. et al. Identification of balanced chromosomal rearrangements previously unknown among participants in the 1000 Genomes Project: implications for interpretation of structural variation in genomes and the future of clinical cytogenetics. Genet. Med. 20, 697–707 (2018).
Dong, Z. et al. A robust approach for blind detection of balanced chromosomal rearrangements with whole-genome low-coverage sequencing. Hum. Mutat. 35, 625–636 (2014).
Redin, C. et al. The genomic landscape of balanced cytogenetic abnormalities associated with human congenital anomalies. Nat. Genet. 49, 36–45 (2017).
Dong, Z. et al. Genome sequencing explores complexity of chromosomal abnormalities in recurrent miscarriage. Am. J. Hum. Genet. 105, 1102–1111 (2019).
Gross, A. M. et al. Copy-number variants in clinical genome sequencing: deployment and interpretation for rare and undiagnosed disease. Genet. Med. 21, 1121–1130 (2019).
Chaubey, A. et al. Low-pass genome sequencing: validation and diagnostic utility from 409 clinical cases of low-pass genome sequencing for the detection of copy number variants to replace constitutional microarray. J. Mol. Diagn. 22, 823–840 (2020).
Cheng, Y. K. et al. The detection of mosaicism by prenatal BoBs. Prenat. Diagn. 33, 42–49 (2013).
Dong, Z., et al. Development of coupling controlled polymerizations by adapter-ligation in mate-pair sequencing for detection of various genomic variants in one single assay. DNA Res. 26, 313–325 (2019).
Li, H. & Durbin, R. Fast and accurate short read alignment with Burrows–Wheeler transform. Bioinformatics. 25, 1754–1760 (2009).
Li, H. et al. The Sequence Alignment/Map format and SAMtools. Bioinformatics. 25, 2078–2079 (2009).
Chau, M. H. K. et al. Low-pass genome sequencing: a validated method in clinical cytogenetics. Hum. Genet. 139, 1403–1415 (2020).
Genomes Project, C. et al. An integrated map of genetic variation from 1,092 human genomes. Nature. 491, 56–65 (2012).
Sudmant, P. H. et al. An integrated map of structural variation in 2,504 human genomes. Nature. 526, 75–81 (2015).
Shirley, M. D. et al. Chromosomal variation in lymphoblastoid cell lines. Hum. Mutat. 33, 1075–1086 (2012).
Oniya, O., Neves, K., Ahmed, B. & Konje, J. C. A review of the reproductive consequences of consanguinity. Eur. J. Obstet. Gynecol. Reprod. Biol. 232, 87–96 (2019).
Hoppman, N., Rumilla, K., Lauer, E., Kearney, H. & Thorland, E. Patterns of homozygosity in patients with uniparental disomy: detection rate and suggested reporting thresholds for SNP microarrays. Genet. Med. 20, 1522–1527 (2018).
Collins, R. L. et al. Defining the diverse spectrum of inversions, complex structural variation, and chromothripsis in the morbid human genome. Genome Biol. 18, 36 (2017).
Dong, Z., et al. Deciphering the complexity of simple chromosomal insertions by genome sequencing. Hum. Genet. 140, 361–380 (2021).
Acknowledgements
This project is supported by the National Natural Science Foundation of China (31801042), the Health and Medical Research Fund (04152666, 07180576), 2018 Shenzhen Virtue University Park Laboratory Support Special Fund (YFJGJS1.0) for Key Laboratory for Regenerative Medicine, Ministry of Education (Shenzhen Base), General Research Fund (14115418), and Direct Grant (2019.051). C.C.M. is supported by NIH/NIGMS P01 GM0613S4 and the NIHR Manchester Biomedical Research Centre, UK. We thank the 1000 Genomes Project for releasing the GS and CMA data. The following cell lines/DNA samples were obtained from the NIGMS Human Genetic Cell Repository at the Coriell Institute for Medical Research: [NA06984, NA06985, NA06986, NA06989, NA06994, NA07000, NA07037, NA07048, NA07051, NA07056, NA07347, NA07357, NA10847, NA10851, NA11829, NA11830, NA11831, NA11832, NA11840, NA11843, NA11881, NA11892, NA11893, NA11894, NA11918, NA11919, NA11920, NA11930. NA11931, NA11932, NA11933, NA11992, NA11994, NA11995, NA12003, NA12004, NA12005, NA12006, NA12043, NA12044, NA12045, NA12046, NA12058, NA12144, NA12154, NA12155, NA12156, NA12234, NA12249, NA12272, NA12273, NA12275, NA12282, NA12283, NA12286, NA12287, NA12340, NA12341, NA12342, NA12347, NA12348, NA12383, NA12399, NA12400, NA12413,, NA12414, NA12489, NA12546, NA12716, NA12717, NA12718, NA12748, NA12749, NA12750, NA12751, NA12760, NA12761, NA12762, NA12763, NA12775, NA12776, NA12777, NA12778, NA12812, NA12813, NA12814, NA12815, NA12827, NA12828, NA12829, NA12830, NA12842, NA12843, NA12872, NA12873, NA12874, NA12878, NA12889, NA12890]. These genome sequencing data were generated at the New York Genome Center with funds provided by NHGRI Grant 3UM1HG008901-03S1.
Author information
Authors and Affiliations
Contributions
Z.D., Y.K.K., and K.W.C. designed the study. Y.M.W., T.Y.L., and Y.K.K. collected the samples. Y.Z., M.S., and M.H.K.C. performed genome sequencing and conducted validation. Z.Y. and Z.D. performed the analysis. Z.D., M.H.K.C., Z.Y., Y.K.K., C.C.M., and K.W.C. carried out the data interpretation and wrote the manuscript.
Corresponding authors
Ethics declarations
Ethics Declaration
The study protocol was approved by the Ethics Committee of the Joint Chinese University of Hong Kong–New Territories East Cluster Clinical Research Ethics Committee (CREC reference number 2016.713). Written consent for sample storage and genetic analyses was obtained from each participant.
Competing interests
The authors declare no competing interests.
Additional information
Publisher’s note Springer Nature remains neutral with regard to jurisdictional claims in published maps and institutional affiliations.
Supplementary information
Rights and permissions
About this article

Cite this article
Dong, Z., Chau, M.H.K., Zhang, Y. et al. Low-pass genome sequencing–based detection of absence of heterozygosity: validation in clinical cytogenetics. Genet Med 23, 1225–1233 (2021). https://doi.org/10.1038/s41436-021-01128-7
Received:
Accepted:
Published:
Issue Date:
DOI: https://doi.org/10.1038/s41436-021-01128-7
This article is cited by
-
Identification of cryptic balanced translocations in couples with unexplained recurrent pregnancy loss based upon embryonic PGT-A results
Journal of Assisted Reproduction and Genetics (2024)
