
Abstract
Background
Hepatocellular carcinoma (HCC) incidence has increased rapidly, and prognosis remains poor. We aimed to explore predictors of routes to diagnosis (RtD), and outcomes, in HCC cases.
Methods
HCC cases diagnosed 2006–2017 were identified from the National Cancer Registration Dataset and linked to Hospital Episode Statistics and the RtD metric. Multivariable logistic regression was used to explore associations between RtD, diagnosis year, 365-day mortality and receipt of potentially curative treatment.
Results
23,555 HCC cases were identified; 36.1% via emergency presentation (EP), 30.2% GP referral (GP), 17.1% outpatient referral, 11.0% two-week wait and 4.6% other/unknown routes. Odds of 365-day mortality was >70% lower via GP or OP routes than EP, and odds of curative treatment 3–4 times higher. Further adjustment for cancer/cirrhosis stage attenuated the associations with curative treatment. People who were older, female, had alcohol-related liver disease, or were more deprived, were at increased risk of an EP. Over time, diagnoses via EP decreased, and via GP increased.
Conclusions
HCC RtD is an important predictor of outcomes. Continuing to reduce EP and increase GP and OP presentations, for example by identifying and regularly monitoring patients at higher risk of HCC, may improve stage at diagnosis and survival.
Introduction
Cancer survival in the UK is improving but remains poor compared to other European [1] and high income countries [2]. Improving cancer survival in the UK is a key challenge set out by the Department of Health, the NHS and the Independent Cancer Taskforce [3,4,5]. Survival rates vary greatly between cancers [1]. Primary liver cancer has a particularly poor prognosis compared to many other cancers [1]. Furthermore, incidence increased over three-fold for hepatocellular carcinoma (HCC), the most common form of liver cancer, between 1997 and 2017 [6]. HCC diagnosis is strongly associated with liver cirrhosis such that approximately 80% of patients with HCC also have liver cirrhosis. Early detection at a treatable stage improves cancer prognosis [7]. As such, 6-monthly liver ultrasounds for cancer detections are recommended for people at high risk of HCC [8].
The route a person takes to their diagnosis of cancer is strongly predictive of 1-year survival [9]. The Routes to Diagnosis (RtD) metric uses an algorithm to assess information about interactions with health care prior to a cancer diagnosis to assign each patient to a route [9]. Emergency presentations (via A&E, or emergency GP referral, transfer, consultant outpatient referral, admission or attendance) [9], have the poorest survival for the majority of cancers (https://www.cancerdata.nhs.uk/routestodiagnosis/survival). Conversely, in general, routine and urgent GP referral have the best prognosis. Overall, one in five cancers are diagnosed as an emergency; for HCC it is one in three. Understanding the differences in RtD presentations over time and predictors of RtDs can help us understand the survival gap and indicate ways to address it. Here we aim to explore, in HCC cases for the first time, (1) predictors of RtD, (2) differences in RtD presentations over time, (3) associations with mortality, and (4) associations with receipt of potentially curative treatment.
Methods
Registry data
Patient-level data on England residents diagnosed with HCC (defined as 10th edition of the International Classification of Diseases (ICD-10) code C22.0 and the second edition ICD Oncology (ICD-O) morphology code M8170) between 1st January 2006 and 31st December 2017 were extracted from the National Cancer Registration Dataset [10]. The Registration Dataset uses data from a wide range of sources including hospital activity records, multidisciplinary teams meetings, patient administration systems, pathology reports, molecular test reports and death certificates from the Office for National Statistics. It includes all cases of cancer diagnosed and treated in the National Health Service (NHS) in England (which funds 98–99% of all hospital activity [11]), as well as some treated privately [10]. A marker of registration quality is the proportion of cancers identified through death certification alone. In the English National Cancer Registration Database this is less than 1%, indicating that the vast majority of data relevant to a cancer diagnosis is being captured and the cancer registry has very high population completeness [10].
If a patient had two HCC tumours diagnosed during the study period, only the first tumour was included. Only patients aged 20 or over were included, due to rare aetiologies and subtypes of HCC in young people (47 aged <20 years excluded). HCC diagnoses were based on clinical investigations (imaging) in 60% of cases (as recommended for cirrhotic patients by EASL [12]), pathology in 35% of cases, and death certificate only or unknown in the remaining 5%. Data extracted included diagnosis date, death date, vital status (alive/dead/emigrated), date of last vital status (follow-up to 02/03/2020), age at diagnosis, gender, ethnicity (broad groups) and Charlson comorbidity score (categorical: no known comorbidities, 1, 2, 3 or more) and index of multiple (IMD) deprivation quintile (depending on year of diagnosis, income domains 2007, 2010, 2015, or 2019 as measured for each lower super output area (administrative areas of approximately 400–1200 households) was used, linked via patient postal address code at diagnosis [13]). Data on these variables was complete except for 3 people in which a Charlson score had not been derived.
Hospital episode statistics
These data were linked to the Hospital Episode Statistics Admitted Patient Care dataset (HES APC) [14]. HES data were used to identify cirrhosis status and underlying primary liver disease: cirrhosis status was defined as either compensated, decompensated, or none/unknown based on relevant diagnostic and therapeutic codes, as detailed in Driver et al. [15] and in the supplementary information. Underlying cause of primary liver disease (PLD) was assigned based on diagnostic codes recorded between five years before and one year after diagnosis. Including diagnostic codes up to one year after diagnosis showed improved PLD identification (supplementary information). The following hierarchy was applied based on relative risk of HCC associated with each PLD to give one primary PLD per patient [16]: hepatitis C (HCV) > hepatitis B (HBV) > primary biliary cirrhosis (PBC) > autoimmune hepatitis > haemochromatosis > alcohol-related liver disease (ALD) > non-alcoholic fatty liver disease (NAFLD). NAFLD was assigned when a patient had fatty (change of) liver, not elsewhere classified, or cirrhosis combined with obesity or diabetes, without any other PLD. Those with no relevant diagnostic codes were designated as ‘Other/unknown’.
Treatment
Two sources were used to derive receipt of potentially curative treatment: HES APC records [14] and the Registration Dataset treatment data [10]. Treatments given from 60 days before diagnosis until death or 2 years (730 days) after diagnosis were included. Pre-diagnosis treatment was included as HCC may be diagnosed clinically and treated prior to the official registry date of incidence which may take histological tissue as the gold standard for diagnosis and reassign date of diagnosis once tissue is received [17]. The most definitive HCC treatment a patient received during this time was captured based on the following hierarchy of potentially curable treatments: liver transplant > liver resection > radiofrequency or microwave ablation > irreversible electroporation > percutaneous ethanol injection.
Route to diagnosis
Each HCC case was assigned a route to diagnosis (RtD). Details of methods used to identify and assign these are given in Elliss-Brookes et al. [9]. In brief, the algorithm interrogates cancer registration data linked to routine data from immediately prior to diagnosis (including HES, Cancer Wait Times, and NHS Screening programme data), and assigns a main RtD category: emergency presentation (EP), general practice (GP) referral, Two Week Wait (TWW, urgent GP referral with a suspicion of cancer), inpatient elective (IP), other outpatient (OP), death certification only (DCO, no data available other than a death certificate flagged by the registry) and Unknown. The methodology was developed using data for all patients with newly diagnosed malignant cancer registered in the English National Cancer Registration system between 2006 and 2008 (739,667 tumours). Since then, the metric has been derived yearly for all cancer new registrations and forms part of the cancer registration dataset.
Patient and public involvement statement
No patients were involved in forming the research question or selecting the outcome measures, nor were they involved in developing the study design. No patients were asked to advise on interpretation or writing up of results. Results will be shared through patient charities, regionally and nationally, including the British Liver Trust and on the NDRS and British Association for the Study of the Liver websites.
Statistical methods
Descriptive
The distribution of demographic and clinical factors in cases by RtD were described using means and standard deviation (for normally distributed continuous data), medians and IQRs (skewed continuous data) and absolute numbers and percentages (categorical data).
Associations with RtD and differences over time
Associations of the four main HCC routes to diagnosis (EP, OP, TWW and GP) with demographic and clinical variables (year of diagnosis, age, person stated gender, area-based deprivation quintile, ethnicity, Charlson comorbidity score, cirrhosis stage, PLD) were examined using multivariable logistic regression models. Unknown, DCO and IP were not examined due to smaller numbers. Proportions presenting via each route by year of diagnosis, unadjusted, demographic-adjusted (age, gender, ethnicity and deprivation quintile) and fully-adjusted (demographic variables and Charlson comorbidity score, cirrhosis stage, primary liver disease) were calculated.
Association with curative treatment
Associations of RtD with receipt of potentially curative treatment, unadjusted, and adjusted for multiple factors (age, gender, diagnosis year, deprivation quintile, ethnicity, Charlson comorbidity score, cirrhosis stage, and PLD) were assessed using logistic regression to calculate odds ratios (ORs). Those with DCO as the RtD were excluded from these analyses as none received curative treatment (n = 92). Sensitivity analyses were conducted excluding those that died within 90 days of diagnosis, adjusted for TNM stage (not included in the main model as stage was only available for 27% of cases), and stratified by cirrhosis status, age (< or ≥65years), and PLD.
Mortality
Those with vital status uncertainty due to discrepancies with recorded date of death (date of death before date of diagnosis (n = 9), date of death before date of treatment (n = 15), patient traced alive after date of death (n = 11)) and those lost to follow up (i.e. emigrated (n = 50), or with missing vital status (n = 5), were excluded. Those with DCO as the RtD were also excluded (n = 92) as there was no variation in survival in this group (date of death and date of diagnosis were the same). This left 23,373 individuals for mortality analysis. Univariable and multivariable logistic regression (adjusted for age, gender, diagnosis year, deprivation quintile, ethnicity, Charlson comorbidity score, cirrhosis status, and PLD) were used to calculate odds of 90-day and 365-day (one-year) mortality from diagnosis date, by RtD. Sensitivity analyses were conducted adjusting for TNM stage, and additionally for receipt of curative treatment, and stratified by cirrhosis status, age (< or ≥ 65years), and PLD.
Model assumptions were checked and met for all analyses performed. Analyses were conducted using Stata version 17.1 StataCorp. 2017. Stata Statistical Software: Release 17. College Station, TX: StataCorp LLC.
Results
Descriptive
Overall, in England 23,555 HCCs were diagnosed between 2006 and 2017. 36.1% of these presented via an emergency route, 30.2% via GP referral, 17.1% via Outpatient referral and 11.0% via Two Week Wait, 1.3% Inpatient Elective, 0.4% DCO and 3.9% had no data available (‘Unknown’ route) (Table 1).
Patient characteristics and routes to diagnosis
The characteristics of cases varied by RtD (Table 1). People presenting via IP and OP were younger at diagnosis on average (66.0 and 66.4 years, respectively), and TWW and EP (71.9 and 70.2 years, respectively) older. After adjustment for other characteristics (Table 2), the odds of EP and TWW were higher for patients with older age at diagnosis and the odds of GP referral and OP lower. 78.1% of HCC cases were in men, and the proportion varied by RtD. After adjustment, the odds of an EP compared to any other route were 24% higher in women, and of a GP or TWW presentation 11 and 17% lower, respectively. Area-based deprivation was strongly associated with RtD; over 27% of EPs were in people in the most deprived quintile of the population and only 13.8% in the least deprived. A similar pattern was seen for GP and OP presentations, but not for TWW and IP presentations. After adjustment for other characteristics, odds of an EP presentation were 45% higher for those in the most deprived quintile compared to the least. In contrast, odds of OP presentation were 25% lower. The ethnicities of those diagnosed via EP, GP and OP were broadly similar, but a higher proportion of those diagnosed via TWW were white (87.2%), and for those diagnosed via IP a lower proportion were white (77.5%) and a higher proportion (6.7%) black. Ethnicity data was missing for a large proportion of DCOs (57%). After adjustment, there was no strong associations of ethnicity with EP, but odds of GP referral or TWW were highest for white people, and odds of OP were highest for Asian and other ethnicities.
Underlying PLD could be established from HES records in 13,777 (58.5%) cases. The remaining 41.5% either had one of the forms of PLD on our list but no record of a corresponding HES code for it, had a different PLD, or had no PLD. Overall, ALD (20.7% of cases) was the most common PLD, followed by NAFLD (15.1%) and then HCV (13.2%) and this varied by RtD. The odds of an EP presentation were highest for those with ALD compared to other PLDs, after adjustment for other characteristics. In comparison, the odds of a GP referral was higher for PLDs other than ALD. More people presenting via OP had a known PLD than those presenting via other routes. People with AIH, PBC, haemochromatosis, and viral hepatitis were more likely to have an OP presentation than those with ALD, or NAFLD. The odds of TWW presentation was highest in those with NAFLD and with no/unknown PLD.
41.7% of cases had no co-morbidity codes recorded in HES and 29.7% had a score of three or more. Those presenting via TWW or IP had fewest recorded comorbidities (57.2% and 55.9% had none, respectively) and those presenting via OP the most (52.0% had a score of two or more). After adjustment, those with known comorbidities were less likely to present via TWW (OR 0.32 [95%CI 0.28–0.36] in those with a score of ≥3 comorbidities compared to those with no recorded comorbidities), and more likely to present via OP (OR 2.08 [95%CI 1.90–2.28] for ≥3). The highest proportion of patients with decompensated cirrhosis was seen in those presenting via EP (accounting for 39.1% of all EPs). After adjustment, those with decompensated cirrhosis were over 4 times more likely to present via EP than those with compensated cirrhosis (OR 4.21 [95%CI 3.91–4.54]). TWW presentations were less likely to have any recorded cirrhosis. TNM stage was only available for 27.3% of cases. The stage distribution was more favourable in those presenting via GP or OP and least favourable for those presenting via EP.
Routes to diagnosis over time
The proportion presenting via EP reduced between 2006 and 2017 from 42.2% to 31.5% of all cases, and the proportion presenting via GP referral and TWW increased (24.9% to 30.7% and 6.9% to 15.2%, respectively). There was no significant change in the proportion presenting via OP (16.4% to 15.2%). These patterns remained after adjustment for demographic and, additionally, for clinical characteristics of patients (Fig. 1).
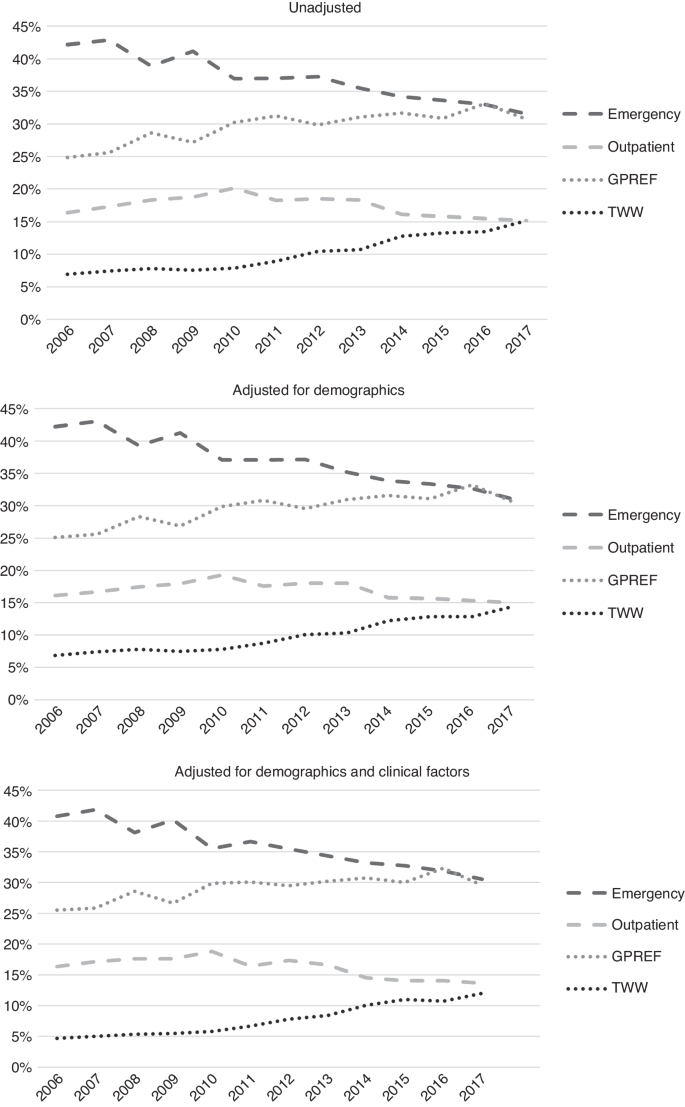
Upper graph: unadjusted. Middle graph: adjusted for demographics. Lower graph: adjusted for demographic and clinical factors.
Associations with mortality
20,671 (87.8%) HCC cases had died by the end of follow-up; median survival was 194 days overall (Table 1). Median survival ranged widely from 55 days for diagnoses via EP, to over 400 days for GP and OP (Fig. 2). Unadjusted, compared to EPs, those presenting via OP or GP referral had the lowest odds of mortality at 365 days (Table 3). In fully adjusted models, associations were only slightly attenuated and those presenting via OP or GP referral continued to have the lowest odds of mortality (OR 0.23 and 0.26, respectively) compared to EP. IP or TWW had intermediate odds (OR 0.37 and 0.42, respectively). In those with stage information, additional adjustment for TNM stage accounted for some of the variation in odds of mortality by RtD and further adjustment for receipt of potentially curative treatment attenuated associations further, but odds of death by 365 days post-diagnosis remained highest for EPs compared to other RtDs.
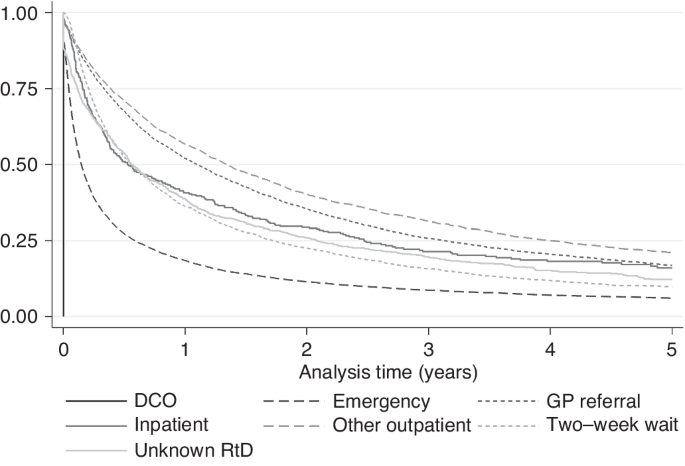
Kaplan–Meier 5-year survival by route to diagnosis.
In the sensitivity analyses (Table 3), for people with decompensated cirrhosis, odds of mortality by 365 days were similar for those diagnosed via TWW and EP, and lowest for GP and OP. Odds of 365-day mortality were highest for EPs irrespective of the underlying cause of PLD, although odds were also high for presentations via TWW for people with haemochromatosis and HCV. For those with AIH, PBC or NAFLD, the lowest odds of 365-day mortality were diagnoses via IP or Unknown RtDs, followed by GP and OP. Analyses were repeated with 90-day mortality as the outcome to assess if associations were different for short term mortality (Supplementary Information 5). Associations were broadly similar.
Associations of RtD with curative treatment
20.5% of cases received potentially curative treatment overall, which also varied widely by RtD (Table 1); from 9.0% for EP to 35.8% for OP. Unadjusted, compared to EP, the odds of curative treatment were almost six times higher for OP (OR 5.94), four times higher for GP and IP (ORs 3.90 and 3.86, respectively) and two times higher for TWW (OR 1.91), and Unknown RtD (OR 1.92) (Table 4). In the fully adjusted model, these associations remained but were slightly attenuated (for example, OR for OP was 4.16 compared to EP). In sensitivity analyses, variations in associations were seen. Excluding those that died in the first 90 days after diagnosis attenuated associations substantially, though odds of curative treatment were still 1.8 to 2.3 times higher for presentations via OP, IP, and GP compared to EP. The same attenuation pattern was also seen following additional adjustment for TNM stage. When stratified by cirrhosis stage, large differences in odds of curative treatment by RtD were seen for those with no known cirrhosis (OR range 6.05 for OP to 1.0 for EP (referent)), and compensated cirrhosis (OR range 4.41 for OP to 1.0 for EP). For those with decompensated cirrhosis, odds were highest in those that presented via OP (OR 3.05) and GP (OR 2.20), but those that presented via TWW, IP or unknown RtD all had similar odds to those presenting via EP. Some differences in range of associations were also seen by PLD. For those with haemochromatosis or HBV, odds of curative treatment in those presenting via OP were over six times that of those presenting via EP. For those with NAFLD, odds of curative treatment were 4–5 times higher in those presenting via IP, OP, or GP referral than via EP. For those with other/unknown/no PLD, odds were much higher for OP (OR 6.01) and GP (OR 4.60), compared to EP. An effect modification by age was also seen; those aged over 65 were over five times more likely to receive curative treatment if presentation was via OP than EP, whereas those under 65 were three times more likely.
Discussion
Summary
Route to diagnosis is strongly associated with odds of 90-day and 365-day mortality and inversely associated with receipt of potentially curative treatment in patients diagnosed with HCC. Patients presenting via EP had the poorest prognosis; <10% received curative treatment and median survival was just 55 days. In comparison, of those presenting via OP, over a third received curative treatment, and median survival was nearly10 times higher than for EP diagnoses. After adjustment for demographic and clinical factors, odds of mortality by 365 days was substantially lower for those presenting via GP or OP routes compared to EP, and odds of curative treatment substantially higher. The differences in rates of potentially curative treatment by RtD were influenced by differences in patient age at diagnosis, PLD, cancer and cirrhosis stage at presentation, and early death. Vulnerable patients including older people, women, those with alcohol-related liver disease, and people residing in more deprived areas, were at increased risk of an EP. Fortunately, the proportion of HCC patients presenting as emergencies is decreasing, and those presenting via GP referrals increasing.
Strengths and limitations
This study used a population-based dataset including the vast majority of HCC cases diagnosed and treated in England. The results are therefore representative of and generalisable to the population. 12 years of data were included which allowed examination of differences over time. The sample size was large (n = 23,555), despite liver cancer being classified as a rare cancer. RtD is a well-established metric derived from linked routinely-collected population-based datasets. We were able to examine associations of RtD with a wide range of factors known to cause variation in mortality available within and derived from the high-quality National Cancer Registration Dataset. We present a novel method for identification of primary liver cancer from HES codes, validated by comparison with PLD from clinical records.
There are limitations. As data was not collected specifically for the purpose of this study, in common with other observation studies based on routine data, some variables that would have been informative were not available in the dataset. In particular, Barcelona liver cancer stage or variables to derive this (TNM stage, Child-Pugh liver function and ECOG performance status) were not available for the majority of cases. Some important liver cancer risk factors such as BMI, smoking and alcohol consumption, or indicators of liver function, were not available. In our study, underlying cause of primary liver cancer, comorbidity score, and cirrhosis stage were inferred from HES codes, which are dependent on hospital admissions and accurate coding practices. PLD and cirrhosis status were not derivable for around 40% of patients, and it was not possible to know if this was true absence of a PLD or just absence of a code. Furthermore, we used data to identify underlying PLD both before and after the diagnosis of HCC. This was done to improve classification recognising that this is an understudied area, but there is the risk of bias through differential misclassification by RtD. Liver surveillance status was unknown. The deprivation measure used was based on area of residence, therefore there may be residual confounding by socioeconomic status. There were insufficient numbers of inpatient presentations to assess associations with this RtD metric. In addition, we were unable to use cause of death to identify cancer-related death due to the propensity to assign deaths in people with HCC as cancer-related although many would have been due to complications of cirrhosis (77% of deaths were attributed to C220 in our cohort).
Comparison with other literature
For all cancers diagnosed 2011 to 2015 combined, screening followed by TWW and then GP referral had the best 12-month net survival, but for liver cancer the other outpatient route had the best survival [18]. (Note no liver cancers were diagnosed via the screening route as there is not yet a national liver cancer screening programme, although surveillance of at-risk groups is advised). Similar to our study, excess early mortality (the three months after diagnosis) in emergency presentations has previously been reported for colorectal, cervical, breast, lung, and prostate, even after adjustment for age, stage and comorbidity [19]. A reduction in emergency presentations across all cancers from 2006–2013 was previously reported, of which only one-fifth was explained by change in case mix (age, gender, deprivation and cancer site) [20]. Our results show change in case-mix had very little influence on these RtD differences over time in those with liver cancer. Similar to our findings for liver cancer, Tataru et al. [21] found that patients with lung cancer were much less likely to receive surgery if they presented as an emergency. Markar et al. [22] found that oesophageal and gastric cancer patients that had an emergency diagnosis had poorer prognosis after surgery. Both of these studies, and another large study, including liver cancer, reported female gender, increased age, and higher deprivation to be risk factors for emergency presentations [21,22,23].
Interpretation
In order to improve cancer survival in England, the Independent Cancer Taskforce has identified early diagnosis as key [4]. The high rate of EPs in those with decompensated cirrhosis likely reflects the development of significant symptoms requiring admission (e.g. variceal bleeding/ ascites). The HCC may be diagnosed as part of the investigation of those symptoms. For liver cancer, identifying at-risk patients (i.e. those with asymptomatic compensated cirrhosis or chronic hepatitis B) and closely monitoring them may reduce the number of emergency presentations and improve early diagnosis. Those diagnosed via outpatient routes were most likely to survive for one year after diagnosis and receive potentially curative treatments. People with viral or autoimmune hepatitis, or multimorbidity, were more likely to be diagnosed via OP. These patients would likely have received regular specialist medical care for their chronic liver conditions, which may have led to earlier cancer detection. Similar to OP, patients presenting via GP referral may be interacting regularly with healthcare, thus their more favourable cancer and cirrhosis stage profile at diagnosis. We were unable to assess the impact of surveillance, but 6-monthly liver ultrasounds, with or without serum alpha-fetoprotein testing, have been shown to improve early detection, receipt of curative treatment and survival [7] and is therefore recommended for people with cirrhosis [8]. Patients with known cirrhosis undergoing liver surveillance would be most likely to be categorised as OP presentations. Early detection of HCC in patients with NAFLD, the most rapidly increasing cause of HCC [24], via ultrasound can be challenging [25]. There is also the challenge of educating patients and clinicians to identify signs and symptoms of HCC, and to increase referrals for diagnostic investigation. A small study in Scotland of GP interactions prior to a cancer diagnosis found not having seen a GP was a strong risk factor of an EP, though 18% of EPs in upper GI cancer cases were missed opportunities (GPs had not adhered to referral guidelines for suspected cancers) [26]. Of these, over 70% had seen their GP 6 times or more time in the 24 months preceding a diagnosis. A similar proportion occurred while patients were waiting for secondary care appointments.
Conclusions
Rates of liver cancer have been rapidly increasing in the UK and survival is still poor, making liver cancer one of the most rapidly increasing causes of cancer-related death in the UK. Identifying factors associated with treatment and mortality can help identify areas to target to improve early diagnosis and survival. Liver cancer patients are most likely to present via the emergency route to diagnosis, which is strongly associated with higher mortality in the first year after diagnosis and reduced odds of curative treatment, even after adjustment for early mortality and prognostic factors. There was inequality among the cases, where older patients, women and those from more deprived areas are most likely to present as emergencies. The trend toward decreasing emergency presentations and increasing GP referrals needs to continue. Ensuring patients at higher risk of HCC, including those with high BMIs, are identified and regularly monitored, and that both patients and health care professionals are aware of liver cancer risk factors and symptoms, may help increase diagnoses at a curable stage.
Data availability
Access to cancer registration data through NHS England can be granted provided there is a justified purpose for the data release, and that there is an appropriate legal basis with safeguards in place to protect the data. Dependent on the request, ethical approval may be required. The access process is managed by the Data Access Request Service.
References
De Angelis R, Sant M, Coleman MP, Francisci S, Baili P, Pierannunzio D, et al. Cancer survival in Europe 1999-2007 by country and age: results of EUROCARE–5-a population-based study. Lancet Oncol. 2014;15:23–34.
Arnold M, Rutherford MJ, Bardot A, Ferlay J, Andersson TM, Myklebust TA, et al. Progress in cancer survival, mortality, and incidence in seven high-income countries 1995-2014 (ICBP SURVMARK-2): a population-based study. Lancet Oncol. 2019;20:1493–1505.
Department of Health. Improving Outcomes: A Strategy for Cancer. London, England, 2011. https://assets.publishing.service.gov.uk/government/uploads/system/uploads/attachment_data/file/213785/dh_123394.pdf.
NHS England. Achieving World-Class Cancer Outcomes: A Strategy for England 2015-2020. 2015. https://www.england.nhs.uk/wp-content/uploads/2016/10/cancer-one-year-on.pdf.
The NHS Long Term Plan. 2019. https://www.longtermplan.nhs.uk/wp-content/uploads/2019/08/nhs-long-term-plan-version-1.2.pdf.
Burton A, Tataru D, Driver RJ, Bird TG, Huws D, Wallace D, et al. Primary liver cancer in the UK: Incidence, incidence-based mortality and survival by subtype, sex and nation. JHEP Reports. 2021. https://doi.org/10.1016/j.jhepr.2021.100232.
Singal AG, Pillai A, Tiro J. Early detection, curative treatment, and survival rates for hepatocellular carcinoma surveillance in patients with cirrhosis: a meta-analysis. PLoS Med. 2014;11:e1001624.
National Institute for Health and Care Excellence. Quality statement 4: Surveillance for hepatocellular carcinoma. Liver Disease. 2017. https://www.nice.org.uk/guidance/qs152.
Elliss-Brookes L, McPhail S, Ives A, Greenslade M, Shelton J, Hiom S, et al. Routes to diagnosis for cancer - determining the patient journey using multiple routine data sets. Br J Cancer. 2012;107:1220–6.
Henson KE, Elliss-Brookes L, Coupland VH, Payne E, Vernon S, Rous B. et al. Data Resource Profile: National Cancer Registration Dataset in England. Int J Epidemiol. 2019. https://doi.org/10.1093/ije/dyz076.
National Audit Office. Healthcare Across the UK: A Comparison of the NHS in England, Scotland, Wales and Northern Ireland. 2012. https://www.nao.org.uk/wp-content/uploads/2012/06/1213192.pdf.
European Association for the Study of the Liver. EASL Clinical Practice Guidelines: Management of hepatocellular carcinoma. J Hepatol. 2018;69:182–236.
McLennan D, Barnes H, Noble M, Davies J, Garratt E. The English Indices of Deprivation 2010. Department for Communities and Local Government; London. 2011.
Herbert A, Wijlaars L, Zylbersztejn A, Cromwell D, Hardelid P. Data Resource Profile: Hospital Episode Statistics Admitted Patient Care (HES APC). Int J Epidemiol. 2017;46:1093–1093i.
Driver RJ, Balachandrakumar V, Burton A, Shearer J, Downing A, Cross T, et al. Validation of an algorithm using inpatient electronic health records to determine the presence and severity of cirrhosis in patients with hepatocellular carcinoma in England: an observational study. BMJ Open. 2019;9:e028571.
Roberts MS, Angus DC, Bryce CL, Valenta Z, Weissfeld L. Survival after liver transplantation in the United States: a disease-specific analysis of the UNOS database. Liver Transpl. 2004;10:886–97.
Tyczynski JE, Parkin DM. Standards and guidelines for cancer registration in Europe. IARC Tech Publ. 2003;40:69–73.
National Disease Registration Service, NHS England. Survival by Cancer Site and Diagnostic Route. Accessed 2022. https://www.cancerdata.nhs.uk/routestodiagnosis.
McPhail S, Elliss-Brookes L, Shelton J, Ives A, Greenslade M, Vernon S, et al. Emergency presentation of cancer and short-term mortality. Br J Cancer. 2013;109:2027–34.
Herbert A, Winters S, McPhail S, Elliss-Brookes L, Lyratzopoulos G, Abel GA. Population trends in emergency cancer diagnoses: The role of changing patient case-mix. Cancer Epidemiol. 2019;63:101574.
Tataru D, Jack RH, Lind MJ, Moller H, Luchtenborg M. The effect of emergency presentation on surgery and survival in lung cancer patients in England, 2006-2008. Cancer Epidemiol. 2015;39:612–6.
Markar SR, Mackenzie H, Jemal S, Faiz O, Cunningham D, Hanna GB. Emergency Presentation of Esophagogastric Cancer: Predictors and Long-term Prognosis. Ann Surg. 2018;267:711–5.
Abel GA, Shelton J, Johnson S, Elliss-Brookes L, Lyratzopoulos G. Cancer-specific variation in emergency presentation by sex, age and deprivation across 27 common and rarer cancers. Br J Cancer. 2015;112:S129–136.
Huang DQ, El-Serag HB, Loomba R. Global epidemiology of NAFLD-related HCC: trends, predictions, risk factors and prevention. Nat Rev Gastroenterol Hepatol. 2021;18:223–38.
laz Torres MC, Bodini G, Furnari M, Marabotto E, Zentilin P, Strazzabosco M, et al. Surveillance for Hepatocellular Carcinoma in Patients with Non-Alcoholic Fatty Liver Disease: Universal or Selective? Cancers. 2020;12:1422.
Murchie P, Smith SM, Yule MS, Adam R, Turner ME, Lee AJ, et al. Does emergency presentation of cancer represent poor performance in primary care? Insights from a novel analysis of linked primary and secondary care data. Br J Cancer. 2017;116:1148–58.
Acknowledgements
This manuscript forms part of the body of work of the HCC-UK BASL/NDRS Partnership. Steering group: Anya Burton, Aileen Marshall, Graeme Alexander, Ian Rowe, Robert J Driver, Vinay Kumar Balachandrakumar, Tim Cross, Katherine Cullen, Tom Bird, Dyfed W Huws, Anna Gavin, Daniela Tataru, Lizz Paley, David Wallace. This work uses data that has been provided by patients and collected by the NHS as part of their care and support. The data are collated, maintained and quality assured by the National Disease Registration Service, which is part of NHS England. The authors would like to thank Peter Jones and Hanhua Liu at NDRS for the help with quality assurance of the analyses.
Funding
This work was supported by the British Association for the Study of the Liver who received an unrestricted and unconditional award from BTG International Ltd. BTG had no input into the study design, data collection, analysis or interpretation of the data, writing of the manuscript, review of the manuscript, the decision to submit the manuscript or the writing of this statement.
Author information
Authors and Affiliations
Contributions
All authors contributed to the development of the study design, interpretation of the results and critical revision of the manuscript. AB extracted the data, RD conducted the primary liver disease validation work, JW and AB performed the data analyses, and AB drafted the manuscript. All authors read and approved the final submitted version of the manuscript.
Corresponding author
Ethics declarations
Competing interests
All of the authors completed the ICMJE uniform disclosure form; AB declares this work was supported by BTG International Ltd. AM is the chair of HCC UK. TJSC is President elect of the British Association for the Study of the Liver, has shares in AstraZeneca, has given talks for Roche, AstraZeneca, received financial support for educational events from Boston Scientific and Sirtex, works for Roche pharmaceuticals on HCC patient pathways and use of surveillance for HCC, and Roche paid for TJSC’ 2022 attendance at ASCO. IAR reports personal fees from Roche, as well as personal fees from Boehringer Ingelheim outside the submitted work. The other authors declare no competing interests.
Ethics approval and consent to participate
This study was conducted under a special legal instruction to collect patient data without needing informed consent, as part of NHS England. This instruction is granted under section 254 of the Health and Social Care Act 2012.
Additional information
Publisher’s note Springer Nature remains neutral with regard to jurisdictional claims in published maps and institutional affiliations.
Supplementary information
Rights and permissions
Open Access This article is licensed under a Creative Commons Attribution 4.0 International License, which permits use, sharing, adaptation, distribution and reproduction in any medium or format, as long as you give appropriate credit to the original author(s) and the source, provide a link to the Creative Commons licence, and indicate if changes were made. The images or other third party material in this article are included in the article’s Creative Commons licence, unless indicated otherwise in a credit line to the material. If material is not included in the article’s Creative Commons licence and your intended use is not permitted by statutory regulation or exceeds the permitted use, you will need to obtain permission directly from the copyright holder. To view a copy of this licence, visit http://creativecommons.org/licenses/by/4.0/.
About this article

Cite this article
Burton, A., Wilburn, J., Driver, R.J. et al. Routes to diagnosis for hepatocellular carcinoma patients: predictors and associations with treatment and mortality. Br J Cancer (2024). https://doi.org/10.1038/s41416-024-02645-3
Received:
Revised:
Accepted:
Published:
DOI: https://doi.org/10.1038/s41416-024-02645-3
