
Abstract
Risky decision-making is a common, heritable endophenotype seen across many psychiatric disorders. Its underlying genetic architecture is incompletely explored. We examined behavior in the Balloon Analogue Risk Task (BART), which tests risky decision-making, in two independent samples of European ancestry. One sample (n = 1138) comprised healthy participants and some psychiatric patients (53 schizophrenia, 42 bipolar disorder, 47 ADHD); the other (n = 911) excluded for recent treatment of various psychiatric disorders but not ADHD. Participants provided DNA and performed the BART, indexed by mean adjusted pumps. We constructed a polygenic risk score (PRS) for discovery in each dataset and tested it in the other as replication. Subsequently, a genome-wide MEGA-analysis, combining both samples, tested genetic correlation with risk-taking self-report in the UK Biobank sample and psychiatric phenotypes characterized by risk-taking (ADHD, Bipolar Disorder, Alcohol Use Disorder, prior cannabis use) in the Psychiatric Genomics Consortium. The PRS for BART performance in one dataset predicted task performance in the replication sample (r = 0.13, p = 0.000012, pFDR = 0.000052), as did the reciprocal analysis (r = 0.09, p = 0.0083, pFDR=0.04). Excluding participants with psychiatric diagnoses produced similar results. The MEGA-GWAS identified a single SNP (rs12023073; p = 3.24 × 10⁻⁸) near IGSF21, a protein involved in inhibitory brain synapses; replication samples are needed to validate this result. A PRS for self-reported cannabis use (p = 0.00047, pFDR = 0.0053), but not self-reported risk-taking or psychiatric disorder status, predicted behavior on the BART in our MEGA-GWAS sample. The findings reveal polygenic architecture of risky decision-making as measured by the BART and highlight its overlap with cannabis use.
Introduction
The ability to make decisions in uncertain conditions that involve the balance between risk and reward is fundamental to success and survival, and high risk-taking behavior is common among individuals with certain neuropsychiatric disorders [1,2,3,4,5,6]. For these reasons, the biological bases of risk-taking behavior, including its neural underpinnings [7, 8] and genetic architecture [9, 10], have been a subject of recent interest. The propensity for or tolerance of risk can be evaluated using questionnaires, such as the DOSPERT Scale [11] and other surveys of individual preferences [12], while actual risk-taking can be measured using laboratory tests such as the Iowa Gambling Task [13], the Cambridge Gambling Task [14], and the Balloon Analogue Risk Task (BART) [3]. Importantly, different measures of risk-taking, both self-report and laboratory, are poorly correlated and may measure distinct underlying processes [15].
There is evidence that risk-taking is heritable. A twin study estimated the contributions of genes and environment to risk-taking propensity, using a scale that integrated seven domains of risk-taking, and found additive genetic but individually unique environmental influences [9]. Heritability estimates ranged from 29–55% for the different domains of risk-taking in a meta-analyses of twin studies [9]. In another twin study, which measured risk taking on the Iowa Gambling Task, a latent “decision-making” factor was identified, and genetic factors explained 35%, 20%, and 46% of the variance in in a sample that was tested longitudinally at three times during adolescent development [16].
Some progress in identifying specific genes contributing to risk-taking has been made in large genome-wide association studies (GWAS). Studies of self-reported risk-taking in very large samples from 23andMe and the UK Biobank, among others, have produced numerous associations [17,18,19,20,21,22,23,24,25]. Converging data from these analyses implicated Cell Adhesion Molecule 2 (CADM2), a neural cell-adhesion gene, in several risk-taking phenotypes [18, 20,21,22, 24] and extended to drug and alcohol use phenotypes [23, 25,26,27,28]. In a study of UK Biobank participants, self-evaluation as a “risk-taker” was associated with loci on chromosomes 3 (rs13084531, highlighting CADM2) and 6 (rs9379971) and shared significant genetic risk with schizophrenia, bipolar disorder, attention-deficit hyperactivity disorder, post-traumatic stress disorder, smoking and obesity [21]. The largest study of self-reported risk taking to date included over a million individuals and identified 99 risk loci [24], implicating genes involved in glutamatergic and GABAergic neurotransmission. Finally, an interaction between a variant in Phospholysine Phosphohistidine Inorganic Pyrophosphate Phosphatase (LHPP) and alcohol dependence moderated self-reported history of risky sexual behavior and was associated with brain circuitries previously implicated in the inhibition of risky behavior [29]. Overall, the results suggested that risk-taking is a complex trait that is highly polygenic—driven by many genetic variants of small effect. Additional complexity is introduced by the method of phenotype assessment, whether self-reported personality attributions or objective performance on a laboratory test.
In this study, we measured risk-taking behavior on the BART [3], a laboratory test that measures risk-taking under ambiguous conditions. We used a laboratory test to avoid bias that can influence self-report data, and selected the BART because its psychometric properties are well characterized [1, 3, 4, 8, 30, 31]. We administered the BART in two large independent studies that also provided genomic data. The BART consists of a series of choices in which both the potential for reward and the risk of loss increase. Human data exploring the genetic basis of performance on the BART is sparse, and adequately powered studies are lacking. A twin study found that genetic factors explained 47% of the variation in risk-taking on the BART by young adults [32]. A study of inbred strains of rats, performing an adapted version of the BART, demonstrated an approximately similar level of heritability, with about 55% of the variance attributable to heritability, and data consistent with a polygenic model [33]. Conversely, the BART showed no evidence of family-based heritability across extended pedigrees in a population isolate [34]. In a study of 66 healthy adults, a score combining functional variation across five genes affecting dopaminergic signaling (DRD2, DRD3, DRD4, DAT1, and COMT) was related to dorsolateral prefrontal cortical function during risky decision-making and to task earnings [35]. A candidate gene study of 223 youths reported that female but not male carriers of the COMT158Met allele had higher risk-taking propensity compared to Val homozygotes on a youth-adapted version of the BART [36]. Overall, these findings suggest that performance on the BART has a heritable component that may be related to dopaminergic function, but the results should be interpreted with caution given a propensity for bias in candidate gene studies.
Given variability in the existing literature, the present study sought to develop and test a polygenic model to estimate the variability in risky decision-making measured by the BART that is explained by common genetic variation, and to conduct a GWAS to identify specific risk variants. To increase generalizability and reproducibility, we applied the model in two large samples independently and tested for its association with psychiatric conditions known for risk-taking and impulsivity in large publicly available datasets.
Methods
Participants
Data for this study came from two projects. One was the Consortium for Neuropsychiatric Phenomics (CNP), a study performed at the Semel Institute of the University of California Los Angeles (UCLA) to examine underlying genetic and neural factors and their links to three neuropsychiatric illnesses: schizophrenia, bipolar disorder, and attention-deficit hyperactivity disorder (ADHD). Genetic, cognitive and behavioral data were similarly collected in the Genetics of Impulsivity (GOI) project, performed at the University of Georgia and the University of Chicago. Ancestry was self-reported and genetically confirmed in both studies. Combining the CNP and GOI samples increased power and improved generalizability of study results. Significant care was also taken in the analytic method (see Results section) to: a) ensure that results obtained in one sample generalized to the other sample; b) control for demographic differences between samples; and c) generalize findings to public datasets in the Psychiatric Genomics Consortium.
CNP Sample [37]. Healthy control participants, ages 21–50, were recruited by community advertisements in the Los Angeles area and were “White, not Hispanic or Latino;” or “Hispanic or Latino, of any racial group.” The primary language was either English or Spanish (N = 1138; 731 White, 407 Hispanic, of any race). Participants were excluded if they met the following criteria: neurological disease, history of head injury with loss of consciousness, use of psychoactive medications, and a positive drug screen on the day of testing. In addition, smaller samples of people with diagnoses of schizophrenia, bipolar disorder, and ADHD (following Diagnostic and Statistical Manual of Mental Disorders, Fourth Edition—Text Revision (DSM-IV-TR) [38]) were recruited using a patient-oriented strategy involving outreach to local clinics and online portals. Use of psychotropic medications was allowed in the patient groups. In total, 996 healthy individuals, 53 participants with schizophrenia, 42 with bipolar disorder, and 47 with ADHD were evaluated. Both healthy and affected individuals participating in the CNP study were included because, according to the model, we would expect a similar genetic basis in healthy and affected individuals, with more extreme phenotypes expressed in those with psychiatric disorders. Diagnoses for all individuals followed the DSM-IV-TR, and were based on the Structured Clinical Interview for DSM-IV (SCID-I) [39] supplemented by the Adult ADHD Interview (a structured interview form derived from the Kiddie Schedule for Affective Disorders and Schizophrenia, Present and Lifetime Version (KSADS-PL) [40]. Participants who were included underwent a neuropsychological battery and submitted blood samples for genotyping. All subjects gave written informed consent in line with the procedure approved by the Institutional Review Board at UCLA. Data from the CNP study have been reported in prior publications [41,42,43,44,45,46,47,48,49,50,51,52,53,54,55,56,57].
GOI Sample [15, 58]. A total of 934 Caucasian-ancestry participants 18–30 years of age were tested at two sites (40% at Athens, GA and 60% Chicago, IL). Inclusion criteria were English fluency, age 18–30 years, and self-reported Caucasian race and non-Hispanic ethnicity to minimize population stratification [59]. Exclusion criteria were scores >12 on the Alcohol Use Disorders Identification Test (AUDIT) [60] or the Drug Use Disorders Identification Test (DUDIT) [61]. All participants were screened for recent alcohol or drug use via breathalyzer or urine drug test before testing. Another exclusion criterion was treatment over the last 12 months or self-reported current need for treatment for: depression, bipolar disorder, general anxiety, social anxiety, post-traumatic stress disorder, obsessive compulsive disorder, panic attacks/disorder, phobia, schizophrenia spectrum disorders, anorexia, bulimia, or binge eating. ADHD was not excluded in this sample although it was exclusionary in the CNP sample. DNA was collected via a saliva sample for DNA collection in an Oragene DNA kit (DNA Genotek Inc., Kanata, ON, Canada).
Balloon Analogue Risk Task
The BART is a computerized behavioral measure of risky decision-making [4]. Virtual balloons are presented on a computer screen, one balloon per trial, and the participant can “pump” the balloons up by pressing a response key, virtually inflating the balloons. Each pump produces a set increase in an amount of money (e.g., 5 cents per pump) or points earned on that trial. However, after a certain number of pumps, determined probabilistically, the balloon explodes, and the trial yields no money or points. The participant must decide when to “cash out” of a given trial, by pressing a response key, to retain earnings in a cumulative bank. The objective is for the participant to earn as much money, or as many points, as possible across the trials in the task. Versions of the BART vary with respect to the number of trials/balloons used, as well as the probability of explosions (e.g., some tasks have used balloons with a single probability of explosion [4], while others have used different-colored balloons with different probabilities of explosion [3]). The primary dependent variable of the task is the mean or total number of pumps on trials in which the balloon did not explode; these have been termed ‘adjusted pumps’. The measure ‘adjusted pumps’ is preferred to the absolute number of pumps because explosions artificially restrict the range of pumping [30].
The CNP version of the BART task, programmed in E-Prime 2.0, consisted of 40 total trials, with balloons that were colored red or blue (20 of each color). Red balloons were “high risk”, with the probability of explosion on each red balloon randomly selected from a range of 1 to 32 pumps; blue balloons were “low risk”, in which the probability of explosion was randomly selected from a range of 1 to 128 pumps. The order of balloon color across trials was random. Participants received 5 points for each adjusted pump. The GOI version of the BART consisted of thirty balloons, associated with a probability of explosion selected from a range of 1 to 64 pumps. Participants in both studies did not receive payment for their performance.
Genetic analyses
Genotyping was performed using the Omni Illumina 500,000 SNP chip. For all genotype data, markers were excluded for quality control if they had less than a 95% genotyping rate, a minor allele frequency less than 1%, deviated significantly from Hardy Weinberg equilibrium (p < 10−6), or were identified as having non-random genotyping failure (p < 10−10). Individuals were excluded for missing genotypic data (<2% genotypes), missing phenotypic data, or deviation from expected autosomal heterozygosity (Fhet < 0.2). To reduce spurious effects arising from poorly powered rare variants in these modestly sized samples, only SNPs with MAF greater than 0.20 were included in the analyses, thus emphasizing the inclusion of more reliable associations. Results were similar but slightly weaker when the traditional 0.01 cut-off was used. GWAS was performed on each of the CNP and GOI datasets as follows. Principal component analysis (PCA) was performed within study as well as joint with the 1000 Genomes (1KG) ancestry informative markers for use in QC and modeling efforts. Partial correlations (in R) were used in the polygenic scoring analysis to control for the population differences in the phenotype when comparing to the scored PCA-controlled GWAS. Plink [62] was used to perform two linear regressions with Mean Adjusted Pumps as the dependent variable of interest, supplying sex, age and the first five PCA dimensions as covariates (Mean Adjusted Pumps ~ sex + age + 5 ancestry principal components). Each set of summary statistics was clumped and, along with the paired genotypes from its complement study, used to create polygenic scores for each individual in the target sample [63]. As performed by the PRSice method, we tested multiple thresholds (in this case 500 possible thresholds between 0.001–0.5) by running a linear regression of the score at each threshold (MeanAdjPumpsZ~SCORE@THRESHOLD + sex + age + 5 ancestry principal components) to determine the optimal threshold (the smallest p-value). The p-value obtained at the optimal threshold is corrected for multiple testing (500 potential thresholds) using the false discovery rate (FDR). Scores were then compared using a partial correlation analysis that controlled for the same covariates in the target dataset as in the source’s GWAS. Imputation to 1KG Phase 3 was also performed on each dataset, and the same methodology was applied.
A MEGA-analysis GWAS was performed on the merged imputed genotypes of the CNP and GOI datasets. To account for the sample population differences, the MEGA-analysis included the population covariates of the respective sources while also covarying by the source factor itself. After standard QC measures (see methods above), PLINK was used to perform a linear regression per the following model (Mean Adjusted Pumps ~ gt + sex + age + study sample + 5 ancestry principal components). A quantile-quantile (Q-Q) plot of observed vs. expected p-values and Manhattan plot of the linear regression results were performed in R. Estimation of genetic variance of all SNPs was performed using the GREML method [64] as implemented in GCTA (v1.92.4) [65]. Risk scores were then derived and the best MEGA-PRS was then tested for overlap with the single question self-report of risk-taking (“Would you describe yourself as someone who takes risks?”) in European UK Biobank participants (N = 436,236) [19] and disease status in European samples from the 2017 public ADHD, Bipolar Disorder, Alcohol Use Disorder, and “ever/never” prior cannabis use datasets using PRS methods above. Public datasets representing Attention-Deficit Disorder (PGC & iPSYCH, N = 19,099 cases, 34,194 controls) [66] and Bipolar Disorder (PGC, N = 20,352 cases, 31,358 controls, effective sample size 46,582) [67], a non-psychiatric control phenotype (PGC Inflammatory Bowel Disease, which is a combination of Ulcerative Colitis and Crohn’s disease PGC datasets), as well as Alcohol Use Disorder (UK Biobank AUDIT, N = 121,604) [23] and prior cannabis use (UK Biobank and ICC, N = 53,179 cases, 131,586 controls, effective sample size 151,493) [28] were downloaded and summary statistics were extracted in order to construct PRS models. For each disorder, a PRS was constructed and tested for prediction of BART performance in our MEGA-analysis combined sample. Similarly, UK Biobank analyses were conducted using the summary statistics as reported by Clifton and colleagues [19] to evaluate a shared genetic propensity for risk-taking between self-report and BART performance in CNP, GOI and our MEGA samples according to the PRS methods above.
Results
A PRS for risky decision-making, constructed based on BART performance in the GOI sample (i.e., the discovery sample), predicted BART performance in the CNP sample (replication sample) (r = 0.13, p = 1.2 × 10⁻⁵), and the correlation remained significant (pFDR = 5.2 × 10⁻⁵) when corrected for multiple comparisons made in empirically determining the optimal p-value threshold (0.34) for SNP inclusion in the model (Fig. 1A). When the PRS was derived from BART performance in the CNP dataset and applied to the GOI sample, a similar correlation was observed (r = 0.09, p = 0.0083, pFDR = 0.04) at an optimal threshold of 0.361 (Fig. 1B). Exclusion of subjects with psychiatric diagnoses and Hispanic origin from the CNP data produced similar but less significant results, suggesting a power limitation.
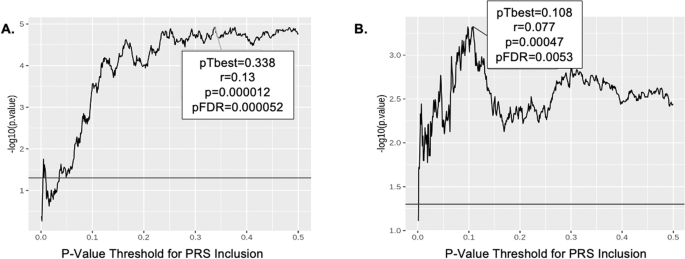
A PRS analysis using GOI as training and CNP as replication sample. B PRS analysis using CNP as training and GOI as replication sample. The optimal threshold (0.338 in A and 0.108 in B), determined by strongest PRS correlation with BART phenotype, is highlighted by the box along with correlation (r), p-value, and FDR corrected p-value. Horizontal line indicates nominal significance.
The Q-Q plot and genomic inflation factor lambda for the MEGA-analysis demonstrated that the principal components employed corrected for any effects of ancestry (Fig. 2A). MEGA-analysis linear regression (Fig. 3B) identified one variant that achieved genome-wide significance, SNP (rs12023073) in the first intron of immunoglobulin superfamily member 21 (IGSF21) on chromosome 1 (p = 3.24 × 10⁻⁸). The C-allele was associated with greater risk-taking compared to the minor T-allele (MAF = 0.34). A weaker signal occurred at rs386423 in a proximal intron of Slit-Robo GTPase activating protein 3 (SRGAP3) on chromosome 3 (MAF 0.41, p = 4.91 × 10⁻⁶). SNP heritability (h2 SNP) was significant at 0.27 (SE = 0.08, 7.1 × 10⁻¹⁴); however, this estimate should be interpreted with caution given the limitations of our small sample size.

A Q-Q plot of expected vs. observed p-values for the MEGA-GWAS. B Manhattan plot of genome-wide association with risky decision-making as measured by BART performance. Upper line demarcates genome-wide significance. Lower line indicates Bonferroni correction significance threshold.

PRS Analysis of Cannabis Dependence Versus BART Performance in the Combined GOI and CNP Samples Reveals Shared Genetic Risk. The optimal threshold (0.11), determined by strongest PRS correlation with BART phenotype, is highlighted by the box along with correlation (r), p-value, and FDR corrected p-value. Horizontal line indicates nominal significance.
When PRS data derived from the selected Psychiatric Genomics Consortium public datasets were applied to our MEGA-analysis, we observed a significant overlap in genetic factors underlying BART performance and prior cannabis use (Fig. 3, p = 0.00047, pFDR = 0.0053) but not ADHD, Bipolar Disorder, Alcohol Use Disorder or non-psychiatric control.
Discussion
In line with the few previous rodent and human studies, our findings support a heritable, polygenic component to risky decision-making, with common variation (h2 SNP) explaining 27% of the variance in risk-taking on the BART. h2 SNP prediction in this modest sample (n = 2044) should be interpreted with caution [68]; however, our finding is in line with the 47% estimate from twin data that also includes rare variant contributions.
The MEGA-analysis identified two signals, one meeting a genome-wide significance threshold and the other approaching significance. Neither of these loci were reported by the large self-report biobank studies; however, consistent with our findings, gene pathway analysis in the largest study revealed an enrichment of brain expressed genes involved in maintaining the excitatory-inhibitory balance [24]. Our key associated SNPs map to genes that represent strong biological candidates for risk-taking and relevant phenotypic associations, as discussed below. The strongest signal from the MEGA-analysis occurred at SNP rs12023073, a variant in the first intron of IGSF21, annotated as impacting an enhancer of brain expression based on histone marks [69]. The immunoglobulin superfamily protein IGSF21, which is robustly expressed in brain tissue, is believed to play an integral role in thalamic and inhibitory synaptic development [70, 71]. Through an unbiased expression screen and proteomic analysis in mice, Tanabe and colleagues found that postsynaptic Igsf21 interacts with presynaptic Neurexin2α [70]. They further showed that Igsf21 knockout mice have a number of phenotypic abnormalities, including impaired inhibitory presynaptic organization, diminished GABA-mediated synaptic transmission in hippocampal CA1 neurons, and deficits in sensory gating [70]. Interestingly, ethanol consumption increases the expression of Igsf21 in rhesus macacques [72].
The rs386423 SNP in SRGAP3, demonstrating suggestive association, is annotated as an enhancer in multiple tissues based on histone marks, and is in perfect linkage disequilibrium with SNPs impacting brain expression [69]. Rodent studies reveal prominent hippocampal and cortical expression and gene knockout results in neurodevelopmental cognitive and behavioral phenotypes [73, 74]. In humans, SRGAP3 is also known as mental disorder-associated GAP protein (MEGAP) given its hypothesized role in chromosomal intellectual disability in the context of hemizygous loss of function [75]. Two de novo missense variants in SRGAP3 were proposed to be related to Autism Spectrum Disorder in the Simons Simplex Collection [76].
Given the shift in conceptualizing mental illness from a categorical disease model to extremes of intersecting dimensional traits seen in the population [77], we tested whether risky decision-making represented one domain that would genetically overlap with psychiatric disorders characterized by prominent impulsivity and risk-taking. We hypothesized that ADHD, Bipolar Disorder, and substance use disorders (specifically Alcohol Use Disorder and cannabis use) would share polygenic underpinnings with risky decision-making, but only prior cannabis use was correlated with BART performance in our combined sample, notably withstanding correction for testing in 5 phenotypes. While a shared genetic basis between these phenotypes is also bolstered by the emergence of the CADM2 locus as the strongest signal in multiple prior GWAS studies of both risk-taking [21, 24, 25] and Cannabis Use Disorder [26, 27], this locus did not contribute to risky decision making in our sample.
While our PRS findings suggest a common genetic contribution to both risky decision-making and cannabis use, we cannot isolate the component of behavior on the BART that is responsible for the genetic overlap. BART performance is a genetically complex phenotype. Because outcome probabilities are not known when the participant starts the task, multiple cognitive processes, which include the propensity for risk-taking as well as learning, are involved. In a study using a version of the BART similar to the one implemented in the CNP sample, adolescents who reported daily cigarette smoking failed to increase their responding to balloons across trials, whereas nonsmokers adapted their performance over time and thus earned more money [31]. This same study found that the adjusted pumps measure was modestly but positively associated with years of education and nonverbal IQ. At moderate levels, pumping on the task is adaptive and results in increased gains, despite the presence of some explosion trials. In contrast, excessive pumping is maladaptive. Relevant to the present finding with cannabis use is the observation that young adults who regularly use cannabis showed significant differences in self-reports on social, health/safety, and ethical risk-taking scales, but not in the propensity to take recreational or financial risks or in performance on a laboratory monetary risk-taking task, as compared non-using control participants [78]. Therefore, the component of BART performance that is linked to the observed genetic overlap with initiation of cannabis use is yet to be determined.
The complexity of the BART performance phenotype may also underlie the lack of genetic correlation with self-reported risk-taking in the large UK Biobank sample. The BART is an objective, quantitative measure but its complexity poses a barrier to achieving adequate sample sizes needed to detect smaller genetic effects. In contrast, the UK Biobank approach uses a very blunt tool but benefits from superior power. Thus, these approaches may both detect legitimate but separate components of risky decision-making. Our data do not suggest that the self-report of risk-taking, despite its reported correlation with self-reported smoking, alcohol use, and addiction in the UK Biobank study, captures the dimensions of risky decision-making assessed with the BART although power limitations may have precluded our finding such a relationship.
Notably, the cannabis use sample was the largest of the publicly available samples examined, many times larger than the ADHD and bipolar samples. Since the public samples are highly heterogeneous, it is impossible to make comparative conclusions across disorders. Importantly, the lack of PRS replication does not necessarily imply an absence of shared genetic risk, but rather an inability to detect it with the current samples. It may be relevant that a meta-analysis confirmed that euthymic patients with bipolar I disorder make more risky choices than healthy controls on the Iowa Gambling Task, with an effect size that was small to medium by Cohen’s standard [79]. Moreover, lack of a difference in performance between patients with ADHD and healthy controls on the Cambridge Gambling Task despite differences in real-life risk taking suggests some insensitivity of laboratory tasks to propensity for risk-taking [80]. The positive correlation between BART performance and the categorical diagnosis of prior cannabis use, however, is consistent with the hypothesis that risky decision-making and initiation of substance use share a common genetic link.
This study represents the first genome-wide assessment of heritability of risky decision-making based on BART performance. It benefits from comparing similar objective and complex behavioral measurements in moderately sized, relatively genetically homogenous samples. Suboptimal power is the main limitation of this study. Given the highly complex phenotypes being evaluated, it is likely that a much larger sample is needed to definitively identify the variants and genes associated with risky decision-making and demonstrate an association with these and other psychiatric diagnoses. Further limitations relate to genetic ancestry. The sample is unpowered for meaningful examination of ancestry or sex, and there was an uneven representation of Hispanic ethnicity between the CNP and GOI datasets, which may be responsible for the weaker correlation observed when the discovery set was less homogenous. While principal component analysis shows substantial overlap between the American Hispanic and Caucasian CNP sample, the CNP and GOI datasets are imperfectly matched.
Future analyses would benefit from a more comprehensive approach to ancestry. Regarding the link to psychiatric illness, analyses utilizing public data rely on highly heterogeneous datasets with limited available data. As additional diagnoses and sample numbers expand within the public domain, additional analyses will be possible. Additionally, if available in the future, a replication sample providing independent BART data to confirm the MEGA-PRS would be useful to further validate the findings. Participants were not paid for their performance on the BART in the current study; this could be considered in future studies to enhance motivation. The ability of large population studies to comprehensively capture complex psychological constructs would be facilitated by further understanding of the limitations of self-report data versus objective measures and the development of strategies to align these approaches. Finally, targets for the development of novel psychiatric treatments may be revealed by clarifying the biological bases of common endophenotypes, such as risky decision-making, that may be more therapeutically tractable than categorical disease.
In conclusion, here we demonstrate for the first time that a polygenic score derived from a GWAS of a risk-taking phenotype successfully replicates in a distinct independent sample. Combining the samples, we found that a substantial portion of the variance in performance on the BART was captured by common genetic variation, consistent with the idea that risk-taking behavior is a heritable, highly polygenic trait. A MEGA-analysis GWAS, while not comprehensive due to limited power, produced one significant and one suggestive association in two functionally relevant genes. Finally, shared genetic architecture between BART performance in our sample and categorical cannabis use in a public dataset supports the current model of risky decision-making as a dimensional, intermediate phenotype of substance use disorder.
References
Aklin WM, Lejuez CW, Zvolensky MJ, Kahler CW, Gwadz M. Evaluation of behavioral measures of risk taking propensity with inner city adolescents. Behav Res Ther. 2005;43:215–28.
Hidiroglu C, Demirci Esen O, Tunca Z, Neslihan Gurz Yalcin S, Lombardo L, Glahn DC, et al. Can risk-taking be an endophenotype for bipolar disorder? A study on patients with bipolar disorder type I and their first-degree relatives. J Int Neuropsychol Soc. 2013;19:474–82.
Lejuez CW, Read JP, Kahler CW, Richards JB, Ramsey SE, Stuart GL, et al. Evaluation of a behavioral measure of risk taking: the Balloon Analogue Risk Task (BART). J Exp Psychol Appl. 2002;8:75–84.
Lejuez CW, Aklin WM, Jones HA, Richards JB, Strong DR, Kahler CW, et al. The Balloon Analogue Risk Task (BART) differentiates smokers and nonsmokers. Exp Clin Psychopharmacol. 2003;11:26–33.
Reddy LF, Lee J, Davis MC, Altshuler L, Glahn DC, Miklowitz DJ, et al. Impulsivity and risk taking in bipolar disorder and schizophrenia. Neuropsychopharmacology. 2014;39:456–63.
Shoham R, Sonuga-Barke EJ, Aloni H, Yaniv I, Pollak Y. ADHD-associated risk taking is linked to exaggerated views of the benefits of positive outcomes. Sci Rep. 2016;6:34833.
Kohno M, Ghahremani DG, Morales AM, Robertson CL, Ishibashi K, Morgan AT, et al. Risk-taking behavior: dopamine D2/D3 receptors, feedback, and frontolimbic activity. Cereb Cortex. 2015;25:236–45.
Rao H, Korczykowski M, Pluta J, Hoang A, Detre JA. Neural correlates of voluntary and involuntary risk taking in the human brain: an fMRI Study of the Balloon Analog Risk Task (BART). Neuroimage. 2008;42:902–10.
Wang XT, Zheng R, Xuan YH, Chen J, Li S. Not all risks are created equal: a twin study and meta-analyses of risk taking across seven domains. J Exp Psychol Gen. 2016;145:1548–60.
Harrati A. Characterizing the genetic influences on risk aversion. Biodemography Soc Biol. 2014;60:185–98.
Blais A-R, Weber EU. A domain-specific risk-taking (DOSPERT) scale for adult populations. Judgm Decis Mak. 2006;1:33–47.
Barsky RB, Juster FT, Kimball MS, Shapiro MD. Preference parameters and behavioral heterogeneity: An experimental approach in the health and retirement study. Q J Econ. 1997;112:537–79.
Bechara A, Damasio AR, Damasio H, Anderson SW. Insensitivity to future consequences following damage to human prefrontal cortex. Cognition. 1994;50:7–15.
Rogers RD, Everitt B, Baldacchino A, Blackshaw A, Swainson R, Wynne K, et al. Dissociable deficits in the decision-making cognition of chronic amphetamine abusers, opiate abusers, patients with focal damage to prefrontal cortex, and tryptophan-depleted normal volunteers: evidence for monoaminergic mechanisms. Neuropsychopharmacology. 1999;20:322–39.
MacKillop J, Weafer J, Oshri JCG, Palmer A, de Wit A. H. The latent structure of impulsivity: impulsive choice, impulsive action, and impulsive personality traits. Psychopharmacology. 2016;233:3361–70.
Tuvblad C, Gao Y, Wang P, Raine A, Botwick T, Baker LA. The genetic and environmental etiology of decision-making: a longitudinal twin study. J Adolesc. 2013;36:245–55.
Morris J, Bailey MES, Baldassarre D, Cullen B, de Faire U, Ferguson A, et al. Genetic variation in CADM2 as a link between psychological traits and obesity. Sci Rep. 2019;9:7339.
Day FR, Helgason H, Chasman DI, Rose LM, Loh PR, Scott RA, et al. Physical and neurobehavioral determinants of reproductive onset and success. Nat Genet. 2016;48:617–23.
Clifton EAD, Perry JRB, Imamura F, Lotta LA, Brage S, Forouhi NG, et al. Genome-wide association study for risk taking propensity indicates shared pathways with body mass index. Commun Biol. 2018;1:36.
Boutwell B, Hinds D, Tielbeek J, Ong KK, Day FR, Perry JRB. Replication and characterization of CADM2 and MSRA genes on human behavior. Heliyon. 2017;3:e00349.
Strawbridge RJ, Ward J, Cullen B, Tunbridge EM, Hartz S, Bierut L, et al. Genome-wide analysis of self-reported risk-taking behaviour and cross-disorder genetic correlations in the UK Biobank cohort. Transl Psychiatry. 2018;8:39.
Strawbridge RJ, Ward J, Lyall LM, Tunbridge EM, Cullen B, Graham N, et al. Genetics of self-reported risk-taking behaviour, trans-ethnic consistency and relevance to brain gene expression. Transl Psychiatry. 2018;8:178.
Sanchez-Roige S, Palmer AA, Fontanillas P, Elson SL. andMe Research Team tSUDWGotPGC, Adams MJ et al. Genome-Wide Association Study Meta-Analysis of the Alcohol Use Disorders Identification Test (AUDIT) in Two Population-Based Cohorts. Am J Psychiatry. 2019;176:107–18.
Karlsson Linner R, Biroli P, Kong E, Meddens SFW, Wedow R, Fontana MA, et al. Genome-wide association analyses of risk tolerance and risky behaviors in over 1 million individuals identify hundreds of loci and shared genetic influences. Nat Genet. 2019;51:245–57.
Clarke TK, Adams MJ, Davies G, Howard DM, Hall LS, Padmanabhan S, et al. Genome-wide association study of alcohol consumption and genetic overlap with other health-related traits in UK Biobank (N=112 117). Mol Psychiatry. 2017;22:1376–84.
Stringer S, Minica CC, Verweij KJ, Mbarek H, Bernard M, Derringer J, et al. Genome-wide association study of lifetime cannabis use based on a large meta-analytic sample of 32 330 subjects from the International Cannabis Consortium. Transl Psychiatry. 2016;6:e769.
Muskiewicz DE, Uhl GR, Hall FS. The role of cell adhesion molecule genes regulating neuroplasticity in addiction. Neural Plast. 2018;2018:9803764.
Pasman JA, Verweij KJH, Gerring Z, Stringer S, Sanchez-Roige S, Treur JL, et al. GWAS of lifetime cannabis use reveals new risk loci, genetic overlap with psychiatric traits, and a causal influence of schizophrenia. Nat Neurosci. 2018;21:1161–70.
Polimanti R, Wang Q, Meda SA, Patel KT, Pearlson GD, Zhao H, et al. The Interplay Between Risky Sexual Behaviors and Alcohol Dependence: Genome-Wide Association and Neuroimaging Support for LHPP as a Risk Gene. Neuropsychopharmacology. 2017;42:598–605.
Pleskac TJ, Wallsten TS, Wang P, Lejuez CW. Development of an automatic response mode to improve the clinical utility of sequential risk-taking tasks. Exp Clin Psychopharmacol. 2008;16:555–64.
Dean AC, Sugar CA, Hellemann G, London ED. Is all risk bad? Young adult cigarette smokers fail to take adaptive risk in a laboratory decision-making test. Psychopharmacology. 2011;215:801–11.
Rao LL, Zhou Y, Zheng D, Yang LQ, Li S. Genetic Contribution to Variation in Risk Taking: A Functional MRI Twin Study of the Balloon Analogue Risk Task. Psychol Sci. 2018;29:1679–91.
Ashenhurst JR, Seaman M, Jentsch JD. Responding in a test of decision-making under risk is under moderate genetic control in the rat. Alcohol Clin Exp Res. 2012;36:941–9.
Fears SC, Service SK, Kremeyer B, Araya C, Araya X, Bejarano J, et al. Multisystem component phenotypes of bipolar disorder for genetic investigations of extended pedigrees. JAMA Psychiatry. 2014;71:375–87.
Kohno M, Nurmi EL, Laughlin CP, Morales AM, Gail EH, Hellemann GS, et al. Functional Genetic Variation in Dopamine Signaling Moderates Prefrontal Cortical Activity During Risky Decision Making. Neuropsychopharmacology. 2016;41:695–703.
Amstadter AB, Macpherson L, Wang F, Banducci AN, Reynolds EK, Potenza MN, et al. The relationship between risk-taking propensity and the COMT Val(158)Met polymorphism among early adolescents as a function of sex. J Psychiatr Res. 2012;46:940–5.
Poldrack RA, Congdon E, Triplett W, Gorgolewski K, Karlsgodt K, Mumford J, et al. A phenome-wide examination of neural and cognitive function. Sci Data. 2016;3:1–12.
Association AP. Diagnostic criteria from dsM-iV-tr. Washington, D.C.: American Psychiatric Pub; 2000.
First MB, Spitzer, RL, Gibbon, M, Williams JBW. Structured clinical interview for DSM-IV (SCID-IV). Washington, DC: American Psychiatric Press; 1994.
Kaufman J, Birmaher B, Brent DA, Ryan ND, Rao U. K-SADS-PL. Journal of the American Academy of Child & Adolescent Psychiatry. 2000;39:1208.
Montojo C, Congdon E, Hwang L, Jalbrzikowski M, Kushan L, Vesagas T, et al. Neural mechanisms of response inhibition and impulsivity in 22q11. 2 deletion carriers and idiopathic attention deficit hyperactivity disorder. NeuroImage. 2015;9:310.
Montojo C, Jalbrzikowski M, Congdon E, Domicoli S, Chow C, Dawson C, et al. Neural substrates of inhibitory control deficits in 22q11. 2 deletion syndrome. Cereb Cortex. 2015;25:1069–79.
Helfinstein SM, Schonberg T, Congdon E, Karlsgodt KH, Mumford JA, Sabb FW, et al. Predicting risky choices from brain activity patterns. Proc Natl Acad Sci. 2014;111:2470–5.
Congdon E, Altshuler LL, Mumford JA, Karlsgodt KH, Sabb FW, Ventura J, et al. Neural activation during response inhibition in adult attention-deficit/hyperactivity disorder: preliminary findings on the effects of medication and symptom severity. Psychiatry Res. 2014;222:17–28.
Congdon E, Bato AA, Schonberg T, Mumford JA, Karlsgodt KH, Sabb FW, et al. Differences in neural activation as a function of risk-taking task parameters. Front Neurosci. 2013;7:173.
White CN, Congdon E, Mumford JA, Karlsgodt KH, Sabb FW, Freimer NB, et al. Decomposing decision components in the stop-signal task: a model-based approach to individual differences in inhibitory control. J Cogn Neurosci. 2014;26:1601–14.
Trampush JW, Yang MLZ, Yu J, Knowles E, Davies G, Liewald DC, et al. GWAS meta-analysis reveals novel loci and genetic correlates for general cognitive function: a report from the COGENT consortium. Mol Psychiatry. 2017;22:336–45.
Thakkar KN, Congdon E, Poldrack RA, Sabb FW, London ED, Cannon TD, et al. Women are more sensitive than men to prior trial events on the S top‐signal task. Br J Psychol. 2014;105:254–72.
Schreiner MJ, Karlsgodt KH, Uddin LQ, Chow C, Congdon E, Jalbrzikowski M, et al. Default mode network connectivity and reciprocal social behavior in 22q11. 2 deletion syndrome. Soc Cogn Affect Neurosci. 2014;9:1261–7.
Zheutlin AB, Chekroud AM, Polimanti R, Gelernter J, Sabb FW, Bilder RM, et al. Multivariate pattern analysis of genotype–phenotype relationships in schizophrenia. Schizophrenia Bull. 2018;44:1045–52.
Kohno M, Okita K, Morales AM, Robertson C, Dean AC, Ghahremani DG, et al. Midbrain functional connectivity and ventral striatal dopamine D2-type receptors: link to impulsivity in methamphetamine users. Mol Psychiatry. 2016;21:1554–60.
Haut KM, Karlsgodt KH, Bilder RM, Congdon E, Freimer NB, London ED, et al. Memory systems in schizophrenia: Modularity is preserved but deficits are generalized. Schizophrenia Res. 2015;168:223–30.
Davies G, Lam M, Harris SE, Trampush JW, Luciano M, Hill WD, et al. Study of 300,486 individuals identifies 148 independent genetic loci influencing general cognitive function. Nat Commun. 2018;9:1–16.
Savage JE, Jansen PR, Stringer S, Watanabe K, Bryois J, De Leeuw CA, et al. Genome-wide association meta-analysis in 269,867 individuals identifies new genetic and functional links to intelligence. Nat Genet. 2018;50:912–9.
Robertson CL, Ishibashi K, Mandelkern MA, Brown AK, Ghahremani DG, Sabb F, et al. Striatal D1-and D2-type dopamine receptors are linked to motor response inhibition in human subjects. J Neurosci. 2015;35:5990–7.
Lam M, Hill WD, Trampush JW, Yu J, Knowles E, Davies G, et al. Pleiotropic meta-analysis of cognition, education, and schizophrenia differentiates roles of early neurodevelopmental and adult synaptic pathways. Am J Hum Genet. 2019;105:334–50.
Lam M, Trampush JW, Yu J, Knowles E, Davies G, Liewald DC, et al. Large-scale cognitive GWAS meta-analysis reveals tissue-specific neural expression and potential nootropic drug targets. Cell Rep. 2017;21:2597–613.
Gray JC, MacKillop J, Weafer J, Hernandez KM, Gao J, Palmer AA, et al. Genetic analysis of impulsive personality traits: Examination of a priori candidates and genome-wide variation. Psychiatry Res. 2018;259:398–404.
Hutchison KE, Stallings M, McGeary J, Bryan A. Population stratification in the candidate gene study: fatal threat or red herring? Psychol Bull. 2004;130:66.
Saunders JB, Aasland OG, Babor TF, De la Fuente JR, Grant M. Development of the alcohol use disorders identification test (AUDIT): WHO collaborative project on early detection of persons with harmful alcohol consumption‐II. Addiction. 1993;88:791–804.
Berman AH, Bergman H, Palmstierna T, Schlyter F. Evaluation of the Drug Use Disorders Identification Test (DUDIT) in criminal justice and detoxification settings and in a Swedish population sample. Eur Addic Res. 2005;11:22–31.
Purcell S, Neale B, Todd-Brown K, Thomas L, Ferreira MA, Bender D, et al. PLINK: a tool set for whole-genome association and population-based linkage analyses. Am J Hum Genet. 2007;81:559–75.
International Schizophrenia C, Purcell SM, Wray NR, Stone JL, Visscher PM, O’Donovan MC, et al. Common polygenic variation contributes to risk of schizophrenia and bipolar disorder. Nature. 2009;460:748–52.
Yang J, Benyamin B, McEvoy BP, Gordon S, Henders AK, Nyholt DR, et al. Common SNPs explain a large proportion of the heritability for human height. Nat Genet. 2010;42:565–9.
Yang J, Lee SH, Goddard ME, Visscher PM. GCTA: a tool for genome-wide complex trait analysis. Am J Hum Genet. 2011;88:76–82.
Demontis D, Walters RK, Martin J, Mattheisen M, Als TD, Agerbo E, et al. Discovery of the first genome-wide significant risk loci for attention deficit/hyperactivity disorder. Nat Genet. 2019;51:63–75.
Stahl EA, Breen G, Forstner AJ, McQuillin A, Ripke S, Trubetskoy V, et al. Genome-wide association study identifies 30 loci associated with bipolar disorder. Nat Genet. 2019;51:793–803.
Visscher PM, Hemani G, Vinkhuyzen AA, Chen GB, Lee SH, Wray NR, et al. Statistical power to detect genetic (co)variance of complex traits using SNP data in unrelated samples. PLoS Genet. 2014;10:e1004269.
Ward LD, Kellis M. HaploReg: a resource for exploring chromatin states, conservation, and regulatory motif alterations within sets of genetically linked variants. Nucleic Acids Res. 2012;40:D930–934.
Tanabe Y, Naito Y, Vasuta C, Lee AK, Soumounou Y, Linhoff MW, et al. IgSF21 promotes differentiation of inhibitory synapses via binding to neurexin2alpha. Nat Commun. 2017;8:408.
Botella-Lopez A, Garcia-Lopez R, Pombero A, Martinez S. Radial glia fibers translate Fgf8 morphogenetic signals to generate a thalamic nuclear complex protomap in the mantle layer. Brain Struct Funct. 2019;224:661–79.
Iancu OD, Colville A, Walter NAR, Darakjian P, Oberbeck DL, Daunais JB, et al. On the relationships in rhesus macaques between chronic ethanol consumption and the brain transcriptome. Addict Biol. 2018;23:196–205.
Waltereit R, Leimer U, von Bohlen Und Halbach O, Panke J, Holter SM, Garrett L, et al. Srgap3(-)/(-) mice present a neurodevelopmental disorder with schizophrenia-related intermediate phenotypes. FASEB J. 2012;26:4418–28.
Carlson BR, Lloyd KE, Kruszewski A, Kim IH, Rodriguiz RM, Heindel C, et al. WRP/srGAP3 facilitates the initiation of spine development by an inverse F-BAR domain, and its loss impairs long-term memory. J Neurosci. 2011;31:2447–60.
Endris V, Wogatzky B, Leimer U, Bartsch D, Zatyka M, Latif F, et al. The novel Rho-GTPase activating gene MEGAP/ srGAP3 has a putative role in severe mental retardation. Proc Natl Acad Sci USA. 2002;99:11754–9.
Iossifov I, O’Roak BJ, Sanders SJ, Ronemus M, Krumm N, Levy D, et al. The contribution of de novo coding mutations to autism spectrum disorder. Nature. 2014;515:216–21.
Sanchez-Roige S, Palmer AA. Emerging phenotyping strategies will advance our understanding of psychiatric genetics. Nat Neurosci. 2020;23:475–80.
Gilman JM, Calderon V, Curran MT, Evins AE. Young adult cannabis users report greater propensity for risk-taking only in non-monetary domains. Drug Alcohol Depend. 2015;147:26–31.
Edge MD, Johnson SL, Ng T, Carver CS. Iowa Gambling Task performance in euthymic bipolar I disorder: a meta-analysis and empirical study. J Affect Disord. 2013;150:115–22.
Pollak Y, Shalit R, Aran A. Risk taking and adult attention deficit/hyperactivity disorder: A gap between real life behavior and experimental decision making. Psychiatry Res. 2018;259:56–62.
Acknowledgements
This work was supported by the Consortium for Neuropsychiatric Phenomics (NIH Roadmap for Medical Research grants UL1-DE019580, RL1MH083268, RL1MH083269, RL1DA024853, RL1MH083270, RL1LM009833, PL1MH083271, and PL1NS062410), R01 DA032015, and R03MH112032. JM was supported by the Peter Boris Chair in Addictions Research and a Tier 1 Canada Research Chair in Translational Addiction Research. EDL was supported by the Thomas P and Katherine K Chair in Addiction Studies.
Author information
Authors and Affiliations
Contributions
ELN developed the initial idea with EDL, supervised the analyses and interpretation, acted as lead author of the manuscript. CPL assembled and cleaned all data, designed and performed all genetic analysis, assisted with methods and results section of paper, and produced figures. HdW was PI and supervisor for the GIP study and contributed to manuscript writing and editing. AAP was Co-I for the GIP study and edited the manuscript. JM was Co-I for the GIP study and edited manuscript. TDC was Co-I for the CNP study and edited manuscript. RMB was PI for the CNP study and edited manuscript. EC developed rules for collection and analysis of behavioral data for the CNP study. FWS contributed to design and had major role in data collection and analysis for the CNP study. LCS assisted with genetic results and discussion. JJM assisted with genetic results and discussion. MRL assisted with genetic results and discussion and finalizing the manuscript. JW contributed to data collection and analysis for GIP study. JG contributed to data collection and analysis for GIP study. ACD contributed to BART data analysis on CNP study and manuscript writing and editing. GSH supervised all statistical analyses of current study. EDL guided analytic progress and contributed to manuscript writing and editing.
Corresponding author
Ethics declarations
Competing interests
ELN is an unpaid member of the Tourette Association of America and Myriad Genetics Advisory Boards. JM is a principal in Beam Therapeutics, Inc. and a consultant to Clairvoyant Therapeutics, Inc. HdW. is a scientific advisor to Awakn Life Sciences and Gilgamesh Pharmaceutics, and on the Board of Directors of PharmAla Biotech.
Additional information
Publisher’s note Springer Nature remains neutral with regard to jurisdictional claims in published maps and institutional affiliations.
Rights and permissions
Open Access This article is licensed under a Creative Commons Attribution 4.0 International License, which permits use, sharing, adaptation, distribution and reproduction in any medium or format, as long as you give appropriate credit to the original author(s) and the source, provide a link to the Creative Commons license, and indicate if changes were made. The images or other third party material in this article are included in the article’s Creative Commons license, unless indicated otherwise in a credit line to the material. If material is not included in the article’s Creative Commons license and your intended use is not permitted by statutory regulation or exceeds the permitted use, you will need to obtain permission directly from the copyright holder. To view a copy of this license, visit http://creativecommons.org/licenses/by/4.0/.
About this article

Cite this article
Nurmi, E.L., Laughlin, C.P., de Wit, H. et al. Polygenic contributions to performance on the Balloon Analogue Risk Task. Mol Psychiatry 28, 3524–3530 (2023). https://doi.org/10.1038/s41380-023-02123-x
Received:
Revised:
Accepted:
Published:
Issue Date:
DOI: https://doi.org/10.1038/s41380-023-02123-x
