
Abstract
The form of the malaria parasite inoculated by the mosquito, called the sporozoite, transforms inside the host liver into thousands of a new form of the parasite, called the merozoite, which infects erythrocytes. We present here a protocol to visualize in vivo the behavior of Plasmodium berghei parasites in the hepatic tissue of the murine host. The use of GFP-expressing parasites and a high-speed spinning disk confocal microscope allows for the acquisition of four-dimensional images, which provide a time lapse view of parasite displacement and development in tissue volumes. These data can be analyzed to give information on the early events of sporozoite penetration of the hepatic tissue, that is, sporozoite gliding in the liver sinusoids, crossing the sinusoidal barrier, gliding in the parenchyma and traversal of hepatocytes, and invasion of a final hepatocyte, as well as the terminal events of merosome and merozoite release from infected hepatocytes. Combined with the use of mice expressing fluorescent cell types or cell markers, the system will provide useful information not only on the primary infection process, but also on parasite interactions with the host immune cells in the liver.
Introduction
Malaria infection occurs when a mosquito containing Plasmodium parasites takes a blood meal, during which the infective form or sporozoite is injected into the dermis of the host1,2,3,4,5. At least some of the sporozoites deposited in the dermis eventually enter the blood circulation and reach the hepatic tissue5, where they invade hepatocytes and transform into the so-called liver or exo-erythrocytic stage. A liver stage, which originates from a single sporozoite and matures over a period of 2–3 days in rodent systems, leads to the emergence of tens of thousands of merozoites, the parasite stage that infects erythrocytes6. Invasion of erythrocytes then leads to the symptoms and complications of the disease.
The liver phase of malaria infection comprises numerous host–parasite interactions, and our understanding of this part of the parasite life cycle is still incomplete. Most of our views on how the parasite goes into and out of the hepatic tissue come from transmission electron microscopy approaches, whose significance is frequently limited by the small number of events reported, or from in vitro studies, which have their own limitations7,8,9. In recent years, imaging technology has been transferred from physics laboratories to the biological domain with impressive efficiency, which has revolutionized the way in vivo questions can be tackled10,11. There are presently various confocal microscopy techniques available that permit the acquisition of four-dimensional (4D) data, that is, in space and time. Among these techniques are (i) laser scanning confocal microscopy, which may cause high cell damage in living cells owing to the generation of oxygen radicals and is limited by the slow speed of data acquisition, (ii) multi-photon microscopy12, which offers the advantage of deep tissue penetration with minimal cell damage but is also limited by the slow speed of data acquisition, and (iii) high-speed spinning disk confocal microscopy13, which causes little cell damage and allows high-speed data acquisition. Combined with the construction of recombinant rodent malaria parasites14,15,16 that express the GFP at the pre-erythrocytic stages, these developments now permit in vivo analysis of Plasmodium behavior in rodent systems.
Two in vivo imaging studies of Plasmodium parasites in the liver of rodents have been published so far. The first17 used confocal laser scanning and conventional epifluorescence microscopy to address the way sporozoites cross the liver sinusoid endothelial barrier from the sinusoidal lumen to the parenchyma. This study concluded that Kupffer cells, the resident macrophages of the liver, act as gateways in the process. The second18 used high-speed spinning disk confocal microscopy to focus on the way hepatic merozoites gain access to the bloodstream. It revealed the existence of merosomes, which are host cell-derived buds containing numerous parasites that detach from the infected mother cell to reach the blood circulation.
We present here a protocol for studying Plasmodium parasites in the murine host hepatic tissue. The sporozoite is a highly motile cell that can glide inside host tissues at the speed of up to 2–4 μm s−1. The use of high-speed spinning disk confocal microscopy, which permits high-speed data acquisition, limits cell damage that occurs during prolonged sample illumination. This technology is suited for tracking fast-moving objects and can image up to 80 μm into the tissue, which is sufficient to observe the morphology of the liver parenchyma.
The protocol indicates how to record and analyze 4D data of fluorescent parasites during the early steps of sporozoite penetration through the hepatic parenchyma as well as during the late steps of merozoite release in the sinusoids. It should be useful for further analysis of sporozoite infection of the host liver, about which major issues remain unresolved. For example, it is still unclear whether or not sporozoites can cross the liver sinusoidal endothelial barrier via a paracellular or a transendothelial route. The fine biology of parasite maturation in vivo is also largely unexplored, and the recent discovery of the merosomes suggests that other complex and unexpected cell biological events may occur during liver stage maturation and merozoite release. Finally, the protocol could be adapted for visualizing the immune response of the host, and how protection proceeds in immunized individuals.
Note about the procedure
For the imaging steps, we give the concept for each point, so users can easily adapt the protocol to the equipment available to them. In some cases, we give information specific to our equipment; this is preceded by “For our equipment.”
Materials
Reagents
-
18–22 days post-infection Anopheles stephensi Sda500 mosquitoes, infected with P. berghei
-
P. berghei NK65 clone, PbFluspo, expressing GFP under the control of the cs promoter (stage-specific fluorescence at the oocyst, sporozoite and early liver stages)14
-
P. berghei ANKA clone, WT: GFP, expressing GFP under the control of the hsp70 promoter19, or P. berghei ANKA clone, PbGFPCON, expressing GFP under the control of the ef-1 α promoter15; the parasites are fluorescent at all stages
-
Mice: 4- to 7-week-old C57BL/6J@Rj (Elevage Janvier). Other murine backgrounds are acceptable; however, the liver morphology of C57BL/6 mice has the best structure for microscopy studies. Rats can be used, but as they are bigger animals, a higher number of sporozoites are needed for infection, so young animals should be preferred
Caution
All experiments involving rodents must conform to national and institutional regulations.
-
Absolute ethanol (Merck, ref. 1.00983.1011) diluted to 70% (vol/vol) in distilled water
-
1× PBS Dulbecco (Invitrogen, ref. 14040091)
-
Bovine serum albumin (BSA) (Sigma) to verify gliding motility of sporozoites
-
Anesthetic solution (see REAGENT SETUP): pentobarbital (CEVA) or a mixture comprising ketamine (Imalgene 1000, Merial) and xylazine (2% Rompun, Bayer)
-
Superglue 3 (Henkel)
-
Physiological serum and cotton pads
-
Bovine serum albumin conjugated to Alexa Fluor 647 (Molecular Probes—Invitrogen)
Equipment
-
Syringe-driven 0.22 μm PES filter unit (Millipore)
-
Disposable piston pellet for microtubes (Fisher Bioblock Scientific)
-
Hemocytometer (CML)
-
1 ml insulin syringes with integrated needle (Omnican 0.30 × 12 mm, B BRAUN)
-
Microsurgery eye scissors (World Precision Instruments)
-
Microsurgery straight iris scissors (World Precision Instruments)
-
Microsurgery curved iris forceps (World Precision Instruments)
-
Coverslips (Micro cover glass 24 × 60 mm; Eric Scientific Company)
-
Aspirator for collecting mosquitoes
-
Stereozoom microscope with epifluorescence and GFP filter for dissecting mosquitoes (Zeiss Stemi 2000-C, Carl Zeiss) with fiber-optic lighting (Schott KL1500LCD)
-
Epifluorescence microscope equipped with a GFP filter for parasite counting
-
Low-temperature cautery (World Precision Instruments) to cauterize any blood vessels cut during surgery
-
Epifluorescence microscope (Axiovert 200, Carl Zeiss) equipped with a high-speed spinning disk confocal system (see EQUIPMENT SETUP). This protocol can be modified to use other fluorescence microscopy techniques
-
Pekin-Elmer Ultraview ERS Image Suite software
-
25× Plan-NeoFluar NA 0.8 multi-immersion corrected objective (Carl Zeiss) for the spinning disk system. Higher magnification objectives can be used depending on what is to be observed
-
Homeothermic blanket system for animal heating (Harvard Apparatus, http://www.harvardapparatus.com/webapp/wcs/stores/servlet/category_11051_10001_37612_-1_HAI_Categories_N_37611_37610_)
-
Handmade aluminum platform or cover from rectangular cell culture dish to hold the mouse on the motorized microscope stage
-
ImageJ software (see EQUIPMENT SETUP)
Reagent setup
-
Anesthetic solution Use either a pentobarbital (in general, this anesthetic is less likely to induce hyperventilation) or ketamine/xylazine mix. Pentobarbital should be used at a concentration of 50 mg per kg body weight. Inject i.p. 100 μl of a solution appropriately diluted. For the ketamine/xylazine mix, mix two volumes of Imalgene 1000 (ketamine) with one volume of 2% Rompun (xylazine) and five volumes of 1× PBS. Inject i.p. 50 μl of this solution per 10 g of body weight (ketamine: 125 mg per kg body weight; xylazine: 12.5 mg per kg body weight).
-
BSA-Alexa Fluor 647 Prepare a solution at 10 mg ml−1 in sterile-filtered PBS and aliquot protected from light and store at −20 °C.
Equipment setup
-
High-speed spinning disk confocal microscopy for in vivo imaging The minimal equipment needed consists of a fluorescence microscope, equipped with an objective with a long working distance (for high penetration into the tissue) and a high-speed charge-coupled device camera. However, to avoid photobleaching and cell damage, the use of multi-photon confocal microscopy or spinning-disk confocal microscopy is recommended.
We use the Ultraview ERS spinning disk from Perkin-Elmer (http://las.perkinelmer.com/content/livecellimaging/) equipped with an Ar/Kr laser (excitation at three wavelengths: 488, 568 and 647nm) mounted on an inverted Axiovert 200 microscope with Optovar (1.6× magnification) option (Carl Zeiss) linked to a high-speed charge-coupled device camera (Orca ER camera, Hamamatsu, Japan). Note that cameras with a higher sensitivity and frame per second value are now commercially available. The z-position is controlled by an objective piezo-drive System (Piezosystem Jena) via the Perkin-Elmer pilot software.
-
Microscope platform To be able to place the animal correctly on the microscope stage, we had a made-to-measure aluminum platform (160 × 110 × 2 mm) with a round central opening (21 mm diameter). The cover of a rectangular Petri dish for cell culture can also be used if the making of the aluminum platform is not possible. A circular or rectangular hole must be made in the center that is slightly smaller than the size of the cover glass that will be used.
-
Image J software Download from http://rsb.info.nih.gov/ij and install. From the Plugins menu, install the “MultiTracker Plugin” (http://rsb.info.nih.gov/ij/plugins/multitracker.html). In the case of the Ultraview ERS Image suite software, one can use the Perkin-Elmer 4D-image series converter Plugin written to run in ImageJ, which is freely available at http://www.embl-heidelberg.de/eamnet/html/pe_plugin.html (Marchand, M. and Shorte, S.L., PFID, Institut Pasteur).
Procedure
Infection of mosquitoes
-
1
Infect starved A. stephensi female mosquitoes (200 per cage) by allowing them to feed on mice bearing the desired fluorescent parasite clone.
-
2
Keep infected mosquitoes in the standard way as described in ref. 20 for 18–22 days post-infection. Briefly, place a 10% (wt/vol) sugar solution and a 'laying' dish in the mosquito cages. Keep the A. stephensi mosquitoes in dedicated rooms or incubators at 21 °C and 70% humidity. Replace the sugar regularly during the 3-week period. Remove the 'laying' dish after 2 weeks. The imaging experiments are performed with sporozoites isolated from the salivary glands of mosquitoes 18–22 days post-infection, when mosquitoes typically contain between 10,000 and 30,000 sporozoites per salivary gland and when sporozoites have maximum infectivity20.
-
3
At 18–22 days post-infection, collect the female mosquitoes with an aspirator tube, 'anesthetize' the collected insects by blowing them into a 15 ml Falcon tube on ice, and carefully transfer the cold-anesthetized insects onto a Petri dish containing 70% ethanol. Transfer the mosquitoes to another Petri dish containing 1 × PBS.
-
4
Place the mosquitoes on a glass slide and examine them using a stereomicroscope with epifluorescence (GFP filter). Identify mosquitoes that display GFP fluorescence in the salivary glands, and dissect these as described in Steps 5–10 (further details of the dissection can be found in ref. 20).
Dissection of mosquitoes with infected salivary glands
-
5
Dissect out salivary glands under the stereomicroscope using two insulin needles. Place one needle on the thorax and with the other pull the head away from the body. Free the salivary glands from the thorax and remove any debris from around the glands.
Critical Step
During dissection, maintain mosquitoes in a humid condition with a few drops of 1× PBS to avoid dehydration under the stereomicroscope.
-
6
Recover the salivary glands and place in a low adhesion 1.5 ml microcentrifuge tube containing a small volume (around 10 μl) of 1× PBS on ice.
-
7
Repeat Steps 5 and 6 for about 25 mosquitoes. The number of mosquitoes to be dissected depends on the rate of infection, as an injection of 1× 10⁶ sporozoites is optimal. In general, a good infection should yield approximately 40,000–50,000 sporozoites per female. However, the number of sporozoites per female can be known only after counting as described in Steps 8 and 9.
Critical Step
Once dissected, maintain salivary glands on ice.
Pause point
Sporozoites in uncrushed glands are viable for up to 4 h on ice.
-
8
Gently crush the salivary glands with a disposable piston pellet for microtubes to release the sporozoites. Take 1 μl of the suspension and dilute at least ten times in a 1× PBS solution containing 5% BSA.
-
9
Place 10 μl of the dilution in a hemocytometer, and using an epifluorescence microscope with a GFP filter, count the number of sporozoites. The total volume of the 81 squares of the hemocytometer listed in the equipment is 1 μl. To obtain the total number of sporozoites collected, the number of sporozoites counted must be multiplied by the dilution (at least 10×) and by the total volume (10 μl). It is also important to verify the quality of sporozoite gliding motility; the presence of BSA in the diluting medium will allow the sporozoites to glide (to move in circles). The number of sporozoites able to complete a full circle of movement should be noted.
Preparing the samples
-
10
The parasite can be visualized at early time points as sporozoites (A) or at later time points as hepatic forms also known as exo-erythrocytic forms (EEFs) (B). Follow the appropriate option below:
-
A
Sporozoites in the liver (motility and liver invasion)
-
i
Resuspend the sporozoite suspension at a concentration of ∼1 × 10⁶ parasites per 10 μl of filtered PBS and store on ice while continuing with the next steps.
-
i
-
B
Hepatic forms in the liver (merosomes)
-
i
Resuspend the sporozoite suspension at a concentration of 1& times; 106 parasites per 100 μl of filtered PBS and store on ice.
-
ii
Vasodilate the mouse tail vein, either by soaking the tail in warm water (40 °C) for 5 min or by heating under an infrared lamp.
-
iii
Inject the sporozoite suspension i.v. into the mouse tail vein.
-
iv
Leave the mouse for 45 h, then continue with the next step.
-
i
-
A
Starting up the equipment
-
11
Turn on the necessary devices, verify that they are all working (homeothermic heater blanket system, imaging system) and install the required objective.
-
12
Open windows necessary for image acquisition (microscope control, laser control, camera control). Select the options necessary to acquire images with green and far-red fluorescence. The optimal conditions are a short exposure time, permitting the rapid acquisition of z-stacks over time (for our equipment; Supplementary Fig. 1 online).
-
13
Test whether the lasers are functioning correctly.
Caution
Laser beams can cause serious eye damage.
-
14
Install the platform on the microscope and cover with the thermal blanket to heat the platform before placing the mouse on it.
Mouse operation
-
15
Anesthetize a mouse (∼20 g) by i.p. injection of 100 μl of anesthetic. Wait about 10 min for the mouse to be in a prolonged, deep state of unconsciousness.
-
16
Disinfect the abdomen with 70% ethanol (a solution of 70% ethanol/1% betadiene can also be used). This also avoids any loose hairs from entering the incision (Note: the animal's abdomen can be shaved).
-
17
Make a horizontal incision in the mid-abdomen, around 0.5 cm below the xiphoid process. Enlarge the incision to about 1 cm wide and dissociate the conjunctive from the skin and pull the skin away from the incision. If the incision has been done correctly, the liver should be visible under the muscle layers. The incision should be higher than the edge of the liver lobe. Remove any hairs from the incision with 1× PBS and immediately cauterize any blood vessels that have been cut with the cautery (Fig. 1a).
Figure 1: Animal preparation for liver imaging. 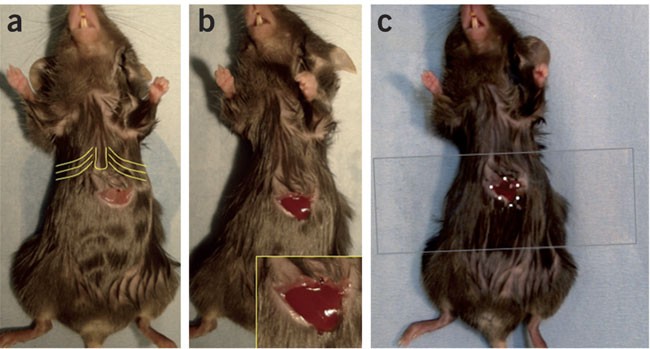
This surgical procedure leads to the exposition of the left liver lobe, facilitating imaging of this tissue. (a) The anesthetized mouse is placed on its back and a horizontal incision is made below the xiphoid process (yellow lines showing the first ribs joined to the sternum and xiphoid process below) and widened to about 1 cm. (b) The muscle layer is incised to expose the liver lobe, and a slight pressure is exerted on the abdomen so that the edge of the lobe emerges (see inset). (c) A few drops of Superglue (white circles) are deposited on the skin around the emerged lobe and a coverslip is gently pressed over the lobe.
Critical Step
It is important to cauterize blood vessels as quickly as possible, as any coagulated blood will form a layer between the abdomen and the cover glass that will impede good imaging conditions.
-
18
Make an incision in the muscle layer. Clean with 1× PBS. Put slight pressure on the abdomen to allow the edge of the left lobe to emerge. If the incision is in the correct place, the edge of the lobe will remain at the exterior (Fig. 1b). Note that the liver lobe does not necessarily need to be emerged to be observed. The cover glass can be glued over the visible zone of the exposed lobe, as described in Step 19, after the incision in the muscle layer.
-
19
Place a drop of 1× PBS on the liver lobe so that the tissue will not dehydrate during the imaging procedure. Place 5–6 small drops of Superglue 3 on the skin around the incision. Place a 24 × 60 mm cover glass over the liver lobe and gently press down, sticking the cover glass in place (Fig. 1c).
-
20
Place the animal on the heated platform, and accommodate the center of the cover glass, and thus the liver lobe with the hole of the platform. Gently cover the animal with the thermal blanket (Fig. 2).
Figure 2: Microscope setup for imaging the liver lobe. 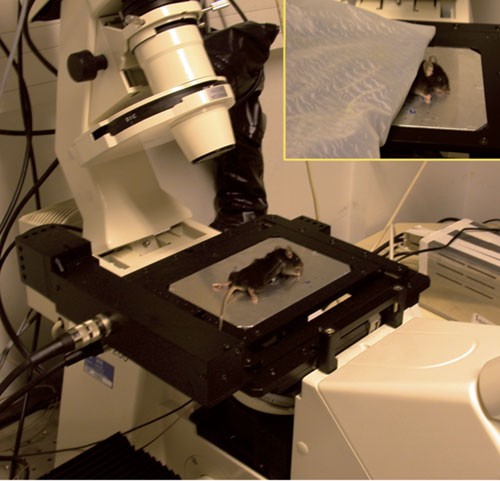
The animal is placed on the aluminum platform on the microscope stage as shown in the image. The lobe is placed so that it is in the center of the opening on the platform. In the inset, the mouse has been carefully covered with the homeothermic blanket to maintain its body temperature during image acquisition.
Critical Step
To avoid drying out of the animal's eyes, place cotton pads saturated in physiological serum over both eyes.
-
21
Switch on the mercury arc lamp, and using the filters for red fluorescence, turn the light path toward the ocular and search for the hepatic tissue using the autofluorescence of hepatocytes.
Critical Step
Avoid long exposure to the mercury arc lamp, which can cause damage and photobleaching of the sample.
-
22
Without moving the mouse, inject 50 μl of the solution containing sporozoites (optimal ∼106 sporozoites) and fluorescent BSA into the retro-orbital sinus (50 μg). To do this, place your hand gently on the mouse and draw the fur on the animal's head into the palm of your hand. This causes the animal's eye to proptose (bulge) slightly. The needle point is placed in the medial canthus (junction of eyelids closest to the animal's nose) and directed to a point directly behind the globe. Sufficient pressure must be applied to cut through the fibrous layer that surrounds the sinus. Inject the solution. The BSA will label the blood circulation, permitting the localization of liver sinusoids, and is a control of the injection for early stage visualization.
Critical Step
For later time-point studies (i.e., if following Step 10B), only inject fluorescent BSA.
-
23
Prepare for image acquisition: switch the excitation light path from the mercury arc to the laser source, change the emission light path from the ocular to the detector and make any other necessary changes.


Acquiring the images
-
24
To visualize the mouse liver sinusoids, start live imaging and activate the 647 nm laser. You should be able to visualize the hepatic sinusoids, and the parenchyma appears as a dark area (no autofluorescence of the parenchyma should be visible).
Critical Step
These steps (Steps 24–28) should be performed as fast as possible and are just one of the several ways for adjusting the z-stack settings.
-
25
The imaging is done through the intact liver capsule. Find and focus on the capsule and set this z as the baseline. For our equipment: in the “Hardware Controller” window, click on the cursor in the “Move” panel and position the z-step focus controller at 80 μm.
-
26
Focus by switching back to the epifluorescence mode, searching for fluorescent sporozoites/EEFs and defining the observation field such that there are a maximum of events in one field.
-
27
Once the parasites of interest have been chosen, switch back to the laser mode and define the z-stack. For our equipment: the depth of the focal plane is now controlled using the z-step controller. Using the z-step focus controller (positioned at 80 μm), move the focus toward the 0 μm position. When the first (most superficial) parasite appears, set the z-stack bottom limit to at least 5 μm before it is visible. Continue moving toward the 0 μm position. When the deepest parasite is out of focus, set the top limit of the z-stack.
Critical Step
It is better to avoid imaging the capsule of the liver lobe that is highly fluorescent and will overshadow the hepatic morphology observed at lower positions in a merged z-stack. If the capsule is acquired, the z-slice(s) can be removed during image analysis.
-
28
Adjust the exposure time and laser power for excitation at 488 and 647 nm.
Critical Step
The time of exposure and the binning should be adjusted so that a reasonable noise-to-signal ratio is obtained with an exposure time as low as possible to keep the time between two consecutive time points as short as possible. For the binning, at 2 × 2 instead of 1 × 1, the spatial resolution will be worse, but the luminosity is better, so the exposure time is shorter. The image at a binning of 2 × 2 should be of sufficient quality, and the data files are four times smaller.
Caution
To minimize damage by photobleaching, a balance must be found between laser power and exposure time.
Recording movies
-
29
Once the z-stack has been defined, set the length of recording and start recording. The value of this parameter depends on the objective of the experiment. For instance, to track sporozoites using our equipment: in the “Sequence Control” window, go to “Length (s)” option and set the recording time (we usually record movies of 600 s). The “Experiment” window should show the real-time acquisition.
Critical Step
Check if all parameters (laser, z-step, time of exposure) are properly set looking at the real-time images. If not, stop the acquisition; correct the parameter(s) and re-start recording.
-
30
When the time of acquisition is completed, check the quality of the recorded images. If the recorded images are of good quality (the parameters chosen are optimal) and the parasites are still visible with the same position values, another time lapse can be recorded. For our equipment: in the “Sequence Control” window, repeat Step 29 until the desired length of time is recorded.
-
31
At the end of the recording session, kill the mouse by dislocation of the neck, or according to national and institutional regulations.
Exporting the images
-
32
Export the images in an appropriate format for subsequent analysis. If the software being used does not allow for image analysis or you prefer to use different software for analysis, it is best to export images as .tif files, as different image acquisition software can generate incompatible end files.
Pause point
The stored images can be analyzed immediately or later.
Troubleshooting
Troubleshooting advice can be found in Table 1.
Timing
Steps 1 and 2, infection of mosquitoes and development of sporozoites: 18–22 days
Steps 3–9, dissecting infected mosquitoes: 30 min–1 h
Steps 10–14, experiment preparation: ∼30 min
Steps 15–21, preparation of the animal: maximum 30 min
Steps 22–28, blood flow labeling and microscope settings: a few minutes
Steps 29 and 30, time of recording: 30 min–2 h (depends on the experiment)
Step 32, export time (if necessary): ∼30 min (depends on the images taken)
Add at least 45 h between Steps 9 and 10 if studying late stages
Anticipated results
The output of imaging can take various forms; the most common is a video made by projecting the z information into a single image (frequently using a method called maximum intensity projection). The position in the z-axis is no longer known, so two cells may seem to be interacting, when in fact they are in two different z-positions. One way to avoid misinterpretation is to apply a color code to the images, based on the z-position. For instance, cells at a depth of 60–50 μm are colored in blue, 50–40 μm in red and so on. The output can also be presented as a series of images representing the z-stack or the time series. Sporozoites are highly motile cells; their trajectory and speed in different environments can be analyzed using the MultiTracker plugin in ImageJ. One example is given in Figure 3 and Supplementary Video 1 online. The trajectory of released merosomes can also be analyzed in this way. During later-stage studies, the analysis of the volume of merosome buds permits the estimation of how many merozoites are released per merosome. To do this, threshold the z-stacks and measure the parasite area in each stack. The area multiplied by the z-step gives a volume in pixels. This can then be transformed into micrometers cubed. The conversion of pixels into micrometers depends in part on the objective, the camera and the binning used, and these parameters must be taken into account. The study of the volume of schizonts and merosome buds could be criteria to analyze the development and infectivity of EEFs.

(a) Sporozoite movement in the liver. Motile sporozoites were recorded in the left hepatic lobe after intravenous injection of 106 sporozoites. The panel shows pseudo-colored maximum projections of confocal images (red: 5–25 min; green: 28–50 min; blue: 50–60 min). Kupffer cells, which appear as white dots in the periphery of the hepatic lobule, were labeled by intravenously injected fluorescent dextran. Yellow asterisks indicate the centers of the lobules. White arrowheads indicate sporozoites that arrived in the first 25 min and stayed in the same position until the end of the recording. The red arrow shows one parasite moving passively in the sinusoid. The white rectangle delimits the parasite analyzed in (b). Scale bar, 100 μm. (b) A sporozoite glides in the liver for more than 300 μm before arresting. The yellow diamond and the white square indicate the start and the end of the sporozoite's path. The graph to the left shows the velocity profile, with colors matching those of the projections; note the decreasing speed of sporozoite. Scale bar, 10 μm.
This protocol for imaging malaria parasites in the liver of rodents is based on the use of a high-speed spinning disk confocal microscope, which allows rapid acquisition without tissue damage. It permits the acquisition of images in four dimensions (volume + time) and thus to study the dynamic behavior of fluorescent Plasmodium parasites in the liver. The sporozoite, freshly inoculated by a mosquito, first glides in the liver sinusoids, then leaves the blood compartment by crossing the endothelial barrier and reaching the liver parenchyma, further traverses several hepatocytes and finally invades a final hepatocyte inside a parasitophorous vacuole, where the parasite can differentiate. Parasite differentiation lasts ∼50 h in vivo, consists of the formation of thousands of daughter cells inside the infected hepatocyte and culminates with their release into the blood via the formation and movement of merosomes. The protocol described here should be useful to better describe, quantitatively, each of these steps.
Examples of images acquired using this protocol are shown in Figures 3,4,5. Figures 3 and 4 document sporozoite gliding inside the liver. Figure 3a shows the movement of sporozoites recorded in the left lobe of the liver; the panel shows pseudo-colored maximum projections of confocal images (red: 5–25 min; green: 28–50 min; blue: 50–60 min). Figure 3b shows the velocity profile (left) as well as displacement (right) of a single sporozoite that glides in the liver for more than 300 μm before finally arresting. Figure 4 shows a time-lapse representation of a sporozoite gliding from the parenchyma into the sinusoid and back again into the parenchyma (see also Supplementary Video 2 online). Figure 5 and Supplementary Video 3 online show the release of merosomes from a mature exo-erythrocytic stage.

A sporozoite glides from the parenchyma into the sinusoid and back again into the parenchyma. The projected sporozoite movement for the time periods indicated on each panel is shown in yellow. The sinusoids (red) are labeled after intravenous injection of fluorescent BSA, which concentrates in cells exposed to the blood circulation, and the parenchyma corresponds to the black space between sinusoids. Scale bar, 10 μm.

Forty-eight hours after intravenous infection with sporozoites, the GFP-expressing parasites (green) are visualized in the hepatic tissue of a C57BL/6 mouse. The liver sinusoids are visualized using intravenously injected fluorescent BSA (red), and the hepatic parenchyma is visualized as a dark region. The images are composed of a z-projection of three z-stacks (covering 4 μm). Scale bar, 15 μm.
Such imaging approaches should lead to a better understanding of the primary infectious process of P. berghei/P. yoelii sporozoites in laboratory rodents. In addition, visualizing wild-type or mutant parasites in wild-type or mutant mice should also help in revealing the molecular basis of infection. Real-time in vivo imaging in the liver should also be valuable for visualizing anti-parasite immunity in context. The development of many mouse strains that produce fluorescent cell lines, such as myelomonocytic cells21, dendritic cells22 or natural killer cells23, will help to dissect the role of these cell types during parasitic infection. Similar approaches should also permit illumination of how protective immunity is achieved and how activated T cells interact with infected hepatocytes, or comparison of immune effectors against parasites in naïve or vaccinated animals. Ultimately, similar techniques might also be applied to study other host–parasite combinations, such as rodent parasites in their natural host (e.g., P. berghei–Grammomys surdaster) or primate systems, or P. falciparum in humanized mice grafted with human cells or tissues24.
Note: Supplementary information is available via the HTML version of this article.
References
Boyd, M.F. & Kitchen, S.F. The demonstration of sporozoites in human tissues. Am. J. Trop. Med. 9, 27–31 (1939).
Ponnudurai, T., Lensen, A.H., van Gemert, G.J., Bolmer, M.G. & Meuwissen, J.H. Feeding behaviour and sporozoite ejection by infected Anopheles stephensi. Trans. R. Soc. Trop. Med. Hyg. 85, 175–180 (1991).
Sidjanski, S. & Vanderberg, J.P. Delayed migration of Plasmodium sporozoites from the mosquito bite site to the blood. Am. J. Trop. Med. Hyg. 57, 426–429 (1997).
Vanderberg, J.P. & Frevert, U. Intravital microscopy demonstrating antibody-mediated immobilisation of Plasmodium berghei sporozoites injected into the skin by mosquitoes. Int. J. Parasitol. 9, 991–996 (2004).
Amino, R. et al. Quantitative imaging of Plasmodium transmission from mosquito to mammal. Nat. Med. 12, 220–224 (2006).
Prudencio, M., Rodriguez, A. & Mota, M.M. The silent path to thousands of merozoites: the Plasmodium liver stage. Nat. Rev. Microbiol. 11, 849–856 (2006).
Meis, J.F., Verhave, J.P., Jap, P.H. & Meuwissen, J.H. An ultrastructural study on the role of Kupffer cells in the process of infection by Plasmodium berghei sporozoites in rats. Parasitology 86, 231–242 (1983).
Meis, J.F. & Verhave, J.P. Exoerythrocytic development of malarial parasites. Adv. Parasitol. 27, 1–61 (1988).
Pradel, G. & Frevert, U. Malaria sporozoites actively enter and pass through rat Kupffer cells prior to hepatocyte invasion. Hepatology 33, 1154–1165 (2001).
Paddock, S.W. It was twenty years ago today: a celebration of optical sectioning. Biotechniques 35, 1156–1162 (2003).
Hell, S.W. Toward fluorescence nanoscopy. Nat. Biotechnol. 21, 1347–1355 (2003).
White, N. & Errington, R. Multi-photon microscopy: seeing more by imaging less. Biotechniques 33, 298–305 (2002).
Nakano, A. Spinning-disk confocal microscopy: a cutting-edge tool for imaging of membrane traffic. Cell Struct. Funct. 27, 349–355 (2002).
Natarajan, R. et al. Fluorescent Plasmodium berghei sporozoites and pre-erythrocytic stages: a new tool to study mosquito and mammalian host interactions with malaria parasites. Cell Microbiol. 3, 371–379 (2001).
Franke-Fayard, B. et al. A Plasmodium berghei reference line that constitutively expresses GFP at a high level throughout the complete life cycle. Mol. Biochem. Parasitol. 137, 23–33 (2004).
Tarun, A.S. et al. Quantitative isolation and in vivo imaging of malaria parasite liver stages. Int. J. Parasitol. 36, 1283–1293 (2006).
Frevert, U. et al. Intravital observation of Plasmodium berghei sporozoite infection of the liver. PLoS Biol. 3, e192 (2005).
Sturm, A. et al. Manipulation of host hepatocytes by the malaria parasite for delivery into liver sinusoids. Science 313, 1287–1290 (2006).
Ishino, T., Orito, Y., Chinzei, Y. & Yuda, M. A calcium-dependent protein kinase regulates Plasmodium ookinete access to the midgut epithelial cell. Mol. Microbiol. 59, 1175–1184 (2006).
Sinden, R.E. et al. Maintenance of the Plasmodium berghei life cycle. Methods Mol. Med. 72, 25–40 (2002).
Faust, N., Varas, F., Kelly, L.M., Heck, S. & Graf, T. Insertion of enhanced green fluorescent protein into the lysozyme gene creates mice with green fluorescent granulocytes and macrophages. Blood 96, 719–726 (2000).
Lindquist, R.L. et al. Visualising dendritic cell networks in vivo. Nat. Immunol. 5, 1243–1250 (2004).
Stetson, D.B. et al. Constitutive cytokine mRNAs mark natural killer (NK) and NK T cells poised for rapid effector function. J. Exp. Med. 198, 1069–1076 (2003).
Melkus, M.W. et al. Humanized mice mount specific adaptive and innate immune responses to EBV and TSST-1. Nat. Med. 12, 1316–1322 (2006).
Acknowledgements
We thank G. Milon, F. Frischknecht and P. Brey for experimental advice; A. Genovesio, C. Zimmer and J.C. Olivo-Marin for helping with tracking analysis; E. Perret, P. Roux, M. Marchand and C. Machu for helping with imaging; C. Bourgouin, I. Thiéry and the other members of the Center for Production and Infection of Anopheles for rearing the mosquitoes; and B. Franke-Fayard, A. Waters and C. Janse for providing the PbGFPCON parasite. This work was supported by funds from the Pasteur Institute (Strategic project “Grand Programme Horizontal Anopheles”), the Howard Hughes Medical Institute and the European Commission (FP6 BioMalPar Network of Excellence). S.B. is financed by a Roux fellowship (Institut Pasteur).
Author information
Authors and Affiliations
Corresponding authors
Ethics declarations
Competing interests
The authors declare no competing financial interests.
Supplementary information
Supplementary Fig. 1
Snapshot of the Image Suite software as used during acquisition (PDF 3933 kb)
Supplementary Video 1
Sporozoite motility in the liver (corresponding to Figure 3) (MOV 20409 kb)
Supplementary Video 2
Sporozoite motility in liver parenchyma (corresponding to Figure 4) (MOV 3545 kb)
Supplementary Video 3
Release of merosome buds (corresponding to Figure 5) (MOV 3685 kb)
Rights and permissions
About this article
Cite this article
Thiberge, S., Blazquez, S., Baldacci, P. et al. In vivo imaging of malaria parasites in the murine liver. Nat Protoc 2, 1811–1818 (2007). https://doi.org/10.1038/nprot.2007.257
Published:
Issue Date:
DOI: https://doi.org/10.1038/nprot.2007.257
This article is cited by
-
Shedding of host autophagic proteins from the parasitophorous vacuolar membrane of Plasmodium berghei
Scientific Reports (2017)
-
Imaging liver biology in vivo using conventional confocal microscopy
Nature Protocols (2015)
-
Assessment of the prophylactic activity and pharmacokinetic profile of oral tafenoquine compared to primaquine for inhibition of liver stage malaria infections
Malaria Journal (2014)
-
Looking under the skin: the first steps in malarial infection and immunity
Nature Reviews Microbiology (2013)
-
Apical membrane antigen 1 mediates apicomplexan parasite attachment but is dispensable for host cell invasion
Nature Communications (2013)
Comments
By submitting a comment you agree to abide by our Terms and Community Guidelines. If you find something abusive or that does not comply with our terms or guidelines please flag it as inappropriate.
