
Abstract
R1a-M420 is one of the most widely spread Y-chromosome haplogroups; however, its substructure within Europe and Asia has remained poorly characterized. Using a panel of 16 244 male subjects from 126 populations sampled across Eurasia, we identified 2923 R1a-M420 Y-chromosomes and analyzed them to a highly granular phylogeographic resolution. Whole Y-chromosome sequence analysis of eight R1a and five R1b individuals suggests a divergence time of ∼25 000 (95% CI: 21 300–29 000) years ago and a coalescence time within R1a-M417 of ∼5800 (95% CI: 4800–6800) years. The spatial frequency distributions of R1a sub-haplogroups conclusively indicate two major groups, one found primarily in Europe and the other confined to Central and South Asia. Beyond the major European versus Asian dichotomy, we describe several younger sub-haplogroups. Based on spatial distributions and diversity patterns within the R1a-M420 clade, particularly rare basal branches detected primarily within Iran and eastern Turkey, we conclude that the initial episodes of haplogroup R1a diversification likely occurred in the vicinity of present-day Iran.
Introduction
High-throughput resequencing efforts have uncovered thousands of Y-chromosome variants that have enhanced our understanding of this most informative locus’ phylogeny, both through the resolution of topological ambiguities and by enabling unbiased estimation of branch lengths, which, in turn, permit timing estimates.1, 2, 3, 4, 5 The International Society of Genetic Genealogy10 has aggregated these variants and those discovered with previous technologies into a public resource that population surveys can leverage to further elucidate the geographic origins of and structure within haplogroups.6, 7, 8, 9, 10, 11, 12, 13
Y-chromosome haplogroup R (hg R) is one of 20 that comprise the standardized global phylogeny.14 It consists of two main components: R1-M173 and R2-M47915 (Figure 1). Within R1-M173, most variation extant in Eurasia is confined to R1a-M420 and R1b-M343.16 In Europe, R1a is most frequent in the east, and R1b predominates in the west.17 It has been suggested that this division reflects episodic population expansions during the post-glacial period, including those associated with the establishment of agricultural/pastoral economies.3, 18, 19, 20, 21
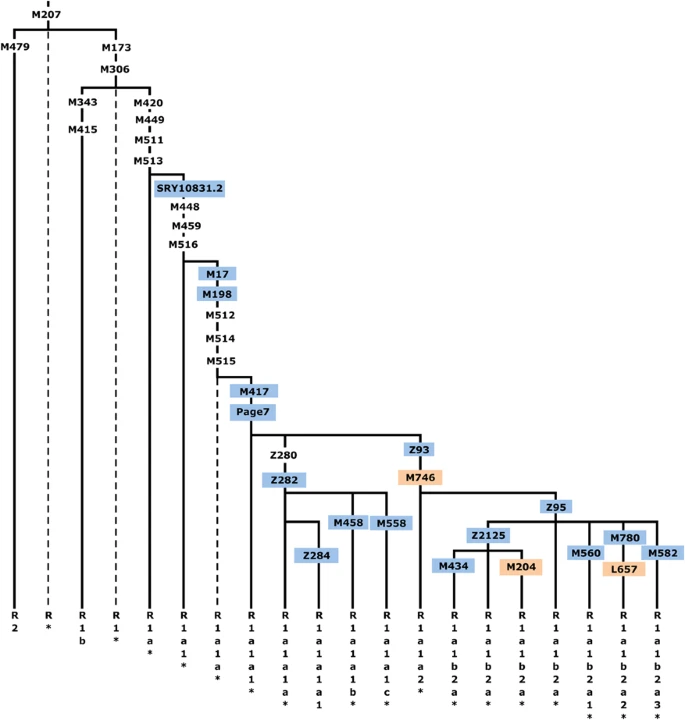
Haplogroup (hg) R1a-M420 topology, shown within the context of hg R-M207. Common names of the SNPs discussed in this study are shown along the branches, with those genotyped presented in color and those for which phylogenetic placement was previously unknown in orange. Hg labels are assigned according to YCC nomenclature principles with an asterisk (*) denoting a paragroup.63 Dashed lines indicate lineages not observed in our sample. The marker Z280 was not used as it maps to duplicated ampliconic tracts.
More than 10% of men in a region extending from South Asia to Scandinavia share a common ancestor in hg R1a-M420, and the vast majority fall within the R1a1-M17/M198 subclade.22 Although the phylogeography of R1b-M343 has been described, especially in Western and Central Europe,15, 23, 24, 25 R1a1 has remained poorly characterized. Previous work has been limited to a European-specific subgroup defined by the single-nucleotide polymorphism (SNP) called M458.22, 26, 27, 28, 29, 30 However, with the discovery of the Z280 and Z93 substitutions within Phase 1 1000 Genomes Project data1 and subsequent genotyping of these SNPs in ∼200 samples, a schism between European and Asian R1a chromosomes has emerged.31 We have evaluated this division in a larger panel of populations, estimated the split time, and mapped the distributions of downstream sub-hgs within seven regions: Western/Northern Europe, Eastern Europe, Central/South Europe, the Near/Middle East, the Caucasus, South Asia, and Central Asia/Southern Siberia.
Materials and methods
Population samples
We assembled a genotyping panel of 16 244 males from 126 Eurasian populations, some of which we report upon for the first time herein and others that we have combined from earlier studies,22, 29, 30, 32, 33, 34, 35, 36, 37, 38, 39, 40, 41, 42, 43, 44, 45 and updated to a higher level of phylogenetic resolution. All samples were obtained using locally approved informed consent and were de-identified.
Whole Y-chromosome sequencing
We analyzed 13 whole R1 Y-chromosome sequences: 8 novel, 2 previously published,4 and 3 from the 1000 Genomes Project.2 All sequences were generated on the Illumina HiSeq platform (Illumina, San Diego, CA, USA) using libraries prepared either from genomic DNA or from flow sorted Y-chromosomes drawn from lymphoblast cell line cultures induced to the metaphase cell division stage (Supplementary Table 1). We used Bowtie46 to map 101-bp sequencing reads to the hg19 human reference, and we called genotypes across 9.99 Mb and estimated coalescence times using a rate of 1 SNP accumulating per 122 years as described in Poznik et al.4
SNP analysis
We selected binary markers (Supplementary Table 2) from the International Society of Genetic Genealogy10 database and from whole Y-chromosome sequencing and genotyped samples either by direct Sanger sequencing or RFLP assays. Within the full panel, 2923 individuals were found to be members of hg R1a-M420. These M420 carriers were then genotyped in a hierarchical manner (Figure 1) for the following downstream markers with known placement on the tree: SRY10831.2, M17, M198, M417, Page7, Z282/S198, Z284/S221, M458, M558/CTS3607, Z93/S202, Z95, Z2125, M434, M560, M780, M582, and for three SNPs whose placement within the R1a topology was previously unknown: M746, M204, and L657.
We generated spatial frequency maps for the R1a subgroups that we determined to occur at 10% frequency or greater within a studied region. To do so, we used Surfer (v.8, Golden Software, Inc, Golden, CO, USA) with the kriging algorithm and the option to use bodies of water as break-lines. We carried out spatial autocorrelation analysis to detect clines by calculating Moran’s I coefficient using PASSAGE v.1.1 (www.passagesoftware.net) with a binary weight matrix, 10 distance classes, and the assumption of a random distribution. Haplogroup diversities were calculated using the method of Nei.47 To investigate the genetic affinities among populations, we used the freeware popSTR program (http://harpending.humanevo.utah.edu/popstr/) to perform a principal component analysis (PCA) based on R1a subgroup frequencies.
Short tandem repeat (STR) analysis
We genotyped 1355 samples for 10–19 STRs (Y-STRs; Supplementary Table 3) and calculated haplotype diversities, also using the method of Nei.47 Coalescence times (Td) of R1a subhaplogroups were estimated using the ASD0 methodology described by Zhivotovsky et al48 and modified according to Sengupta et al.41 Given the uncertainty associated with Y-STR mutation rates,24 we used both the evolutionary effective mutation rate of 6.9 × 10⁻⁴ per 25 years48 and, for comparison, the pedigree mutation rate of 2.5 × 10⁻³ per generation.49
Results and Discussion
Refinement of hg R1a topology
Figure 1 shows, in context, the phylogenetic relationships of the markers we genotyped in this study. These include three for which phylogenetic placement was previously unknown: M746, M204, and L657. We localized the rare M204 SNP based on a single Iranian sample confirmed by Sanger sequencing to carry the derived allele.37, 50
Phylogeography
We measured R1a haplogroup frequency by population (Supplementary Table 4). Of the 2923 hg R1a-M420 samples, 2893 were derived for the M417/Page7 mutations (1693 non-Roma Europeans and 1200 pan-Asians), whereas the more basal subgroups were rare. We observed just 24 R1a*-M420(xSRY10831.2), 6 R1a1*-SRY10831.2(xM198), and 12 R1a1a1-M417/Page7*(xZ282,Z93). We did not observe a single instance of R1a1a-M198*(xM417,Page7), but we cannot exclude the possibility of its existence.
Of the 1693 European R1a-M417/Page7 samples, more than 96% were assigned to R1a-Z282 (Figure 2), whereas 98.4% of the 490 Central and South Asian R1a lineages belonged to hg R1a-Z93 (Figure 3), consistent with the previously proposed trend.31 Both of these haplogroups were found among Near/Middle East and Caucasus populations comprising 560 samples.
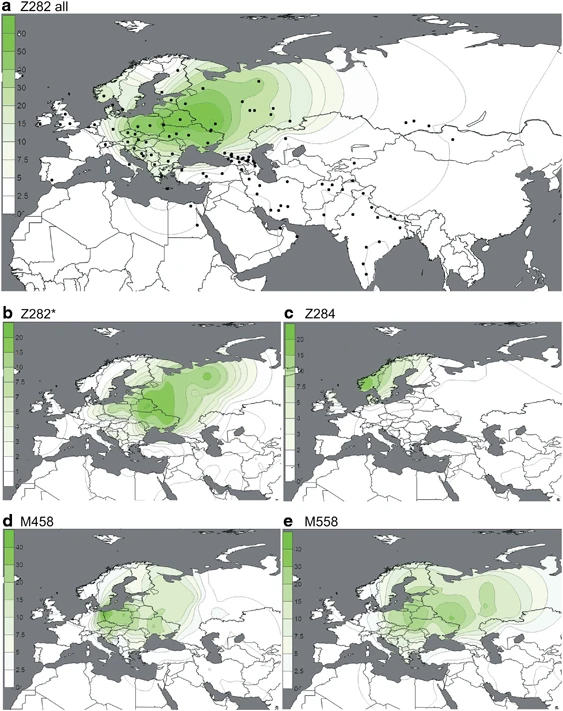
(a–e) Spatial frequency distributions of Z282 affiliated haplogroups. Each map was generated using the frequencies from Supplementary Table 4 among 14 461 individuals, distributed across 119 population samples (references listed in Supplementary Table 4). Because of the known difference between the origin and present distribution of the Roma and Jewish populations, they were excluded from the plots. Additional populations from literature27 were used for the M458 map.
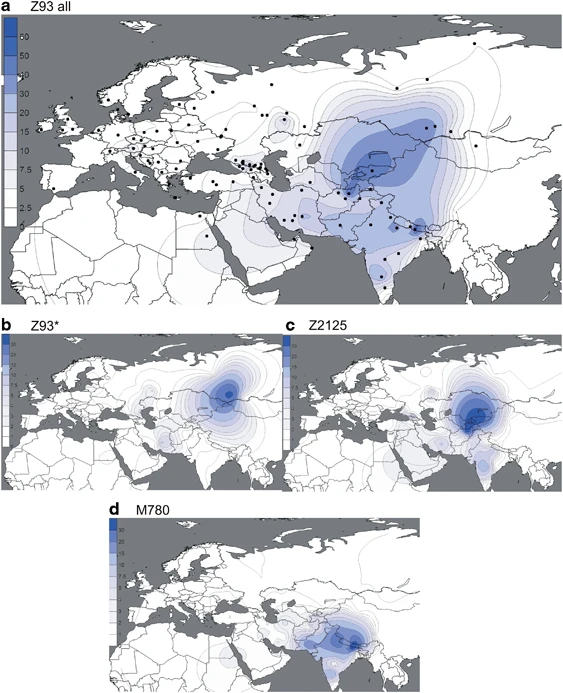
(a–d) Spatial frequency distributions of Z93 affiliated haplogroups. Maps were generated as described in Figure 2.
Subgroups of both R1a-Z282 and R1a-Z93 exhibit geographic localization within the broad distribution zone of R1a-M417/Page7. Among R1a-Z282 subgroups (Figure 2), the highest frequencies (∼20%) of paragroup R1a-Z282* chromosomes occur in northern Ukraine, Belarus, and Russia (Figure 2b). The R1a-Z284 subgroup (Figure 2c) is confined to Northwest Europe and peaks at ∼20% in Norway, where the majority of R1a chromosomes (24/26) belong to this clade. We found R1a-Z284 to be extremely rare outside Scandinavia. R1a-M458 (Figure 2d) and R1a-M558 (Figure 2e) have similar distributions, with the highest frequencies observed in Central and Eastern Europe. R1a-M458 exceeds 20% in the Czech Republic, Slovakia, Poland, and Western Belarus. The lineage averages 11–15% across Russia and Ukraine and occurs at 7% or less elsewhere (Figure 2d). Unlike hg R1a-M458, the R1a-M558 clade is also common in the Volga-Uralic populations. R1a-M558 occurs at 10–33% in parts of Russia, exceeds 26% in Poland and Western Belarus, and varies between 10 and 23% in the Ukraine, whereas it drops 10-fold lower in Western Europe. In general, both R1a-M458 and R1a-M558 occur at low but informative frequencies in Balkan populations with known Slavonic heritage. The rarity of R1a-M458 and R1a-M558 among Central Asian and South Siberian R1a samples (4/301; Supplementary Table 4) suggests low levels of historic Slavic gene flow.
In the complementary R1a-Z93 haplogroup, the paragroup R1a-Z93* (Figure 3b) is most common (>30%) in the South Siberian Altai region of Russia, but it also occurs in Kyrgyzstan (6%) and in all Iranian populations (1–8%). R1a-Z2125 (Figure 3c) occurs at highest frequencies in Kyrgyzstan and in Afghan Pashtuns (>40%). We also observed it at greater than 10% frequency in other Afghan ethnic groups and in some populations in the Caucasus and Iran. Notably, R1a-M780 (Figure 3d) occurs at high frequency in South Asia: India, Pakistan, Afghanistan, and the Himalayas. The group also occurs at >3% in some Iranian populations and is present at >30% in Roma from Croatia and Hungary, consistent with previous studies reporting the presence of R1a-Z93 in Roma.31, 51 Finally, the rare R1a-M560 was only observed in four samples: two Burushaski speakers from north Pakistan, one Hazara from Afghanistan, and one Iranian Azeri.
Y-STR haplotype networks and diversity
We genotyped a subset of 1355 R1a samples for 10–19 Y-chromosome STR loci (Supplementary Table 3) and constructed networks for both hg R1a-Z282 and hg R1a-Z93 (Supplementary Figure 1 and Supplementary Figure 2). Although we could assign haplotypes to various haplogroups, power to identify substructure within hg R1a-M198 was limited, consistent with previous work.22, 52 Although haplotype diversity is generally very high (H>0.95) in all haplogroups (Supplementary Table 3), lower diversities occur in south Siberian paragroup R1a-Z93* (H=0.921), in Jewish R1a-M582 (H=0.844) and in Roma R1a-M780 (H=0.759), consistent with founder effects that are evident in the network patterns for these populations (Supplementary Figure 2).
Origin of hg R1a
To infer the geographic origin of hg R1a-M420, we identified populations harboring at least one of the two most basal haplogroups and possessing high haplogroup diversity. Among the 120 populations with sample sizes of at least 50 individuals and with at least 10% occurrence of R1a, just 6 met these criteria, and 5 of these 6 populations reside in modern-day Iran. Haplogroup diversities among the six populations ranged from 0.78 to 0.86 (Supplementary Table 4). Of the 24 R1a-M420*(xSRY10831.2) chromosomes in our data set, 18 were sampled in Iran and 3 were from eastern Turkey. Similarly, five of the six observed R1a1-SRY10831.2*(xM417/Page7) chromosomes were also from Iran, with the sixth occurring in a Kabardin individual from the Caucasus. Owing to the prevalence of basal lineages and the high levels of haplogroup diversities in the region, we find a compelling case for the Middle East, possibly near present-day Iran, as the geographic origin of hg R1a.
Spatial dynamics of R1a lineage frequencies
We conducted a spatial autocorrelation analysis of the two primary subgroups of R1a (Z282 and Z93) and of each of their subgroups independently (Supplementary Figure 3). Each correlogram was statistically significant. We observed clinal distributions (continually decreasing frequency with increasing geographic distance) across a large geographic area in the two macrogroups and in M558 and M780 as well. One group (Z2125) did not reveal any discernible pattern, and the analysis of four groups (Z282*, Z284, M458, and Z93*) indicated potential clinal distributions that do not extend across the full geographic range under study. Therefore, we also analyzed partial ranges for Z282* and M458 in Europe, the Caucasus, and the Middle East, and for Z284 in Europe, but these partial range analyses also failed to yield evidence of clinal distributions.
We also conducted PCA of R1a subgroups (Figure 4). The first principal component explains 21% of the variation and separates European populations at one extreme from those of South Asia at the other. The second explains 14.7% of the variation and is driven almost exclusively by the high presence of M582 among some Jewish populations, particularly the Ashkenazi Jews. PC2 separates them from all other populations. When we consider haplogroups rather than populations (Supplementary Figure 4), we see that the clustering of European populations is due to their high frequencies of M558, M458, and Z282*, whereas the M780 and Z2125* lineages account for the South Asian character of the other extreme.
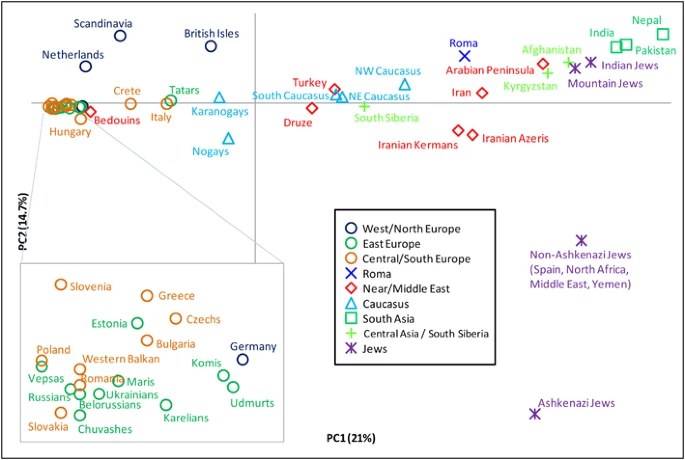
Principal component analysis of hg R1a subclades. The plot was obtained by collapsing the 126 populations into 49 regionally/culturally defined groups and calculating R1a subclade frequencies relative to R1a-M198. We excluded one population with small overall sample size and all populations in which fewer than 5 R1a Y-chromosomes were observed.
To put our frequency distribution maps, PCA analyses, and autocorrelation results in archaeological context, we note that the earliest R1a lineages (genotyped at just SRY10381.2) found thus far in European ancient DNA date to 4600 years before present (YBP), a time corresponding to the Corded Ware Culture,53 whereas three DNA sample extracts from the earlier Neolithic Linear Pottery Culture (7500–6500 YBP) period were reported as G2a-P15 and F-M89(xP-M45) lineages.54 This raises the possibility of a wide and rapid spread of R1a-Z282-related lineages being associated with prevalent Copper and Early Bronze Age societies that ranged from the Rhine River in the west to the Volga River in the east55 including the Bronze Age Proto-Slavic culture that arose in Central Europe near the Vistula River.56 It may have been in this cultural context that hg R1a-Z282 diversified in Central and Eastern Europe. The corresponding diversification in the Middle East and South Asia is more obscure. However, early urbanization within the Indus Valley also occurred at this time57 and the geographic distribution of R1a-M780 (Figure 3d) may reflect this.
To evaluate the potential role of R1a diversification in these post-Neolithic events, we took two approaches toward estimating the time to the most recent common ancestor (TMRCA). The first was a Y-STR-based coalescent time estimation, the results of which (Supplementary Table 5) demonstrate the unsuitability of the pedigree mutation rate, as supported also by the evidence in Wei et al,3 the ages being severely underestimated. Alternatively times based on the evolutionary mutation rate,48 which is prone to overestimation, should be regarded as the upper bounds on the sub-hg dispersals. The second approach was TMRCA estimation based on whole Y-chromosome sequencing data.
Whole Y-chromosome sequences from R1a and R1b: TMRCA estimates
The SNPs that we genotyped across 126 populations reveal considerable information about the topology of the haplogroup tree, but they were ascertained in a biased manner, and they are too few in number to convey any meaningful branch-length information. Hence, our SNP genotyping results are devoid of temporal information. To obtain unbiased branch lengths to estimate TMRCA, we analyzed whole Y-chromosome sequences (9.99 Mb of which were usable) of 13 individuals: 8 R1a and 5 R1b. We used MEGA57 to construct a bootstrap consensus maximum likelihood tree (Figure 5) based on 928 R1 SNPs (Supplementary Data File 1), of which 462 were previously named.10 To define the ancestral and derived states of SNPs corresponding to the roots of the R1a and R1b subtrees (branches 23 and 8 in Figure 5, respectively), we called genotypes and constructed the tree jointly with previously published hg E sequences,4 which constituted an outgroup.
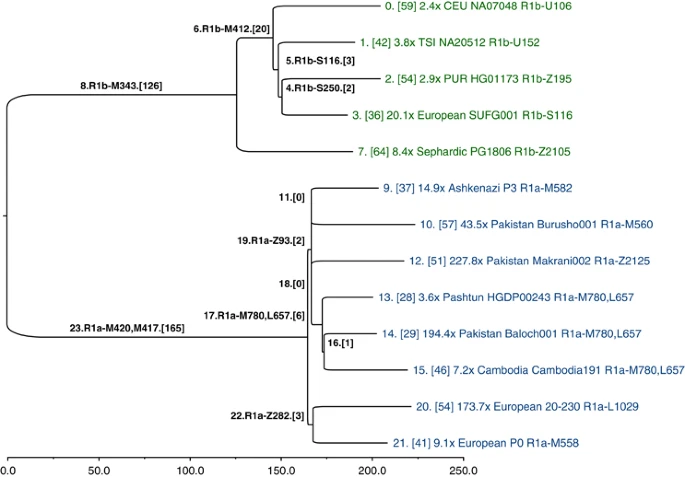
Y-chromosome phylogeny inferred from 13 ∼10-Mb sequences of hg R individuals. Branches are drawn proportional to the number of derived variants. Each of the 24 branches is labeled by an index, and the number of SNPs assigned to the branch is shown in brackets. The tips of the tree are labeled with sequencing coverage, population, ID, and the most derived commonly known SNP observed in the corresponding sample.
A consensus has not yet been reached on the rate at which Y-chromosome SNPs accumulate within this 9.99 Mb sequence. Recent estimates include one SNP per: ∼100 years,58 122 years,4 151 years5 (deep sequencing reanalysis rate), and 162 years.59 Using a rate of one SNP per 122 years, and based on an average branch length of 206 SNPs from the common ancestor of the 13 sequences, we estimate the bifurcation of R1 into R1a and R1b to have occurred ∼25 100 ago (95% CI: 21 300–29 000). Using the 8 R1a lineages, with an average length of 48 SNPs accumulated since the common ancestor, we estimate the splintering of R1a-M417 to have occurred rather recently, ∼5800 years ago (95% CI: 4800–6800). The slowest mutation rate estimate would inflate these time estimates by one-third, and the fastest would deflate them by 17%.
With reference to Figure 1, all fully sequenced R1a individuals share SNPs from M420 to M417. Below branch 23 in Figure 5, we see a split between Europeans, defined by Z282 (branch 22), and Asians, defined by Z93 and M746 (branch 19; Z95, which was used in the population survey, would also map to branch 19, but it falls just outside an inclusion boundary for the sequencing data4). Star-like branching near the root of the Asian subtree suggests rapid growth and dispersal. The four subhaplogroups of Z93 (branches 9-M582, 10-M560, 12-Z2125, and 17-M780, L657) constitute a multifurcation unresolved by 10 Mb of sequencing; it is likely that no further resolution of this part of the tree will be possible with current technology. Similarly, the shared European branch has just three SNPs.
We caution against ascribing findings from a contemporary phylogenetic cluster of a single genetic locus to a particular pre-historic demographic event, population migration, or cultural transformation. The R1a TMRCA estimates we report have wide confidence intervals and should be viewed as preliminary; one must sequence tens of additional R1a samples to high coverage to uncover additional informative substructure and to bolster the accuracy of the branch lengths associated with the more terminal portions of the phylogeny. Although some of the SNPs on the lineages we have defined by single SNPs are undoubtedly rare (eg, the Z2125 sub-hg M434, Figure 1, Supplementary Table 4), it remains possible that future genotyping effort using the SNPs in Supplementary Data File 1 may expose other substructure at substantial frequency, commensurate with more recent episodes of population growth and movement. In addition, high coverage sequences using multiple male pedigrees sampled across various haplogroups in the global Y phylogeny will be needed to more accurately estimate the Y-chromosome mutation rate. Nonetheless, despite the limitations of our small sample of R1a sequences, the relative shortness of the branches and their geographic distributions are consistent with a model of recent R1a diversification coincident with range expansions and population growth across Eurasia.
Conclusion
Our phylogeographic data lead us to conclude that the initial episodes of R1a-M420 diversification occurred in the vicinity of Iran and Eastern Turkey, and we estimate that diversification downstream of M417/Page7 occurred ∼5800 years ago. This suggests the possibility that R1a lineages accompanied demic expansions initiated during the Copper, Bronze, and Iron ages, partially replacing previous Y-chromosome strata, an interpretation consistent with albeit limited ancient DNA evidence.54, 60 However, our data do not enable us to directly ascribe the patterns of R1a geographic spread to specific prehistoric cultures or more recent demographic events. High-throughput sequencing studies of more R1a lineages will lead to further insight into the structure of the underlying tree, and ancient DNA specimens will help adjudicate the molecular clock calibration. Together these advancements will yield more refined inferences about pre-historic dispersals of peoples, their material cultures, and languages.57, 61, 62
References
Altshuler D, Durbin RM, Abecasis GR et al: A map of human genome variation from population-scale sequencing. Nature 2010; 467: 1061–1073.
Altshuler DM, Durbin RM, Abecasis GR et al: An integrated map of genetic variation from 1,092 human genomes. Nature 2012; 491: 56–65.
Wei W, Ayub Q, Chen Y et al: A calibrated human Y-chromosomal phylogeny based on resequencing. Genome Res 2013; 23: 388–395.
Poznik GD, Henn BM, Yee MC et al: Sequencing Y chromosomes resolves discrepancy in time to common ancestor of males versus females. Science 2013; 341: 562–565.
Francalacci P, Morelli L, Angius A et al: Low-pass DNA sequencing of 1200 Sardinians reconstructs European Y-chromosome phylogeny. Science 2013; 341: 565–569.
Sims LM, Garvey D, Ballantyne J : Sub-populations within the major European and African derived haplogroups R1b3 and E3a are differentiated by previously phylogenetically undefined Y-SNPs. Hum Mutat 2007; 28: 97.
Niederstätter H, Berger B, Erhart D, Parson W : Recently introduced Y-SNPs improve the resolution within Y-chromosome haplogroup R1b in a central European population sample (Tyrol, Austria). Forensic Sci Int Genet Suppl Series 2008; 1: 226–227.
Sims LM, Garvey D, Ballantyne J : Improved resolution haplogroup G phylogeny in the Y chromosome, revealed by a set of newly characterized SNPs. PLoS One 2009; 4: e5792.
Rocca RA, Magoon G, Reynolds DF et al: Discovery of Western European R1b1a2 Y chromosome variants in 1000 Genomes Project Data: an online community approach. PLoS One 2012; 7: e41634.
International Society of Genetic Genealogy http://www.isogg.org/tree/, 2013.
Rootsi S, Magri C, Kivisild T et al: Phylogeography of Y-chromosome haplogroup I reveals distinct domains of prehistoric gene flow in Europe. Am J Hum Genet 2004; 75: 128–137.
Rootsi S, Zhivotovsky LA, Baldovic M et al: A counter-clockwise northern route of the Y-chromosome haplogroup N from Southeast Asia towards Europe. Eur J Hum Genet 2007; 15: 204–211.
Rootsi S, Myres NM, Lin AA et al: Distinguishing the co-ancestries of haplogroup G Y-chromosomes in the populations of Europe and the Caucasus. Eur J Hum Genet 2012; 20: 1275–1282.
Karafet TM, Mendez FL, Meilerman MB, Underhill PA, Zegura SL, Hammer MF : New binary polymorphisms reshape and increase resolution of the human Y chromosomal haplogroup tree. Genome Res 2008; 18: 830–838.
Myres NM, Rootsi S, Lin AA et al: A major Y-chromosome haplogroup R1b Holocene era founder effect in Central and Western Europe. Eur J Hum Genet 2011; 19: 95–101.
Chiaroni J, Underhill PA, Cavalli-Sforza LL : Y chromosome diversity, human expansion, drift, and cultural evolution. Proc Natl Acad Sci USA 2009; 106: 20174–20179.
Kayser M, Lao O, Anslinger K et al: Significant genetic differentiation between Poland and Germany follows present-day political borders, as revealed by Y-chromosome analysis. Hum Genet 2005; 117: 428–443.
Arredi B, Poloni ES, Tyler-Smith C : The peopling of Europe; in Crawford MH (ed): Anthropological Genetics: Theory, Methods and Applications. Cambridge: Cambridge University Press, 2007, pp 380–408.
Balaresque P, Bowden GR, Adams SM et al: A predominantly neolithic origin for european paternal lineages. PLoS Biol 2010; 8: e1000285.
Gignoux CR, Henn BM, Mountain JL : Rapid, global demographic expansions after the origins of agriculture. Proc Natl Acad Sci USA 2011; 108: 6044–6049.
Pinhasi R, Thomas MG, Hofreiter M, Currat M, Burger J : The genetic history of Europeans. Trends Genet 2012; 28: 496–505.
Underhill PA, Myres NM, Rootsi S et al: Separating the post-Glacial coancestry of European and Asian Y chromosomes within haplogroup R1a. Eur J Hum Genet 2010; 18: 479–484.
Cruciani F, Trombetta B, Antonelli C et al: Strong intra- and inter-continental differentiation revealed by Y chromosome SNPs M269, U106 and U152. Forensic Sci Int Gentic 2011; 5: E49–E52.
Busby GB, Brisighelli F, Sanchez-Diz P et al: The peopling of Europe and the cautionary tale of Y chromosome lineage R-M269. Proc Biol Sci 2012; 279: 884–892.
Larmuseau MH, Vanderheyden N, Van Geystelen A, van Oven M, Kayser M, Decorte R : Increasing phylogenetic resolution still informative for Y chromosomal studies on West-European populations. Forensic Sci Int Genet 2013; 9: 179–185.
Balanovsky O, Dibirova K, Dybo A et al: Parallel evolution of genes and languages in the Caucasus region. Mol Biol Evol 2011; 28: 2905–2920.
Rebala K, Martinez-Cruz B, Tonjes A et al: Contemporary paternal genetic landscape of Polish and German populations: from early medieval Slavic expansion to post-World War II resettlements. Eur J Hum Genet 2013; 21: 415–422.
Varzari A, Kharkov V, Nikitin AG et al: Paleo-Balkan and Slavic contributions to the genetic pool of Moldavians: insights from the Y chromosome. PLoS One 2013; 8: e53731.
Karachanak S, Grugni V, Fornarino S et al: Y-chromosome diversity in modern Bulgarians: new clues about their ancestry. PLoS One 2013; 8: e56779.
Kushniarevich A, Sivitskaya L, Danilenko N et al: Uniparental genetic heritage of Belarusians: encounter of rare Middle Eastern Matrilineages with a Central European mitochondrial DNA pool. PLoS One 2013; 8: e66499.
Pamjav H, Feher T, Nemeth E, Padar Z : Brief communication: new Y-chromosome binary markers improve phylogenetic resolution within haplogroup R1a1. Am J Phys Anthropol 2012; 149: 611–615.
King RJ, Ozcan SS, Carter T et al: Differential Y-chromosome Anatolian influences on the Greek and Cretan Neolithic. Ann Hum Genet 2008; 72: 205–214.
Martinez L, Underhill PA, Zhivotovsky LA et al: Paleolithic Y-haplogroup heritage predominates in a Cretan highland plateau. Eur J Hum Genet 2007; 15: 485–493.
Cinnioglu C, King R, Kivisild T et al: Excavating Y-chromosome haplotype strata in Anatolia. Hum Genet 2004; 114: 127–148.
Luis JR, Rowold DJ, Regueiro M et al: The Levant versus the Horn of Africa: evidence for bidirectional corridors of human migrations. Am J Hum Genet 2004; 74: 532–544.
Cadenas AM, Zhivotovsky LA, Cavalli-Sforza LL, Underhill PA, Herrera RJ : Y-chromosome diversity characterizes the Gulf of Oman. Eur J Hum Genet 2008; 16: 374–386.
Regueiro M, Cadenas AM, Gayden T, Underhill PA, Herrera RJ : Iran: tricontinental nexus for Y-chromosome driven migration. Hum Hered 2006; 61: 132–143.
Di Cristofaro J, Pennarun E, Mazieres S et al: Afghan Hindu Kush: Where Eurasian sub-continent gene flows converge. PLoS One 2013; 8: e76748.
Grugni V, Battaglia V, Hooshiar Kashani B et al: Ancient migratory events in the Middle East: new clues from the Y-chromosome variation of modern Iranians. PLoS One 2012; 7: e41252.
Chiaroni J, King RJ, Myres NM et al: The emergence of Y-chromosome haplogroup J1e among Arabic-speaking populations. Eur J Hum Genet 2010; 18: 348–353.
Sengupta S, Zhivotovsky LA, King R et al: Polarity and temporality of high-resolution y-chromosome distributions in India identify both indigenous and exogenous expansions and reveal minor genetic influence of Central Asian pastoralists. Am J Hum Genet 2006; 78: 202–221.
Fornarino S, Pala M, Battaglia V et al: Mitochondrial and Y-chromosome diversity of the Tharus (Nepal): a reservoir of genetic variation. BMC Evol Biol 2009; 9: 154.
Behar DM, Thomas MG, Skorecki K et al: Multiple origins of Ashkenazi Levites: Y chromosome evidence for both near Eastern and European ancestries. Am J Hum Genet 2003; 73: 768–779.
Behar DM, Yunusbayev B, Metspalu M et al: The genome-wide structure of the Jewish people. Nature 2010; 466: 238–242.
Rootsi S, Behar DM, Jarve M et al: Phylogenetic applications of whole Y-chromosome sequences and the Near Eastern origin of Ashkenazi Levites. Nat Commun 2013; 4: 2928.
Langmead B, Trapnell C, Pop M, Salzberg SL : Ultrafast and memory-efficient alignment of short DNA sequences to the human genome. Genome Biol 2009; 10: R25.
Nei M : Molecular Evolutionary Genetics. New York: Columbia University Press, 1987.
Zhivotovsky LA, Underhill PA, Cinnioglu C et al: The effective mutation rate at Y chromosome short tandem repeats, with application to human population-divergence time. Am J Hum Genet 2004; 74: 50–61.
Goedbloed M, Vermeulen M, Fang RN et al: Comprehensive mutation analysis of 17 Y-chromosomal short tandem repeat polymorphisms included in the AmpFlSTR Yfiler PCR amplification kit. Int J Legal Med 2009; 123: 471–482.
Underhill PA, Passarino G, Lin AA et al: The phylogeography of Y chromosome binary haplotypes and the origins of modern human populations. Ann Hum Genet 2001; 65: 43–62.
Chennakrishnaiah S, Perez D, Gayden T, Rivera L, Regueiro M, Herrera RJ : Indigenous and foreign Y-chromosomes characterize the Lingayat and Vokkaliga populations of Southwest India. Gene 2013; 526: 96–106.
Derenko M, Malyarchuk B, Denisova GA et al: Contrasting patterns of Y-chromosome variation in South Siberian populations from Baikal and Altai-Sayan regions. Hum Genet 2006; 118: 591–604.
Haak W, Brandt G, de Jong HN et al: Ancient DNA, Strontium isotopes, and osteological analyses shed light on social and kinship organization of the Later Stone Age. Proc Natl Acad Sci USA 2008; 105: 18226–18231.
Haak W, Balanovsky O, Sanchez JJ et al: Ancient DNA from European early neolithic farmers reveals their near eastern affinities. PLoS Biol 2010; 8: e1000536.
Sherratt A : The transformation of early agrarian Europe: the later Neolithic and Copper Ages 4500-2500 BC; in: Cunliffe B (ed): Prehistoric Europe: An Illustrated History. Oxford: Oxford University Press, 1998, pp 167–201.
Mielnik-Sikorska M, Daca P, Malyarchuk B et al: The history of Slavs inferred from complete mitochondrial genome sequences. PLoS One 2013; 8: e54360.
Anthony DW : The horse, the wheel and language. How Bronze-Age Riders from the Eurasian Steppes Shaped the Modern World. Princeton, NJ: Princeton University Press, 2007.
Xue Y, Wang Q, Long Q et al: Human Y chromosome base-substitution mutation rate measured by direct sequencing in a deep-rooting pedigree. Curr Biol 2009; 19: 1453–1457.
Mendez FL, Krahn T, Schrack B et al: An African American paternal lineage adds an extremely ancient root to the human Y chromosome phylogenetic tree. Am J Hum Genet 2013; 92: 454–459.
Brotherton P, Haak W, Templeton J et al: Neolithic mitochondrial haplogroup H genomes and the genetic origins of Europeans. Nat Commun 2013; 4: 1764.
Gray RD, Atkinson QD : Language-tree divergence times support the Anatolian theory of Indo-European origin. Nature 2003; 426: 435–439.
Lamberg-Karlovsky C : Archaeology and language: The Indo-Iranians. Curr Anthrop 2002; 43: 63–88.
Y Chromosome Consortium: A nomenclature system for the tree of human Y-chromosomal binary haplogroups. Genome Res 2002; 12: 339–348.
Acknowledgements
AAL thanks Ancestry DNA for support. PAU thanks CDB and Professor Michael Snyder for support. GDP was supported by the National Science Foundation Graduate Research Fellowship under Grant No. DGE-1147470. This work was supported by the European Union European Regional Development Fund through the Centre of Excellence in Genomics, by the Estonian Biocentre and the University of Tartu, by the European Commission grant 205419 ECOGENE to the EBC, by the Estonian Basic Research Grant SF 0270177s08 and by Institutional Research Funding from the Estonian Research Council IUT24-1. JS and TS were supported by the Croatian Ministry of Science, Education, and Sports grant Population structure of Croatia—anthropogenic approach (No. 196-1962766-2751 to PR). AKP was supported by European Social Fund's Doctoral Studies and Internationalisation Programme DoRa. VG and OS were supported by the Italian Ministry of the University: Progetti Ricerca Interesse Nazionale 2012. SNPs not previously submitted have been deposited to dbSNP (http://www.cbi.nlm.nih.gov/SNP/; ss947849426–947850190).
Author information
Authors and Affiliations
Corresponding author
Ethics declarations
Competing interests
PAU consulted for and has stock in, and CDB is on the advisory board of a project at 23andMe. CDB is on the scientific advisory boards of Personalis, Inc.; InVitae (formerly Locus Development, Inc.); and Ancestry DNA. The remaining authors declare no conflict of interest.
Additional information
Supplementary Information accompanies this paper on European Journal of Human Genetics website
Supplementary information
Rights and permissions
About this article
Cite this article
Underhill, P., Poznik, G., Rootsi, S. et al. The phylogenetic and geographic structure of Y-chromosome haplogroup R1a. Eur J Hum Genet 23, 124–131 (2015). https://doi.org/10.1038/ejhg.2014.50
Received:
Revised:
Accepted:
Published:
Issue Date:
DOI: https://doi.org/10.1038/ejhg.2014.50
This article is cited by
-
Genetic history of East-Central Europe in the first millennium CE
Genome Biology (2023)
-
Genetic polymorphism of Y-chromosome in Kazakh populations from Southern Kazakhstan
BMC Genomics (2023)
-
Population genetic study of 17 Y-STR Loci of the Sorani Kurds in the Province of Sulaymaniyah, Iraq
BMC Genomics (2022)
-
Dual origins of the Northwest Chinese Kyrgyz: the admixture of Bronze age Siberian and Medieval Niru’un Mongolian Y chromosomes
Journal of Human Genetics (2022)
-
Sequence analyses of Malaysian Indigenous communities reveal historical admixture between Hoabinhian hunter-gatherers and Neolithic farmers
Scientific Reports (2022)
