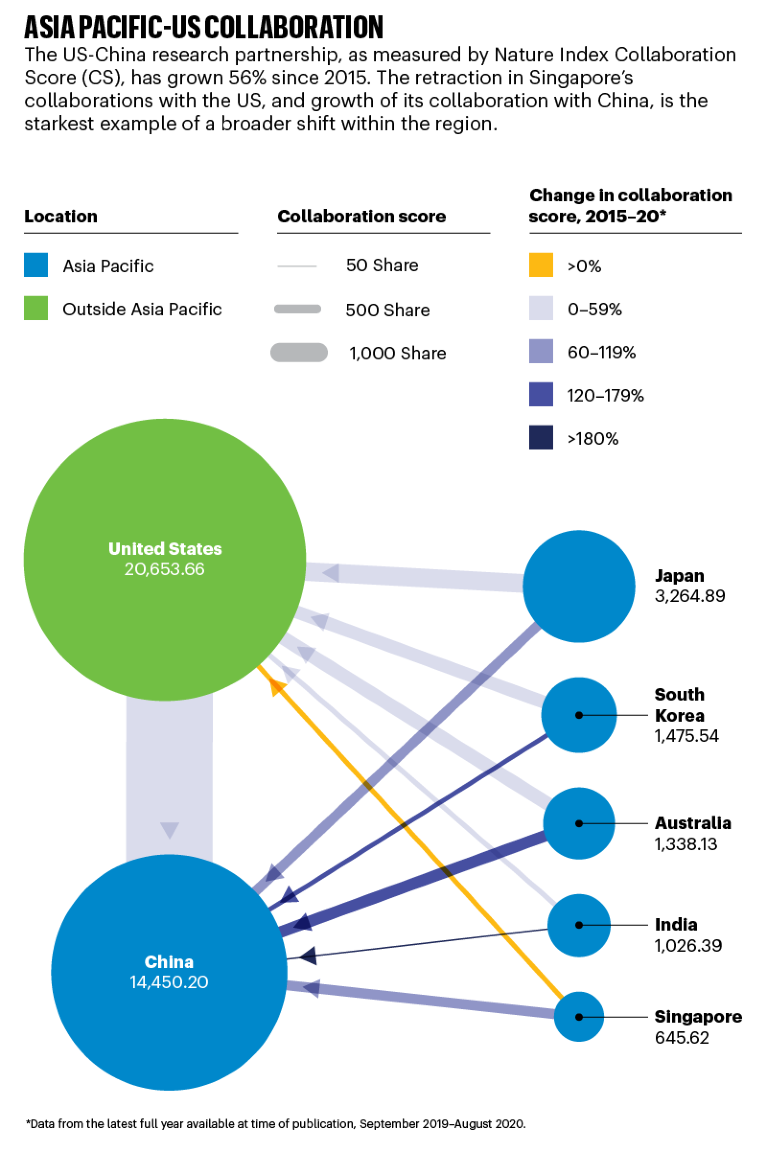
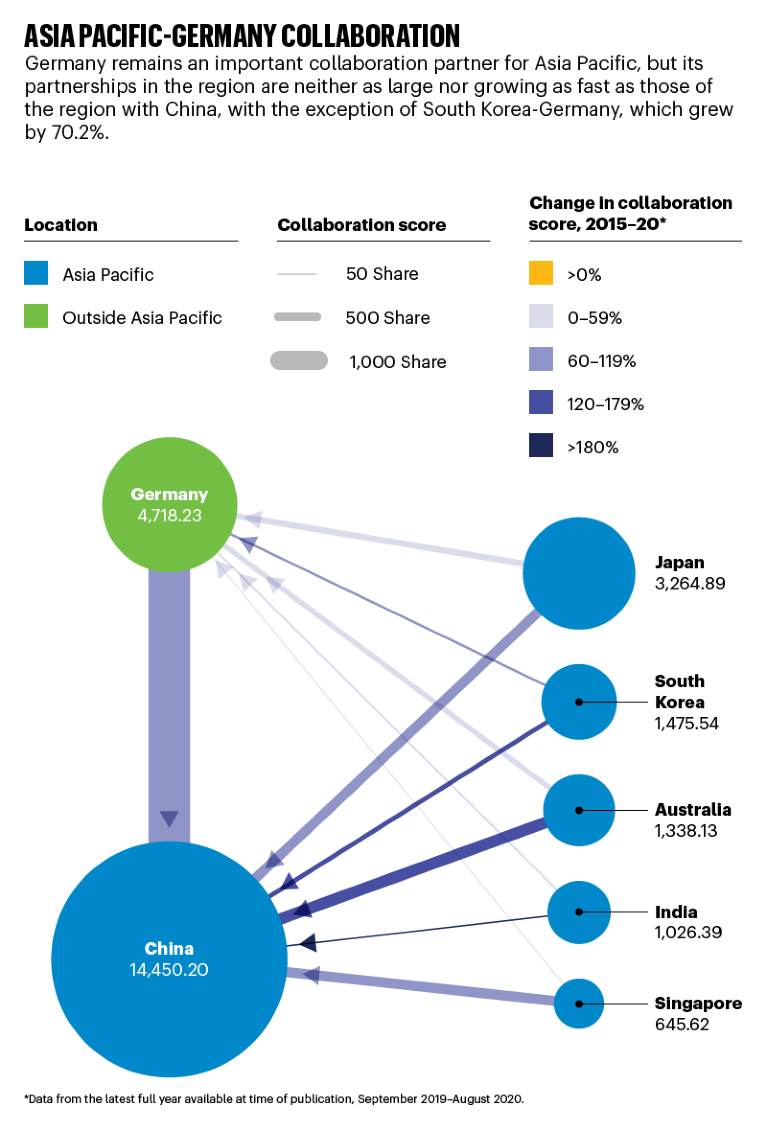
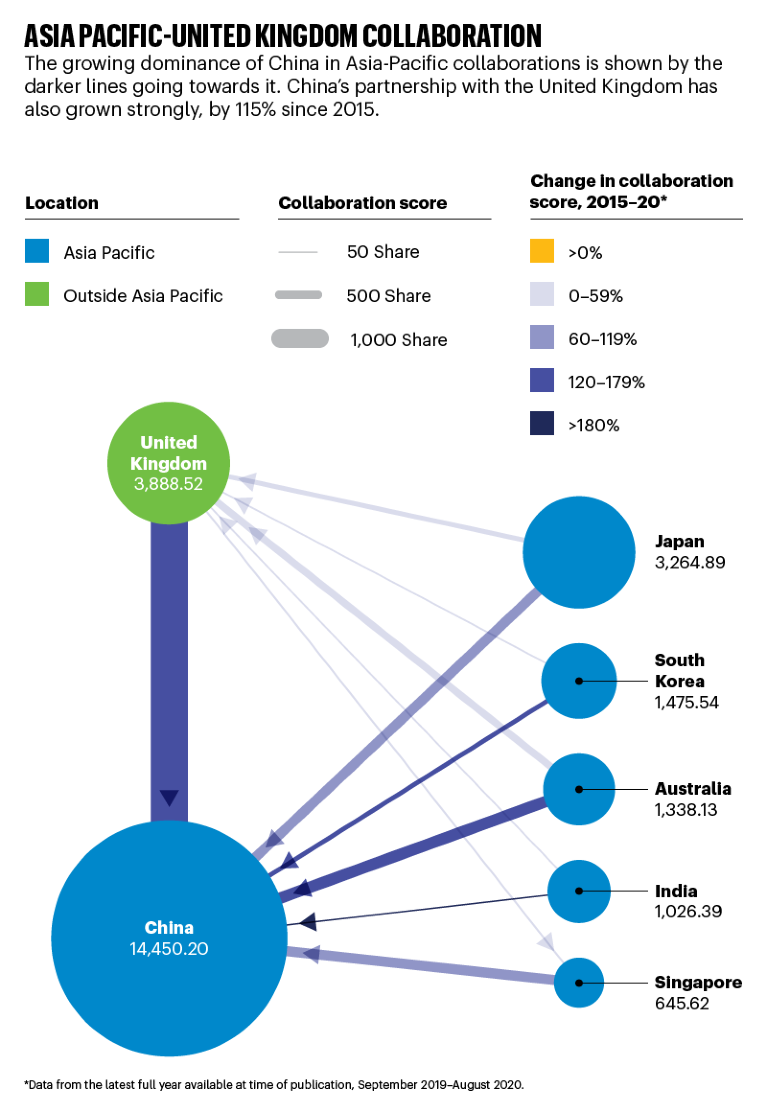
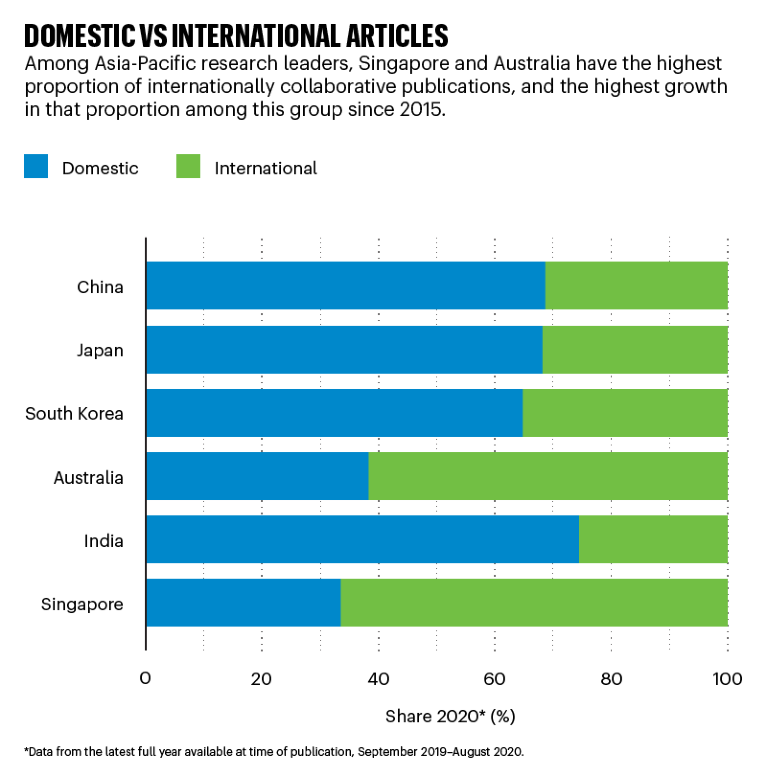
Here we present a comparison of Collaboration Score (CS) between China and the rest of Asia Pacific’s top six research performers, and their CS with three research leaders outside the region — the United States, the United Kingdom and Germany. Nodes are sized according to each location’s Share in 2020* and line thickness represents the total CS, which is calculated by adding each partner’s Share in their joint articles. The lines are coloured according to the per cent change in CS between 2015 and 2020*. Arrows point to the country that contributes more Share in a given collaboration.

Source: Nature Index. Data analysis by Catherine Cheung, infographic by Tanner Maxwell & Catherine Armitage

Source: Nature Index. Data analysis by Catherine Cheung, infographic by Tanner Maxwell & Catherine Armitage

Source: Nature Index. Data analysis by Catherine Cheung, infographic by Tanner Maxwell & Catherine Armitage

Source: Nature Index. Data analysis by Catherine Cheung, infographic by Tanner Maxwell & Catherine Armitage

 Rising tide of China’s science lifts Asia-Pacific research
 Politics and the pandemic disrupt migration patterns in research
 COVID-19 acts as a catalyst in India’s quest for self-sufficiency
 Japan and South Korea pursue shared interests
 Southeast Asian countries join forces for scientific strength


