
Abstract
Surrogate markers may help predict the effects of first-line treatment on survival. This metaregression analysis examines the relationship between several surrogate markers and survival in women with advanced breast cancer after receiving first-line combination anthracycline chemotherapy 5-fluorouracil, adriamycin and cyclophosphamide (FAC) or 5-fluorouracil, epirubicin and cyclophosphamide (FEC) . From a systematic literature review, we identified 42 randomised trials. The surrogate markers were complete or partial tumour response, progressive disease and time to progression. The treatment effect on survival was quantified by the hazard ratio. The treatment effect on each surrogate marker was quantified by the odds ratio (or ratio of median time to progression). The relationship between survival and each surrogate marker was assessed by a weighted linear regression of the hazard ratio against the odds ratio. There was a significant linear association between survival and complete or partial tumour response (P<0.001, R2=34%), complete tumour response (P=0.02, R2=12%), progressive disease (P<0.001, R2=38%) and time to progression (P<0.0001, R2=56%); R2 is the proportion of the variability in the treatment effect on survival that is explained by the treatment effect on the surrogate marker. Time to progression may be a useful surrogate marker for predicting survival in women receiving first-line anthracycline chemotherapy and could be used to estimate the survival benefit in future trials of first-line chemotherapy compared to FAC or FEC. The other markers, tumour response and progressive disease, were less good.
Main
Survival time is the generally accepted outcome used to assess the overall benefit of treatment for advanced breast cancer. However, demonstration of a survival benefit following first-line chemotherapy can be obscured by the increasing use of effective second and third-line chemotherapeutic agents. Surrogate markers, such as tumour response, may help to predict the effects of first-line treatment on survival. A'Hern et al, 1988 used the results of 50 randomised trials of chemotherapy in the treatment of breast cancer and showed that there was a statistically significant relationship between tumour response and survival. Such a relationship has recently been shown in patients with advanced colorectal cancer receiving first-line chemotherapy, though the ability to predict survival for a given tumour response was not as precise as expected (Buyse et al, 2000b). We here examine the relationship between several surrogate markers (including tumour response) and survival in women with advanced breast cancer after receiving first-line combination 5-fluorouracil, adriamycin and cyclophosphamide (FAC) or 5-fluorouracil, epirubicin and cyclophosphamide (FEC) chemotherapy in clinical trials.
Methods
Assessment of the relationship between survival and surrogate end points is best done when based on data from randomised trials (Buyse and Piedbois, 1996).
Data
In all, 42 randomised trials were identified from the published literature (Medline 1966–2005) that compared two or more first-line combination therapies in women with metastatic breast cancer. The search criteria included the terms ‘breast’, ‘advanced or metastatic or metastases’, ‘fluorouracil or 5-FU’, ‘cyclophosphamide’, ‘trial or random*’ and ‘adriamycin or adriamicin or doxorubicin or epirubicin or epidoxorubicin or anthracycline’. Trials were included in the analyses if they met the following criteria:
-
i)
All women had metastatic disease (some trials included women with recurrent breast cancer).
-
ii)
Women had received no previous chemotherapy for advanced disease.
-
iii)
If patients had previously been given adjuvant chemotherapy they had to have had clear evidence of relapse and the original therapy could not have included any anthracyclines
-
iv)
One of the treatment regimes included FAC or FEC.
The surrogate markers included in this analysis were complete or partial tumour response, disease progression and time to progression. From each published report the following information was obtained for each treatment group, found directly in the results or by estimation from the illustrations:
-
The proportion of patients with a complete and partial tumour response
-
The proportion of patients with progressive disease
-
The median time to disease progression (months); taken as the time from randomisation (or start of treatment) to the first sign of progression or relapse. There were 9 trials that defined this as the time from randomisation to progression, relapse or death. These were not included in the main analysis but the results are reported separately
-
The median survival time (months); taken as the time from randomisation (or start of treatment) to the date of death from any cause
Statistical methods
The method used here is similar to that described by A'Hern et al, 1988. We refer to the FAC or FEC treatment group as Group 2 and the comparison treatments as Group 1. Briefly, the following information (illustrated for complete response) was obtained for each trial and for tumour response and progressive disease:

The odds ratio of having a complete response in Group 1 compared to Group 2 is given by (A × D)/(B × C), but after adding 0.5 to each of the four terms to allow for groups with zero events. These ratios can be used to describe the treatment effect on the surrogate marker. The treatment effect on time to progression was estimated as the median time to progression in Group 1 divided by the median time in Group 2.
The hazard ratio was taken as the median survival time in Group 1 divided by the median time in Group 2, assuming that survival follows an exponential distribution. This is referred to as the treatment effect on survival.
The relationship between the treatment effect on the surrogate marker (odds ratio) and the treatment effect on survival (hazard ratio) was examined using a linear regression, both on a log scale and weighted by the inverse of the variance of the odds ratio. For the regression of survival against time to progression, the number of patients in the study was used as weights. To avoid spurious associations resulting from forcing the regression through the origin (where no treatment effect on the surrogate marker indicates no treatment effect on survival), all regressions contained an intercept term and were of the form log10 survival ratio=a+b × log10 odds ratio.
From each regression model, the coefficient of determination (R2) was obtained; this is the proportion of the variability in the treatment effect on survival that is explained by the treatment effect on the surrogate marker.
It is realised that the method of assessment of tumour response has varied over time and this could affect the proportion of patients with a complete or partial tumour response. However, because the same method of assessment was used for all treatment groups in each trial, it is likely that the odds ratio (which is based on comparing two groups) would not be greatly affected.
Results
The 42 randomised trials (Table 1) were based on 9163 women and 46 estimates of hazard ratio. In most trials the treatment regimens that were compared to FAC or FEC resulted in a reduction in the proportion of patients with complete or partial tumour responses, an increase in progressive disease and shorter median survival times.
Figure 1 shows the relationship between the treatment effect on the median survival time (survival ratio) and the treatment effect on tumour response and disease progression (odds ratio). There was a statistically significant linear association between survival and complete or partial tumour response (P-value <0.0001); 34% of the variability in the treatment effect on survival can be explained by the treatment effect on tumour response. When the data are restricted to only those patients with a complete response, there was still evidence of a linear association with survival (P-value 0.02), though only a small proportion of the variability could be explained (R2=12%). There was also a relationship with progressive disease (P-value<0.0001, R2=38%) and time to progression (P-value <0.0001, R2=56%); the latter suggesting that a moderately high proportion of the variability in the treatment effect on survival can be explained by the treatment effect on time to progression. The results on time to progression were similar in the 9 trials that included death as an event (regression coefficient 0.4817, P-value=0.017, R2=58%).

The relationship between the treatment effect on median survival time and each of the four surrogate markers. The regression lines are as follows, with the corresponding P-value, coefficient of determination (R2) and standard error of the regression coefficient (s.e.) in brackets: (A) Log10 hazard ratio=−0.0081+0.2796 × log10 odds ratio for complete/partial response (P<0.0001, R2=34%, s.e.=0.0590), (B) Log10 hazard ratio=−0.0097+0.1266 × log10 odds ratio for complete response (P=0.02, R2=12%, s.e.=0.0521), (C) Log10 hazard ratio=0.0015–0.1781 × log10 odds ratio for progressive disease (P<0.0001, R2=38%, s.e.=0.0380), (D) Log10 hazard ratio=0.0135+0.5082 × log10 ratio of median time to progression (P<0.001, R2=56%, s.e.=0.0928). The size of the symbols is proportional to the inverse of the variance (the weight). For time to progression the size is proportional to the number of patients in the trial.
There is a possibility that second-line therapies may have obscured the relationships between survival and the surrogate markers. To assess this effect we compared the regression analyses in trials that recruited patients before 1990, when second-line therapies would have been uncommon, to those that recruited in 1990 or later. Table 2 shows the results from this analysis and those from all trials; they are consistent with each other.
Table 3 shows hypothetical examples of two treatments and the predicted effects on survival using the regression equations in Figure 1. For example, if one treatment (A) had a response rate of 30% and a median survival time of 20 months and another (treatment B) was expected to double the response rate to 60%, the estimated median survival using treatment B would be 28 months; an increase in survival of 8 months (Appendix A provides details of the calculation). Similarly, a doubling of the median time to progression was associated with a median survival time that could be 9 months greater.
Discussion
These results suggest that tumour response and progressive disease are both associated with survival in women receiving first-line FAC or FEC chemotherapy for advanced breast cancer, but the best surrogate marker is time to progression. The strength of the association was only modest for tumour response (R2=34%) and progressive disease (R2=38%), but stronger for time to progression (R2=56%).
The conclusion for tumour response is similar to that reported by A'Hern et al, 1988 whose analysis was based on all chemotherapy trials published by 1986. In that analysis an estimated 37% of the variability in survival was explained by variation in tumour response (compared to our estimate of 34%). Our analysis differs to that by A'Hern et al, 1988 for several reasons – only 10 of the 42 trials in our analysis could have been included; we only included trials that included FAC/FEC first-line therapies; several surrogate markers were assessed here; and we used a different model to quantify the association between survival and each surrogate marker (we used linear relationships that were not forced to go through the origin thereby avoiding possible spurious associations – A'Hern et al, 1988 used a quadratic model that was forced through the origin).
The appeal of a perfect surrogate marker is that if it can be measured earlier than a ‘true’ end point (such as survival) then a trial would require less time spent on following-up patients before a conclusion can be made about the treatment being tested. Furthermore, if one is interested in assessing a first-line therapy then the effect on survival may be obscured if patients are given second- and third-line therapies; the advantage of using a surrogate marker is that it could be measured before these subsequent therapies are administered. Several investigators have discussed various approaches to determine the usefulness of proposed surrogates. Buyse and Molenberghs, 1998 introduce the concept of ‘relative effect’. This compares the treatment effect on survival with the treatment effect on the surrogate marker. The relative effect is simply the slope of the regression line from a regression analysis. A perfect surrogate would have a relative effect of 1. In our analyses the relative effects were small for complete/partial response (0.28) and progressive disease (0.18) but greater for time to progression (0.51). However, a marker could still be useful as a surrogate if it predicts worthwhile changes in the true end point, such as survival. Our results indicate that this may be so (Table 3).
Buyse et al (2000a) suggest evaluating surrogacy by estimating two coefficients of determination; R2trial based on data from the trials and the R2indiv based on individual patients. A marker would be called ‘trial-level’ valid if R2trial is close to one and ‘individual-level’ valid if R2indiv is close to one. The latter would indicate the ability for a marker to predict survival for an individual patient. Furthermore, a large R2indiv indicates that the surrogate is causally linked to the true end point, an observation that confirms that a surrogate is highly effective. In an example of treating advanced ovarian cancer (Buyse et al, 2000a) individual patient data were available so both R2 values could be estimated. Survival was the true end point and time to progression was the proposed surrogate marker. They found that R2trial=0.94 and R2indiv=0.89, both sufficiently high to conclude that time to progression could be used as a surrogate. In our analyses we did not have individual patient data so were unable to estimate R2indiv. Our estimates for R2trial were only modest for tumour response (34%) and progressive disease (38%) but greater for time to progression (56%).
There are limitations to our analysis. First, although this analysis was restricted to randomised trials (thereby minimising some biases associated with similar analyses of surrogate markers (Buyse and Piedbois, 1996), it was based on performing regressions using summary data, namely odds ratios and survival ratios. The ability to predict survival from a surrogate marker for an individual patient will therefore be limited (Buyse and Piedbois, 1996). Analyses of these trials using individual patient data would provide more precise estimates of the predictive ability of these markers on survival. Second, it was not possible to assess the effect of second-line therapies in patients whose disease progressed during the course of the trials; such therapies may also have had an affect on survival. For instance, a trial by Nabholtz et al (1999) showed that patients with advanced breast cancer may benefit in terms of survival from more effective second-line therapy. All patients in this trial had already received first-line anthracycline chemotherapy for metastatic cancer and were randomised to receive either docetaxel or mitomycin plus vinblastine; survival was longer in the docetaxel group (11.4 vs 8.7 months). However, our analysis of trials that recruited patients before 1990, when second-line therapies were less likely to have been used, gave similar results to those published after 1990 (Table 2).
Despite these limitations the results may be useful when determining the efficacy of first-line treatments for advanced breast cancer that use anthracyclines. With the increasing use of effective second and third-line chemotherapy in breast cancer this type of analysis offers a means of comparing new first-line chemotherapy treatments to first-line anthracycline combination therapies without the effect being masked by second or third line therapies.
Change history
16 November 2011
This paper was modified 12 months after initial publication to switch to Creative Commons licence terms, as noted at publication
References
A'Hern RP, Ebbs SR, Baum MB (1988) Does chemotherapy improve survival in advanced breast cancer? A statistical overview. Br J Cancer 57: 615–618
Ackland S, Anton A, Breitbach GP, Colajori E, Tursi JM, Delfino C, Efremidis A, Ezzat A, Fittipaldo A, Kolaric K, Lopez M, Viaro D (2001) Dose-intensive epirubicin-based chemotherapy is superior to an intensive intravenous cyclophosphamide, methotrexate, and fluorouracil regimen in metastatic breast cancer: a randomized multinational study. J Clin Oncol 19(4): 943–953
Aisner J, Weinberg V, Perloff M, Weiss R, Perry M, Korzun A, Ginsberg S, Holland JF (1987) Chemotherapy vs chemoimmunotherapy (CAF v CAFVP v CMF each±MER) for metastatic carcinoma of the breast: a CALGB study. J Clin Oncol 5(10): 1523–1533
Alonso MC, Tabernero JM, Ojeda B, Llanos M, Sola C, Climent MA, Segui MA, Lopez JJ (1995) A phase III randomized trial of cyclophosphamide, mitoxantrone, and 5- fluorouracil (CNF) vs cyclophosphamide, adriamycin, and 5-fluorouracil (CAF) in patients with metastatic breast cancer. Breast Cancer Res Treat 34: 15–24
Bennett JM, Muss HB, Doroshow JH, Wolff S, Krementz ET, Cartwright K, Dukart GD, Reisman A, Schoch I (1988) A randomized multicenter trial comparing mitoxantrone, cyclophosphamide, and fluorouracil with doxorubicin, cyclophosphamide, and fluorouracil in the therapy of metastatic breast carcinoma. J Clin Oncol 6(10): 1611–1620
Boccardo F, Rubagotti A, Rosso R, Santi L (1985) Chemotherapy with or without tamoxifen in postmenopausal patients with late breast cancer. A randomized study. J Steroid Biochem 23(6B): 1123–1127
Buyse M, Molenberghs G (1998) Criteria for the validation of surrogate endpoints in randomised experiments. Biometrics 54: 1014–1029
Buyse M, Molenberghs G, Burzykowski T, Renard D, Geys H (2000a) The validation of surrogate endpoints in meta-analyses of randomised experiments. Biostatistics 1: 49–67
Buyse M, Piedbois P (1996) On the relationship between response to treatment and survival time. Stat Medicine 15: 2797–2812
Buyse M, Thirion P, Carlson RW, Burzykowski T, Molenberghs G, Piedbois P (2000b) Relation between tumour response to first-line chemotherapy and survival in advanced colorectal cancer: a meta-analysis. Lancet 356: 373–378
Carpenter JT, Smalley RV, Raney M, Vogel CL, Weiner RS (1986) Ineffectiveness of levamisole in prolonging remission or survival of women treated with cyclophosphamide, doxorubicin, and 5-fluorouracil for good-risk metastatic breast carcinoma: a Southeastern Cancer Study Group Trial. Cancer Treat Rep 70(9): 1073–1079
Conte PF, Baldini E, Gardin G, Pronzato P, Amadori D, Carnino F, Monzeglio C, Gentilini P, Gallotti P, DeMicheli R, Venturini M, Rubagotti A, Rosso R (1996) Chemotherapy with or without estrogenic recruitment in metastatic breast cancer. A randomized trial of the Gruppo Oncologico Nord Ovest (GONO). Ann Oncol 7(5): 487–490
Cummings FJ, Gelman R, Horton J (1985) Comparison of CAF vs CMFP in metastatic breast cancer: Analysis of prognostic factors. J Clin Oncol 3(7): 932–940
Ejlertsen B, Pfeiffer P, Pedersen D, Mouridsen HT, Rose C, Overgaard M, Sandberg E, Kristensen B (1993) Decreased efficacy of cyclophosphamide, epirubicin and 5-fluorouracil in metastatic breast cancer when reducing treatment duration from 18 to 6 months. Eur J Cancer 29A(4): 527–531
Esteban E, Lacave AJ, Fernandez JL, Corral N, Buesa JM, Estrada E, Palacio I, Vieitez JM, Muniz I, Alvarez E (1999) Phase III trial of cyclophosphamide, epirubicin, fluorouracil (CEF) vs cyclophosphamide, mitoxantrone, fluorouracil (CNF) in women with metastatic breast cancer. Breast Cancer Res Treat 58: 141–150
Falkson CI, Falkson G, Falkson CB, Falkson HC (1992) Mitomycin C + high-dose medroxyprogesterone vs cyclophosphamide+doxorubicin plus fluorouracil as first-line treatment for metastatic breast cancer. Oncology 49(6): 418–421
Falkson G, Gelman RS, Tormey DC, Falkson CI, Wolter JM, Cummings FJ (1987) Treatment of metastatic breast cancer in premenopausal women using CAF with or without oophorectomy: an Eastern Cooperative Oncology Group Study. J Clin Oncol 5(6): 881–889
Falkson G, Tormey DC, Carey P, Witte R, Falkson HC (1991) Long-term survival of patients treated with combination chemotherapy for metastatic breast cancer. Eur J Cancer 27(8): 973–977
French Epirubicin Study Group (1988) A prospective randomized phase III trial comparing combination chemotherapy with cyclophosphamide, Fluorouracil, and either doxorubicin or epirubicin. J Clin Oncol 6(4): 679–688
French Epirubicin Study Group (1991) A prospective randomized trial comparing epirubicin monochemotherapy to two fluorouracil, cyclophosphamide, and epirubicin regimens differing in epirubicin dose in advanced breast cancer patients. J Clin Oncol 9(2): 305–312
French Epirubicin Study Group (2000) Epirubicin-based chemotherapy in metastatic breast cancer patients: role of dose-intensity and duration of treatment. J Clin Oncol 18(17): 3115–3124
Fritze D, Becher R, Massner B, Kaufmann M, Bruntsch U, Gallmeier WM, Mayr AC, Drings P, Abel U, Edler L, Jungi WF, Queisser W, Senn HJ (1982) A randomized study of combination chemotherapy (VAC-FMC) with or without immunostimulation by Corynebacterium parvum in metastatic breast cancer. Klin Wochenschr 60(12): 593–598
Heidemann E, Stoeger H, Souchon R, Hirschmann WD, Bodenstein H, Oberhoff C, Fischer JT, Schulze M, Clemens M, Andreesen R, Mahlke M, Konig M, Scharl A, Fehnle K, Kaufmann M (2002) Is first-line single-agent mitoxantrone in the treatment of high-risk metastatic breast cancer patients as effective as combination chemotherapy? No difference in survival but higher quality of life were found in a multicenter randomized trial. Annals Oncol 13: 1717–1729
Hori T, Kodama H, Nishimura S, Hatano T, Okamura R, Fujii K, Kudo T, Inamoto T, Sawai K, Kobayashi M, Ogawa H, Yoshimura N, Hiraoka M (2001) A randomized study comparing oral and standard regimens for metastatic breast cancer. Oncol Rep 8(5): 1067–1071
Hortobagyi GN, Bodey GP, Buzdar AU, Frye D, Legha SS, Malik R, Smith TL, Blumenschein GR, Yap HY, Rodriguez V (1987a) Evaluation of high-dose vs standard FAC chemotherapy for advanced breast cancer in protected environment units: a prospective randomized study. J Clin Oncol 5(3): 354–364
Hortobagyi GN, Buzdar AU, Frye D, Hug V, Fraschini G, Ames FC, Montague E, Gutterman JU, Martin RG (1987b) Combined antiestrogen and cytotoxic therapy with pseudomonas vaccine immunotherapy for metastatic breast cancer. A prospective, randomized trial. Cancer 60(11): 2596–2604
Jassem J, Pienkowski T, Pluzanska A, Jelic S, Gorbunova V, Mrsic-Krmpotic Z, Berzins J, Nagykalnai T, Wigler N, Renard J, Munier S, Weil C (2001) Doxorubicin and paclitaxel vs fluorouracil, doxorubicin, and cyclophosphamide as first-line therapy for women with metastatic breast cancer: final results of a randomized phase III multicenter trial. J Clin Oncol 19(6): 1707–1715
Lopez M, Papaldo P, Di Lauro L, Vici P, Carpano S, Conti EMS (1989) 5-Fluorouracil, Adriamycin, Cyclophoshamide (FAC) vs 5-Fluorouracil, Epirubicin, Cyclophosphamide (FEC) in Metastatic Breast Cancer. Oncology 46: 1–5
Mackey JR, Paterson A, Dirix LY, Dewar J, Chap L, Martin M, Chan S, Tang S-C, Dugan W, Gil W, Zaluski J, Russel C, Vogel C, Efremedis A, Appia F, Brunel E, Hatteville L, Azli N, Nabholtz J-M (2002) Final results of the phase III randomized trial comparing docetaxel (T), doxorubicin (A) and cyclophosphamide (C) to FAC as first line chemotherapy for patients with metastatic breast cancer. Proc Am Soc Clin Oncol; Abstract number 137
Muss HB, White DR, Richards F, Cooper MR, Stuart JJ, Jackson DJ, Rhyne LR, Spurr CL (1978) Adriamycin vs methotrexate in five-drug combination chemotherapy for advanced breast cancer; a randomised trial. Cancer 42: 2141–2148
Nabholtz JM, Senn WR, Bezwoda WR, Melnychuk D, Deschenes L, Douma J, Vandenberg TA, Rapoport B Rosso R, Trillet-Lenoir V, Drbal J, Molino A, Nortier JW, Richel, DJ, Nagykalnai T, Siedlecki P, Wilking N, Genot JY, Hupperets PS, Pannuti F, Skarlos D, Tomiak EM, Murawsky M, Alakl M, Aapro M (1999) Prospective randomised trial of docetaxel vs mitomycin plus vinblastine in patients with metastatic breast cancer progressing despite previous anthracycline-containing chemotherapy. J Clin Oncol 17(5): 1413–1424
Pacini P, Rinaldini M, Algeri A, Guarneri A, Tucci E, Barsanti G, Neri B, Bastiano P, Marzano S, Fallai C (2000) FEC (5-Fluorouracil, epidoxorubicin and cyclophosphamide) vs EM (epidoxorubicin and mitomycin-C) with or without lonidamine as first-line treatment for advanced breast cancer. A multicentric randomised study. Final results. Eur J Cancer 36: 966–975
Paridaens R, Heuson JC, Julien JP, Veyret C, Van Zyl J, Klijn JGM, Sylvester R, Mignolet F (1993) Assessment of Estrogenic Recruitment before chemotherapy in advanced breast cancer: a double-blind randomized study. J Clin Oncol 11(9): 1723–1728
Parnes HL, Cirrincione C, Aisen J, Berry DA, Allen SL, Abrams J, Chuang E, Cooper MR, Perry MC, Duggan DB, Szatrowski TP, Henderson IC, Norton L (2003) Phase III study of cyclophosphamide, doxorubicin, and gluorouracil (CAF) plus leucovorin vs CAF for metastatic breast cancer: Cancer and leukaemia group B 9140. J Clin Oncol 21(9): 1819–1824
Pavesi L, Preti P, Da Prada G, Pedrazzoli P, Poggi G, Rubustelli Della Cuna G (1995) Epirubicin vs mitoxantrone in combination chemotherapy for metastatic breast cancer. Anticancer Res 15: 495–501
Pfeiffer P, Rose C, Ejlertsen B, Andersson M, Pedersen D, Mouridsen HT (1996) Concurrent tamoxifen (TAM) + cyclophosphamide, epirubicin, and fluorouracil (CEF) vs TAM + delayed CEF after six months of endocrine therapy in metastatic breast cancer – a randomized trial from the Danish Breast Cancer Cooperative Group (DBCG). Acta Oncol 35(Suppl 5): 57
Pierga JY, Jouve M, Asselain B, Beuzeboc P, Dorval T, Palangie T, Dieras V, Garcia-Giralt E, Scholl S, Pouillart P (1995) Randomized trial comparing two different modalities of administration of the same cytotoxic drugs in metastatic breast cancer. J Infus Chemother 5(4): 197–200
Pouillart P, Follezou JY, Palangie T, Feuilhaude F, George C, Richards E (1994) Long-term results of a randomised trial comparing regiments of cyclophosphamide and fluorouracil with either mitoxantrone or doxorubicin in patients with advanced breast cancer. Eur J Cancer 30: 715–716
Riccardi A, Tinelli C, Brugnatelli S, Pugliese P, Giardina V, Giordano M, Danova M, Richetti A, Fava S, Rinaldi E, Fregoni V, Trotti G, Poli A (2000) Doubling of the epirubicin dosage within the 5-fluorouracil, epirubicin and cyclophosphamide regimen: a prospective, randomized, multicentric study on antitumor effect and quality of life in advanced breast cancer. Int J Oncol 16: 769–776
Sledge GW, Hu P, Falkson D, Tormey D, Abeloff M (2000) Comparison of chemotherapy with chemohormonal therapy as first-line therapy for metastatic, hormonsenitive breast cancer: an eastern cooperative oncology group study. J Clin Oncol 18(2): 262–266
Smalley RV, Lefante J, Bartolucci A (1983) A comparison of cyclophosphamide, adriamycin, and 5-fluorouracil (CAF) and cyclophosphamide, methotrexate, 5-fluorouracil, vincristine, and prednisone (CMFVP) in patients with advanced breast cancer. A southeastern cancer study group project. Breast Cancer Res Treat 3: 209–220
Speyer JL, Green MD, Zeleniuch-Jacquotte A, Wernz JC, Rey M, Sanger J, Kramer E, Ferrans V, Hochster H, Meyers M, Blum RH, Feit F, Attubato M, Burrows W, Muggia FM (1992) ICRF-187 permits longer treatment with doxorubicin in women with breast cancer. J Clin Oncol 10(1): 117–127
Steiner R, Stewart JF, Cantwell BMJ, Minton MJ, Knight RK, Rubens RD (1984) Adriamycin alone or combined with vincristine in the treatment of advanced breast cancer. Eur J Cancer Clin Oncol 19: 1553–1557
Stewart DJ, Evans WK, Shepherd FA (1997) Cyclophosphamide and fluorouracil combinaed with mitroxantrone vs doxorubicin for breast cancer: superiority of doxorubicin. J Clin Oncol 15(5): 1897–1905
Tormey DC, Weinberg VE, Leone LA (1984) A comparison of intermittent vs continuous and of adriamycin vs methotrexate 5-drug chemotherapy for advanced breast cancer. Am J Clin Oncol 7: 231–239
Vogel CL, Smalley RV, Raney M, Krauss S, Carpenter J, Velez-Garcia E, Fishkin E, Raab S, Moore MR, Stagg M (1984) Randomized trial of cyclophosphamide, doxorubicin, and 5-fluorouracil alone or alternating with a ‘cycle active’ non-cross-resistant combination in women with visceral metastatic breast cancer: a Southeastern Cancer Study Group Project. J Clin Oncol 2(6): 643–651
Zielinski C, Beslija S, Mrsic-Krmpotic Z, Welnicka-Jaskiewicz M, Wiltschke C, Kahan Z, Grgic M, Tzekova V, Inbar M, Cervek J, Chernozemsky I, Szanto J, Spanik S, Wagnerova M, Ghilezan N, Pawlega J, Vrbanec D, Khamtsov D, Soldatenkova V, Brodowicz T (2005) Gemcitabine, epirubicin, and paclitaxel vs fluorouracil, epirubicin, and cyclophosphamide as first-line chemotherapy in metastatic breast cancer: a Central European Cooperative Oncology Group International, multicenter, prospective, randomized phase III trial. J Clin Oncol 23(7): 1401–1408
Author information
Authors and Affiliations
Corresponding author
Appendix A
Appendix A
Example of estimating the effect on survival using two hypothetical treatments
If treatment A has a response rate of 30% and a median survival time of 20 months and treatment B has a response rate of 60%, the estimated survival time for B is 29 months, obtained as follows:
-
i)
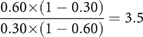
The odds ratio for response (Treatment B compared to Treatment A) is:
-
ii)
The ratio of survival times is estimated using the appropriate regression equation in Figure 1 : log10 hazard ratio=−0.0081+0.2796 × log10 [odds ratio for complete/partial response] log10 hazard ratio=−0.0081+0.2796 × log10 [3.5] log10 hazard ratio=0.1440
-
iii)
The ratio of the log survival ratios is:
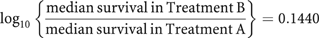


The estimated median survival in Treatment B is: 20 × 100.1440, which is 28 months.
Rights and permissions
From twelve months after its original publication, this work is licensed under the Creative Commons Attribution-NonCommercial-Share Alike 3.0 Unported License. To view a copy of this license, visit http://creativecommons.org/licenses/by-nc-sa/3.0/
About this article
Cite this article
Hackshaw, A., Knight, A., Barrett-Lee, P. et al. Surrogate markers and survival in women receiving first-line combination anthracycline chemotherapy for advanced breast cancer. Br J Cancer 93, 1215–1221 (2005). https://doi.org/10.1038/sj.bjc.6602858
Received:
Revised:
Accepted:
Published:
Issue Date:
DOI: https://doi.org/10.1038/sj.bjc.6602858
Keywords
This article is cited by
-
Validating ORR and PFS as surrogate endpoints in phase II and III clinical trials for NSCLC patients: difference exists in the strength of surrogacy in various trial settings
BMC Cancer (2022)
-
Shorter duration of first-line chemotherapy reflects poorer outcomes in patients with HER2-negative advanced breast cancer: a multicenter retrospective study
Scientific Reports (2021)
-
Learning from clinical trials of neoadjuvant checkpoint blockade
Nature Medicine (2020)
-
A systematic review of meta-analyses assessing the validity of tumour response endpoints as surrogates for progression-free or overall survival in cancer
British Journal of Cancer (2020)
-
Meta-analyses on progression-free survival as a surrogate endpoint for overall survival in triple-negative breast cancer
Breast Cancer Research and Treatment (2020)
