
Abstract
Her-2/neu (H2N) status in breast carcinoma has been considered a prognostic factor that may have therapeutic implications; however, the correlation between H2N overexpression and gene amplification has not been completely defined. A consecutive series of ductal carcinomas (34 invasive and 7 in situ) were analyzed by fluorescent in situ hybridization for H2N gene and chromosome 17 copy number using touch preps of intact cells and by immunohistochemistry, using three different commercial antibodies to H2N protein (Zymed, clone 31G7; Ventana, clone CB11; and Dako, polyclonal) in corresponding formalin-fixed, paraffin-embedded tissue sections. Gene amplification was classified as unequivocal if more than five signals were present in more than 80% of the counted nuclei and absent if more than 80% of the nuclei counted contained two or fewer gene copies. Cases that did not fulfill the above criteria were considered equivocal for amplification. Immunostaining was classified as follows: 0 = no staining; 1+ = faint, incomplete membranous pattern; 2+ = moderate, complete membranous pattern; 3+ = strong membranous pattern. Of the 34 invasive tumors, 10 (29%) had unequivocal gene amplification. Furthermore, all had more than 10 copies of the gene in more than 60% of the counted nuclei. An additional nine cases (26%) had equivocal amplification, which was usually the result of chromosome 17 aneuploidy (seven of nine) or heterogeneity. With the Zymed and Dako antibodies, all tumors with 3+ staining had unequivocal gene amplification and all cases with 2+, 1+, or 0 staining were negative or equivocal for gene amplification. With the Ventana antibody, all cases with 3+ staining had unequivocal gene amplification, but two cases with unequivocal amplification by fluorescent in situ hybridization exhibited 1+ staining. Moderate (2+) H2N staining was observed in one case, three cases, and five cases with the Ventana, Dako, and Zymed reagents, respectively, and did not correlate with H2N gene copy number. Discordance between H2N and chromosome 17 copy number was not a useful means of defining amplification. Two cases of ductal carcinoma in situ with the Zymed antibody and two with the Dako antibody showed 3+ staining despite lack of unequivocal gene amplification. We conclude that (1) strong H2N immunostaining is highly associated with gene amplification, although there is minor variation in sensitivity between different antibodies; (2) a subset of breast carcinomas (3 to 15%) demonstrate moderate H2N staining without evidence of amplification, and it is unclear whether they represent highly sensitive staining or are a subset of cases that show overexpression without amplification; (3) gene amplification, as detected by fluorescent in situ hybridization, is associated with at least 10 gene copies per nucleus, and lower gene copy duplication (3 to 4/nucleus) is frequent, usually the result of chromosome 17 polysomy, and not associated with high-level overexpression; (5) overexpression of H2N without amplification may be more frequent in ductal carcinoma in situ, implying a different role in the biology of preinvasive versus invasive neoplasm.
INTRODUCTION
Her-2/neu (H2N) status in breast carcinoma has long been implicated as a prognostic biomarker (1, 2), and recent studies suggest that it may be a determinant of response to adjuvant therapy (3, 4). Thus, determination of H2N status in breast cancer has assumed clinical importance. Two methods may be used to assess H2N status in clinical samples. Fluorescent in situ hybridization (FISH) uses sequence complementary DNA probes to quantify cellular H2N gene copy number. It is more easily implemented and interpreted than molecular-level techniques, such as Southern blot (5). FISH is also capable of evaluating the number of H2N gene copies relative to chromosome 17 number, which distinguishes gene amplification from chromosomal aneuploidy. Despite the objective and quantitative nature of FISH, application of the technology in tissue sections is complicated by nuclear truncation (slicing), which obscures enumeration of signals. Because of wider accessibility, immunohistochemistry (IHC) is most frequently used to assess H2N and is likely to become the standard for determining H2N status. However, IHC is subject to a number of technical artifacts, sensitivity differences between different antibodies (6), and subjective interpretation. Thus, widespread clinical application requires validation, partly by comparisons with more objective assays.
In this study, we prospectively compared IHC with FISH to determine H2N status in a representative group of breast carcinomas. By performing “two color” FISH (for H2N and chromosome 17) using touch preps of intact cells, we were able to optimize quantitation of H2N copy status. From the same tissue slice used for FISH, we then compared H2N staining pattern using three different commercial antibodies. Thus, we were able to account for most artifacts that commonly have an impact on assay of H2N. Our first objective was to provide an independent and unbiased technical comparison of the technology used to determine H2N status. We were also interested in quantitatively evaluating the relationship between H2N gene copy status and chromosome 17 number and their association with protein expression.
MATERIALS AND METHODS
Sample Procurement
A series of 41 mastectomy or lumpectomy specimens that were received at the Harper Hospital Department of Pathology during 1998 were used for the study. Upon the specimens' arrival to the tissue laboratory, the margins were denoted with ink and the tissue was serially sectioned when fresh and unfixed. Intact cells from the grossly identified neoplasm were scraped from the cut surface with a scalpel blade and placed on a sialanized slide, immediately fixed in methanol/acetic acid, and then used for FISH analysis. The area of the tumor from where the scrape was obtained was then submitted in a designated cassette. After routine processing and paraffin embedding, this block was used for IHC.
Immunohistochemistry
Zymed Antibody
After deparaffinization, slides were placed on the Ventana ES automated immunostainer and stained with the following protocol: Protease 2, 4 min, and primary antibody, c-erbB-2 (Zymed Laboratories, San Francisco, CA; clone TAB250), 1:10 dilution, for 32 min. The staining was completed with the 3-amino-3-ethylcarbazole (AEC) detection kit (Sigma, St. Louis, MO), and slides were counterstained with hematoxylin.
Ventana Antibody
After deparaffinization, slides were placed on the Ventana ES automated immunostainer and stained with c-erbB-2 antibody (Ventana Laboratories, Tucson, AZ; clone CB11) for 32 min. The staining was completed with the AEC detection kit, and slides were counterstained with hematoxylin. No enzyme digestion was used.
Dako Antibody
Sections were placed in citrate buffer, 10 mm, pH 6.0, microwaved on high for 15 min, and sat in hot buffer for an additional 15 min. Sections were then placed on the Ventana automated stainer using the following protocol: primary polyclonal c-erbB-2 antibody (Dako Laboratories, Carpinteria, CA), 1:200 dilution, incubated for 32 min and followed by the AEC detection protocol. Sections were then counterstained with hematoxylin.
All of the above protocols were conducted according to the manufacturers' recommendations. The same known H2N-positive case of invasive ductal carcinoma was used for positive immunostaining control with the three antibodies, and conditions were kept constant to maintain uniform the intensity of the staining in the control throughout the experiment. For negative control, the tissue was processed in the same way, except that the primary antibody was omitted (buffer substitution).
Interpretation
All slides were reviewed by two pathologists, who were unaware of the status of the gene amplification. Each slide was scored according to the following scale:
-
No discernible staining or, at most, faint, background-type staining without localization to the plasma membrane.
-
1+: These cases were easily confused with 0 staining from low power. Examination under high power revealed faint (usually focal) staining with a discernible but incomplete plasma membrane pattern (Fig. 1).
FIGURE 1 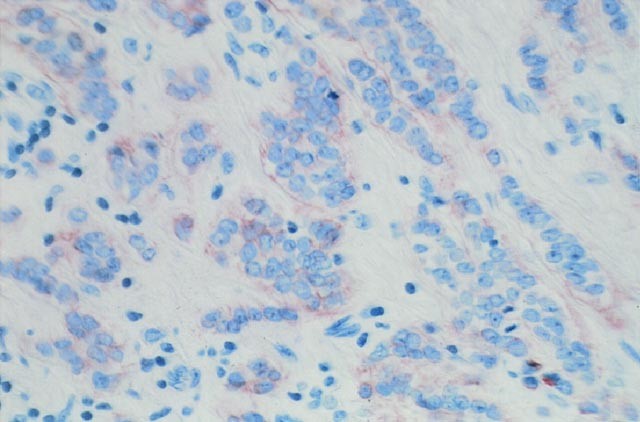
1+ staining. Faint, focal, and incomplete membranous pattern (c-erbB-2 mouse monoclonal antibody).
-
2+: Tissue staining in this type of case was recognized at low power, but examination under high power was necessary to identify a complete, unequivocal membranous staining pattern (Fig. 2).
FIGURE 2 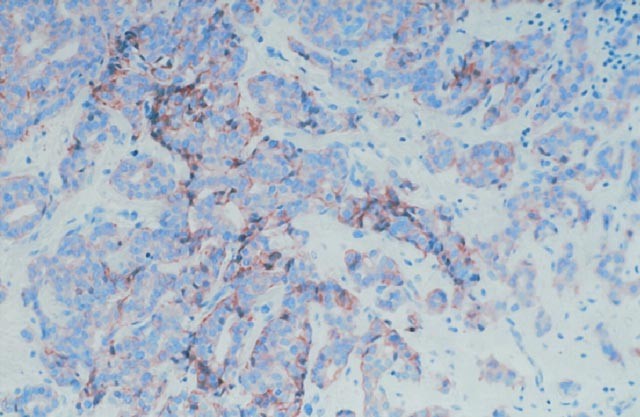
2+ staining. Complete membranous pattern, moderate intensity (c-erbB-2 mouse monoclonal antibody).
-
3+: Strong complete plasma membrane pattern that could be appreciated at low power (Fig. 3).
FIGURE 3 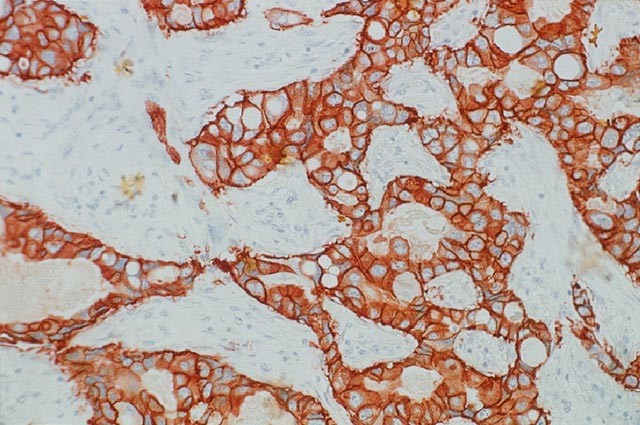
3+ staining. Strong, complete membranous pattern (c-erbB-2 mouse monoclonal antibody).


In addition, the approximate percentage of tumor cells that showed staining was recorded. Finally, staining of accompanying benign epithelium, if present, was also scored as noted above.
FISH
Thirty-six cases were hybridized using probes purchased from Oncor (Gaithersburg, MD), and 10 cases were hybridized using probes purchased from Vysis (Downers Grove, IL). Five cases were hybridized using both probes, and the results were comparable.
Oncor Probe
Genomic sequence probes for c-erbB-2 and chromosome 17 alpha-satellite probes were applied separately to two different slides. Both probes were digoxigenin conjugated. Hybridization was performed in two slides as follows: After slide dehydration with graded ethanol washes, denaturation was performed by incubation in 70% formamide 2 × standard saline citrate solution at 70° C. Hybridization was carried out in a humidified chamber (4- to 16-hour incubations at 43° C). After washes in formamide and phosphate buffer detergent solution, pH 8.0, rhodamine antidigoxigenin/FITC-avidin was applied to slides (45 μl; 15 min at 37° C). Nuclei were counterstained with DAPI (Sigma) and then examined using a fluorescence microscope.
Vysis Probe
Ten cases were simultaneously hybridized with a locus-specific identification probe for c-erbB-2 (spectrum orange) and a chromosome 17 centromere enumeration probe (spectrum green). Dehydration and denaturation were performed as described above, and hybridization was done as described in the probe preparation section of the Vysis centromere enumeration probe and locus-specific identification protocol. Nuclei were counterstained with DAPI and then examined using a fluorescence microscope.
Cell Counting
All cell counts were performed by one investigator (TW) in a Zeiss Axioscope. Between 100 and 300 nonoverlapped nuclei were counted for each hybridization, and signals were recorded and tabulated in the following categories: 1 to 2 signals per nucleus (spn), 3 spn, 4 spn, 5 to 10 spn, 11 to 20 spn, and more than 20 spn.
Interpretation
H2N gene amplification was classified as unequivocally present if more than five copies of the gene were present in more than 80% of the counted nuclei. Amplification was absent if more than 80% of the nuclei counted contained two or fewer gene copies. Cases that did not fulfill these criteria were considered as having equivocal amplification. In addition, tumors were classified as monosomic, disomic, trisomic, or tetrasomic if more than 80% of nuclei contained one, two, three, or four copies of chromosome 17, respectively. Cases that did not fulfill these criteria were classified as heterogeneous and contained a variable number of chromosome copies per nuclei (Fig. 4). By analyzing the relationship between the number of copies of the H2N gene and the number of chromosomes 17, we classified each case as discordant or concordant. Discordant cases were those in which the difference between H2N gene copies and chromosome 17 copies within each number category was more than 15%.

Chromosome 17 alpha centromere labeling by FISH. Note the variable number of signals within each nucleus (heterogeneity).
RESULTS
Histology
Of the 41 cases, 7 (17%) were ductal carcinomas in situ and 34 (83%) were invasive tumors, of which 10 cases had an in situ component in the slide examined. Seven of the invasive tumors (21%) were moderately differentiated, whereas 27 (79%) were poorly differentiated. Thirty-one (75%) cases had lymph node sampling at the time of the procedure, of which 17 (55%) were negative and 14 (45%) were positive for metastatic carcinoma. Of the seven in situ tumors, one (14%) was low grade, four (57%) were intermediate grade, and two (29%) were high grade.
Immunohistochemistry
Table 1 shows the immunostaining results for the invasive tumors (n = 34). With the Zymed antibody, 14 were negative, 5 had 1+ staining pattern, 5 had 2+ staining pattern, and 10 had 3+ staining pattern. Benign areas showed weak and focal (1+) staining in 39% of cases, predominantly in the periphery of the tissue section. It was seen in cases with 0 (4 of 12), 1+ (1 of 5), 2+ (2 of 4), and 3+ (4 of 7) staining of the malignant epithelium. With the Ventana antibody, 16 cases were negative, 9 had 1+ staining, 1 had 2+ staining, and 8 had 3+ staining. Thirty-three percent of cases that contained non-neoplastic epithelium showed staining of the benign cells. Again, all staining was 1+ and was seen less frequently in cases with 0 (3 of 14) or 1+ (1 of 3) versus 2+ (1 of 1) or 3+ (3 of 6) staining of the malignant epithelium. With the Dako antibody, 15 cases showed no staining of the tumor cells, 6 had 1+ staining, 3 had 2+ staining, and 10 had 3+ staining. Only 3 (11%) of the cases that contained non-neoplastic epithelium showed staining (1+) of accompanying benign epithelium.
There was a strong relationship between the proportion of immunoreactive neoplastic cells and the intensity of staining for each antibody (Table 1). The mean percentage of immunoreactive tumor cells was 31% for 1+ staining, 60% for 2+ staining, and 86% for 3+ staining with the Zymed antibody; 27% for 1+ staining, 90% (only one case) for 2+ staining, and 83% for 3+ staining with the Ventana antibody; and 38% for 1+ staining, 63% for 2+ staining, and 90% for 3+ staining with the Dako antibody. However, three cases with 3+ staining with the Zymed antibody had only 50 to 60% of cells staining. With the Ventana antibody, three 3+-staining cases had 40%, 60%, and 70% of the cells staining, and with the Dako antibody, one 3+-staining case had 60% and another one had 70% of the cells staining. If we look at the 1+ staining cases, one case with the Zymed antibody, one with the Ventana antibody, and two with the Dako antibody had more than 80% of the cells staining. Of the 10 cases that contained both an in situ and an invasive component, 4 had 3+ staining in both components and 3 had 0 staining in both components (i.e., with all three antibodies). Of the remaining three, one case showed 1+ staining of the invasive component and 2+ staining of the in situ component with the Dako and Zymed antibodies, and another one showed this phenomenon only with the Dako antibody.
FISH
Ten of 34 (29%) invasive tumors had unequivocal amplification of the H2N gene. Eight of these cases had more than 80% of nuclei with more than 10 spn, and the other two had more than 60% of nuclei with more than 10 spn. Amplified tumors typically contained large numbers of signals (20 to 50), often distributed in clusters (Fig. 5). Nine cases (26%) exhibited equivocal amplification; in each of these cases, there was heterogeneous distribution of gene copy number per nucleus. All had at least some nuclei with more than 5 copies, but only one exhibited a significant proportion of nuclei (7%) with more than 10 copies of the gene. Five of the nine hybridizations were also heterogeneous with respect to chromosome 17 copy number.

Her-2/neu (H2N) gene amplification. Numerous (more than 20) signals are present within each nucleus. Cases with 3+ immunostaining were invariably associated with high H2N copy number. Note the smaller size of the H2N signal compared with that of chromosome 17 in Figure 4. (Because photographs are taken from an intact spherical nucleus, florescent signals may be in different levels of focus and may appear blurred.)
Of the invasive tumors, 3 had chromosome 17 monosomy, 14 were disomic, 2 were trisomic, 3 were tetrasomic, and 12 were heterogeneous. Table 2 shows the relationship between gene amplification status and chromosome 17 status. Whereas the negative amplification cases were predominantly disomic (9 of 15), most of the equivocal cases were aneusomic (8 of 9). Note that a significant number of amplified tumors were also disomic (4 of 10). Table 2 also shows the relationship between the number of H2N gene copies and the number of chromosome 17 copies. All amplified cases were discordant (i.e., H2N copies exceeded chromosome 17 copies). However, discordance was also seen in three cases with equivocal amplification and in four cases with negative amplification status. Of these, three had most cells with double the number of chromosome 17 copies relative to H2N gene copy number (4:2, 4:2, 2:1), whereas in one case, the opposite was true (1:2). Note that most cases of equivocal amplification (six of nine) were concordant, suggesting that the increased H2N gene copies were due to chromosome 17 aneuploidy.
Table 3 summarizes the relationship between H2N staining and amplification status in the invasive tumors. With the Zymed antibody, all 3+ tumors had unequivocal gene amplification and all unequivocally amplified tumors had 3+ staining. All 2+ staining cases had negative (n = 3) or equivocal (n = 2) gene amplification. Two 1+ staining cases were equivocal for gene amplification, and three were negative. Cases with no staining were negative (n = 9) or equivocal (n = 5) for gene amplification. With the Ventana antibody, all 3+ had unequivocal gene amplification; however, two cases with unequivocal amplification by FISH exhibited 1+ staining. Repeated processing of these two cases rendered the same results. Whereas the 2+ staining case was negative for amplification, the 1+ cases had negative (n = 2), equivocal (n = 5), or unequivocal (n = 2) gene amplification by FISH. Twelve cases with 0 staining were negative, and 4 were equivocal for gene amplification. With the Dako antibody, all 3+ staining tumors (n = 10) had unequivocal gene amplification and all unequivocally amplified tumors showed 3+ staining. The 2+ staining tumors showed negative (n = 2) or equivocal (n = 1) gene amplification, the 1+ cases showed negative (n = 5) or equivocal (n = 1) amplification, and the 0 staining cases showed negative (n = 8) or equivocal (n = 7) gene amplification by FISH. Thus, of seven cases that showed 2+ staining with any antibody, four (57%) had negative gene amplification and three (43%) had equivocal amplification.
Ductal Carcinoma In Situ Cases
Table 4 summarizes the findings in the seven ductal carcinomas in situ (DCIS). Four of the seven cases were heterogeneous with regard to chromosome 17 copies. Two cases (both discordant) had unequivocal gene amplification, three (all concordant) were equivocal, and two (both concordant) were negative. With the Zymed antibody, one case with no staining was equivocal for gene amplification; two cases with 2+ staining were negative (n = 1) or equivocal (n = 1); and four cases with 3+ had unequivocal (n = 2), equivocal (n = 1), and negative (n = 1) amplification. With the Ventana antibody, three cases with 1+ staining were equivocal (n = 2) or negative (n = 1) for gene amplification, two cases with 2+ staining were equivocal (n = 1) and negative (n = 1) for gene amplification, and two cases with 3+ staining were unequivocally amplified. With the Dako antibody, three cases with 2+ staining were equivocal (n = 2) or negative (n = 1) for gene amplification and four cases with 3+ staining were negative (n = 1), equivocal (n = 1), or unequivocal (n = 2) for gene amplification. Thus, 3+ staining (i.e., overexpression) with no gene amplification was observed only in DCIS tumors and occurred with two of the three antibodies.
DISCUSSION
The H2N gene encodes a transmembrane protein with an extracellular growth factor receptor domain and an intracellular tyrosine kinase domain (7). H2N has been associated with a poor prognosis in breast carcinoma, particularly in node-positive patients (8) and in at least a subset of node-negative patients (2). Some authors have suggested that the prognostic value of H2N reflects responsiveness to chemotherapy (3). The recent development of a therapeutic anti-H2N antibody has driven further interest in determining H2N status in breast carcinoma (4, 9).
FISH has become an increasingly popular technique to determine H2N status in breast (3, 10, 11, 12, 13) and other carcinomas (14, 15, 16, 17, 18, 19), by quantitation of gene copy duplication. Most studies of H2N status in breast cancer using FISH, however, have been performed in archival, formalin-fixed, paraffin-embedded tissue (10, 13). Although this technique provides optimal correlation between morphology and hybridization findings, it introduces fixation and, most important, sectioning artifacts that may interfere with the interpretation and quantification of signals. Furthermore, signals from hybridizations performed in touch preps containing whole nuclei are, in contrast, larger and brighter, well delineated from surrounding cells, and thus more readily counted and not numerically altered by sectioning artifacts (20). Because the background of stroma and inflammatory cells is usually underrepresented at the time of preparing the smear, contamination by these cells is minimal and, in any event, easily identified. Our study thereby optimized the analysis of H2N gene copy status.
Studies in the literature using FISH are difficult to compare because of the differences in criteria to define amplification; these include the ratio between gene copies to chromosome 17 copies (11, 12), an absolute number of gene copies (16, 21), and the mean number of copies (10). Variability of criteria reflects attempts to correct for artifacts, as well as intrinsic tumor heterogeneity. We found 29% of invasive tumor cases to have unequivocal amplification (per our definition) of the H2N, which is comparable to previously published literature (3, 5, 10, 22). Our data show that there is a discrete, well-defined subset of breast carcinomas with more than 10 copies of the H2N gene in most tumor-cell nuclei. In all such cases, H2N signal gain was disproportionate compared with chromosome 17 signals. With the use of intact cells, such tumors are readily distinguished from tumors with equivocal amplification (i.e., fewer than five copies of the nuclei in the majority of the cells), which is usually secondary to chromosome 17 polysomy or tumor heterogeneity. In either event, equivocal amplification does not translate into strong (3+) protein overexpression. Xing et al. (10) identified a subset of patients with what they defined as “low-grade amplification” (mean signal number, 2 to 8/nucleus). This group had a significantly lower incidence of recurrence compared with the high-grade amplification cases. They did not, however, correct for the presence of chromosome 17 aneuploidy. Other authors have obviated this problem by defining amplification on the basis of the ratio of H2N signals to the chromosome 17 copy number (11, 12). Our data suggest that this may result in a significant number of false positives, because discordance may be observed in cases that do not have more than two copies of the gene.
As with FISH, comparison of previous immunohistochemical studies is also problematic because of variability of criteria to interpret staining. Most studies considered only membranous pattern as positive, whereas others (21) considered cytoplasmic pattern also as positive; and whereas most investigators have used a four-tier (5, 6, 12) or three-tier (14) grading system to evaluate IHC, others have used the percentage of cells with staining as criterion of positivity in IHC (23). Although we found that intensity of staining correlates with extent of staining, the latter was less reliably correlated with gene copy status, as we found numerous discrepant cases. This may have important diagnostic implications, as grading of staining may be subject to a larger degree of interpretation subjectivity than counting the actual percentage of positive-staining cells. In our series, invasive carcinomas with 3+, unequivocal staining pattern were uniformly associated with unequivocal gene amplification and cases with unequivocal amplification were associated with 3+ staining pattern, except for two cases with the Ventana antibody. Similarly, 0 and 1+ staining are uniformly reliable indicators of nonamplified gene status and vice versa. Most problematic was the intermediate category of staining (2+), which did not correlate with gene amplification but could be potentially confused with 3+ staining. Thus, it is critical to optimize staining and standardize criteria for interpretation. Nevertheless, it should be acknowledged that a subset of cases may be subject to variable interpretation.
Other authors found overexpression of H2N protein without gene amplification. Persons et al. (12) compared FISH with IHC performed in touch preps from frozen pulverized tissue. They defined gene amplification exclusively on the basis of the ratio of H2N gene signals to chromosome 17 centromere signals and graded the IHC intensity based on a 4-tier system, considering both 2+ and 3+ intensities as positive. They found 11 of their 100 cases to have discordant FISH and IHC results. Two of them had positive amplification by FISH and were negative by IMH, and nine had positive IMH results but were negative by FISH. After repeated analysis of these cases, one of the positive FISH cases was reinterpreted as negative, one of the negative cases by IMH was reinterpreted as positive, and one of the positive cases by IMH was reinterpreted as negative, leaving eight discrepant cases (8%), all of them having positive IMH results but negative amplification by FISH. Ratcliffe et al. (22) performed simultaneous staining of H2N membranous expression by IHC with detection of gene copies by immunohistochemical in situ hybridization. They described a small subset of tumors that had positive membranous staining, without evidence of nuclear staining of the gene. In our series, most 2+ cases (with any antibody) were 1+ or 0 staining with the other two antibodies and none was 2+ with all three antibodies. These data imply that 2+ staining in at least some tumors may be the result of artifactually high sensitivity and is unlikely to represent “true” overexpression. Nevertheless, “true” overexpression without gene amplification has been described in 3 to 10% of breast carcinomas (22, 24). Identification of these cases may be performed by Southern and Western blot analysis or by messenger RNA in situ hybridization. Other mechanisms besides gene amplification, such as increased activity of the OB2–1 transcription protein (25, 26), are probably related to this phenomenon.
Staining without amplification arguably may be the result of inadequate dilution of the antibody. We attempted to control for sensitivity by assessing the staining of the adjacent benign epithelium. Despite deliberate elimination of staining in benign cells during titration in positive controls, benign cells showed weak staining in some cases. Because this correlated poorly with staining of the tumor cells in intensity or distribution with any antibody, we believe that the staining of benign structures is unlikely to be entirely dilution dependent. Some authors proposed that staining of the normal epithelium represents detection of preneoplastic genetic changes in the normal-appearing epithelium (22).
It thus is likely that analysis of at least some cases by IHC may be problematic with respect to interpretation. In such cases, FISH may provide useful data to classify a patient as H2N positive or negative. The importance of accurate determination of the H2N status for an individual patient is stressed by the reported relatively high incidence of myocardial toxicity in patients who use Herceptin (27).
Analysis of H2N in DCIS is interesting. Two cases with 3+ staining using the Zymed antibody and two with the Dako antibody had negative or equivocal amplification, a phenomenon not seen in the invasive tumors. Thus, it seems that overexpression without amplification may be more frequently observed in DCIS cases than in the invasive cases (0 of 34). Furthermore, if we were to accept that 2+ staining represents true overexpression (i.e., does not correspond to false-positive staining), then overexpression without gene amplification was seen in 4 of 7 DCIS cases with the Zymed antibody (compared with 6 of 34 invasive cases), in 2 of 7 DCIS cases with the Ventana antibody (compared with 1 of 34 invasive cases), and in 5 of 7 DCIS cases with the Dako antibody (compared with 3 of 34 invasive cases). Previous studies found a higher incidence of H2N staining in DCIS cases than in invasive carcinomas (23), suggesting that H2N plays a role in the preinvasive stages of ductal carcinomas. We observed a stronger staining pattern of the in situ tumor compared with the invasive tumor in at least two cases that contained both components. Further study is needed to clarify the specific role of this biologic marker at different levels of the spectrum of development of breast carcinoma.
CONCLUSION
-
H2N gene amplification is seen in approximately 30% of cases of invasive breast carcinoma and is highly associated with overexpression.
-
Strong H2N immunostaining is highly associated with gene amplification, although there is minor variation in sensitivity among different antibodies used for IHC. In some cases, correlation with FISH data may be necessary to optimize interpretation of IHC stains.
-
A subset of breast carcinomas (3 to 15%) demonstrate moderate H2N staining without evidence of amplification, and it is unclear whether they represent highly sensitive staining or are a subset of cases that show overexpression without amplification.
-
Gene amplification, as detected by FISH, is usually associated with a high number of gene copies per nucleus. Low-grade duplication of H2N gene (3 to 4 copies/cell) is usually the result of chromosome 17 polysomy and is not associated with high-level overexpression.
-
Overexpression without amplification may be more frequent in DCIS, raising questions about different roles of H2N in the biology of preinvasive neoplasm.
References
Kallioniemi OP, Holli K, Visakorpi T, Koivula T, Helin HH, Isola JJ . Association of c-erbB-2 protein over-expression with high rate of cell proliferation, increased risk of visceral metastasis and poor long-term survival in breast cancer. Int J Cancer 1991; 49: 650–655.
Babiak J, Hugh J, Poppema S . Significance of c-erbB-2 amplification and DNA aneuploidy: analysis in 78 patients with node-negative breast cancer. Cancer 1992; 70: 770–776.
Allred DC, Harvey JM, Berardo M, Clark GM . Prognostic and predictive factors in breast cancer by immunohistochemical analysis. Mod Pathol 1998; 11: 155–168.
Baselga J, Norton L, Albanell J, Kim YM, Mendelsohn J . Recombinant humanized anti-HER2 antibody (Herceptin) enhances the antitumor activity of paclitaxel and doxorubicin against HER2/neu overexpressing human breast cancer xenografts. Cancer Res 1998; 58: 2825–2831.
Pauletti G, Godolphin W, Press MF, Slamon DJ . Detection and quantitation of HER-2/neu gene amplification in human breast cancer archival material using fluorescence in situ hybridization. Oncogene 1996; 13: 63–72.
Press MF, Hung G, Godolphin W, Slamon DJ . Sensitivity of HER-2/neu antibodies in archival tissue samples: potential source of error in immunohistochemical studies of oncogene expression. Cancer Res 1994; 54: 2771–2777.
De Potter CR, Schelfhout AM . The neu-protein and breast cancer. Virchows Arch 1995; 426: 107–115.
Toikkanen S, Helin H, Isola J, Joensuu H . Prognostic significance of HER-2 oncoprotein expression in breast cancer: a 30-year follow-up [see comments]. J Clin Oncol 1992; 10: 1044–1048.
Baselga J, Tripathy D, Mendelsohn J, Baughman S, Benz CC, Dantis L, et al. Phase II study of weekly intravenous recombinant humanized anti-p185HER2 monoclonal antibody in patients with HER2/neu-overexpressing metastatic breast cancer [see comments]. J Clin Oncol 1996; 14: 737–744.
Xing WR, Gilchrist KW, Harris CP, Samson W, Meisner LF . FISH detection of HER-2/neu oncogene amplification in early onset breast cancer. Breast Cancer Res Treat 1996; 39: 203–212.
Sauter G, Feichter G, Torhorst J, Moch H, Novotna H, Wagner U, et al. Fluorescence in situ hybridization for detecting erbB-2 amplification in breast tumor fine needle aspiration biopsies. Acta Cytol 1996; 40: 164–173.
Persons DL, Borelli KA, Hsu PH . Quantitation of HER-2/neu and c-myc gene amplification in breast carcinoma using fluorescence in situ hybridization. Mod Pathol 1997; 10: 720–727.
Press MF, Bernstein L, Thomas PA, Meisner LF, Zhou JY, Ma Y, et al. HER-2/neu gene amplification characterized by fluorescence in situ hybridization: poor prognosis in node-negative breast carcinomas. J Clin Oncol 1997; 15: 2894–2904.
Ishikawa T, Kobayashi M, Mai M, Suzuki T, Ooi A . Amplification of the c-erbB-2 (HER-2/neu) gene in gastric cancer cells: detection by fluorescence in situ hybridization. Am J Pathol 1997; 151: 761–768.
Ooi A, Kobayashi M, Mai M, Nakanishi I . Amplification of c-erbB-2 in gastric cancer: detection in formalin-fixed, paraffin-embedded tissue by fluorescence in situ hybridization. Lab Invest 1998; 78: 345–351.
Riben MW, Malfetano JH, Nazeer T, Muraca PJ, Ambros RA, Ross JS . Identification of HER-2/neu oncogene amplification by fluorescence in situ hybridization in stage I endometrial carcinoma. Mod Pathol 1997; 10: 823–831.
Sauter G, Moch H, Gasser TC, Mihatsch MJ, Waldman FM . Heterogeneity of chromosome 17 and erbB-2 gene copy number in primary and metastatic bladder cancer. Cytometry 1995; 21: 40–46.
Saffari B, Jones LA, El-Naggar A, Felix JC, George J, Press MF . Amplification and overexpression of HER-2/neu (c-erbB2) in endometrial cancers: correlation with overall survival. Cancer Res 1995; 55: 5693–5698.
Ross JS, Sheehan CE, Hayner-Buchan AM, Ambros RA, Kallakury BV, Kaufman RP Jr, et al. Prognostic significance of HER-2/neu gene amplification status by fluorescence in situ hybridization of prostate carcinoma. Cancer 1997; 79: 2162–2170.
Visscher DW, Wallis T, Ritchie CA . Detection of chromosome aneuploidy in breast lesions with fluorescence in situ hybridization: comparison of whole nuclei to thin tissue sections and correlation with flow cytometric DNA analysis. Cytometry 1995; 21: 95–100.
Ross JS, Sheehan C, Hayner-Buchan AM, Ambros RA, Kallakury BV, Kaufman R, et al. HER-2/neu gene amplification status in prostate cancer by fluorescence in situ hybridization. Hum Pathol 1997; 28: 827–833.
Ratcliffe N, Wells W, Wheeler K, Memoli V . The combination of in situ hybridization and immunohistochemical analysis: an evaluation of Her2/neu expression in paraffin-embedded breast carcinomas and adjacent normal-appearing breast epithelium. Mod Pathol 1997; 10: 1247–1252.
Allred DC, Clark GM, Molina R, Tandon AK, Schnitt SJ, Gilchrist KW, et al. Overexpression of HER-2/neu and its relationship with other prognostic factors change during the progression of in situ to invasive breast cancer. Hum Pathol 1992; 23: 974–979.
Slamon DJ, Godolphin W, Jones LA, Holt JA, Wong SG, Keith DE, et al. Studies of the HER-2/neu proto-oncogene in human breast and ovarian cancer. Science 1989; 244: 707–712.
Hollywood DP, Hurst HC . A novel transcription factor, OB2–1, is required for overexpression of the proto-oncogene c-erbB-2 in mammary tumour lines. EMBO J 1993; 12: 2369–2375.
Hollywood DP, Hurst HC . Targeting gene transcription: a new strategy to down-regulate c-erbB-2 expression in mammary carcinoma. Br J Cancer 1995; 71: 753–757.
Dillman R . Unconjugated monoclonal antibodies for the treatment of hematologic and solid malignancies. In: Perry MC, editor. American Society of Clinical Oncology 1999 educational book. Alexandria, VA: American Society of Clinical Oncology; 1999. pp. 460–482.
Author information
Authors and Affiliations
Additional information
Presented at the United States and Canadian Academy of Pathology 88th Annual Meeting, San Francisco, CA, March 20–26, 1999.
Rights and permissions
About this article
Cite this article
Jimenez, R., Wallis, T., Tabasczka, P. et al. Determination of Her-2/Neu Status in Breast Carcinoma: Comparative Analysis of Immunohistochemistry and Fluorescent In Situ Hybridization. Mod Pathol 13, 37–45 (2000). https://doi.org/10.1038/modpathol.3880007
Accepted:
Published:
Issue Date:
DOI: https://doi.org/10.1038/modpathol.3880007
Keywords
This article is cited by
-
The clinical and biological significance of HER2 over-expression in breast ductal carcinoma in situ: a large study from a single institution
British Journal of Cancer (2019)
-
Comparison of the types of candidate reference samples for quality control of human epidermal growth factor receptor 2 status detection
Diagnostic Pathology (2016)
-
Updated 2013 College of American Pathologists/American Society of Clinical Oncology (CAP/ASCO) guideline recommendations for human epidermal growth factor receptor 2 (HER2) fluorescent in situ hybridization (FISH) testing increase HER2 positive and HER2 equivocal breast cancer cases; retrospective study of HER2 FISH results of 836 invasive breast cancers
Breast Cancer Research and Treatment (2016)
-
Cyclin D1 gene amplification is highly homogeneous in breast cancer
Breast Cancer (2016)
-
Correlation of HER2 gene status assessment by fluorescence in situ hybridization between histological sections and cytological specimens of breast cancer
Breast Cancer (2016)
