
Abstract
Central Asia has served as a corridor for human migrations providing trading routes since ancient times. It has functioned as a conduit connecting Europe and the Middle East with South Asia and far Eastern civilizations. Therefore, the study of populations in this region is essential for a comprehensive understanding of early human dispersal on the Eurasian continent. Although Y- chromosome distributions in Central Asia have been widely surveyed, present-day Afghanistan remains poorly characterized genetically. The present study addresses this lacuna by analyzing 190 Pathan males from Afghanistan using high-resolution Y-chromosome binary markers. In addition, haplotype diversity for its most common lineages (haplogroups R1a1a*-M198 and L3-M357) was estimated using a set of 15 Y-specific STR loci. The observed haplogroup distribution suggests some degree of genetic isolation of the northern population, likely due to the Hindu Kush mountain range separating it from the southern Afghans who have had greater contact with neighboring Pathans from Pakistan and migrations from the Indian subcontinent. Our study demonstrates genetic similarities between Pathans from Afghanistan and Pakistan, both of which are characterized by the predominance of haplogroup R1a1a*-M198 (>50%) and the sharing of the same modal haplotype. Furthermore, the high frequencies of R1a1a-M198 and the presence of G2c-M377 chromosomes in Pathans might represent phylogenetic signals from Khazars, a common link between Pathans and Ashkenazi groups, whereas the absence of E1b1b1a2-V13 lineage does not support their professed Greek ancestry.
Introduction
The Islamic Republic of Afghanistan is a landlocked nation in southwest Central Asia. Its central highlands include the Hindu Kush Mountains that extend from the northeast of the country to the southwest, separating Afghanistan into northern and southern provinces (Figure 1). Afghanistan has served as crossroads for human migrations and pilgrimages, including an important stop along the Silk Road. Mesolithic artifacts, Neolithic pottery (about 7.2 kya), bones of domesticated animal and tools (eg, sickle blades used to collect wild grasses) have been uncovered during excavations in the Ghar-i-Mar (Snake Cave) site, in north Afghanistan, indicating early cultivation of wheat and barley (9–11 kya) and domestication of animals (7–9 kya).1 More recent archeological discoveries include Buddhist relics transported northward from India along the Silk Road, as well as inscriptions engraved on rocks in ancient Hebrew dating from the eleventh to the thirteenth centuries.2 Although it is still unknown when urban civilizations began in what is now Afghanistan, historians speculate that it possibly occurred between 4 and 4.5 kya.3 Historical records indicate that Aryans from Iran were the first to occupy Afghanistan (eighth century B.C.E.) followed by Persians (sixth century B.C.E), Greeks (fourth century B.C.E.), Mauryans from India (ushered Buddhism into the region), Greco-Bactrians, Arabs (introduced Islam) and Mongols among others.3
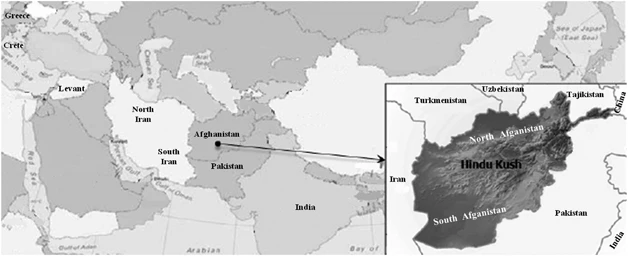
Geographic location of the populations analyzed for CA, ML and AMOVA. For population description see references in Table 1.
The official languages of Afghanistan, Dari and Pashto, are of Indo-European origin and are spoken by the Tajiks and Pathans or Pashtuns, respectively. Pathans live primarily south of the Hindu Kush Mountains and comprise the most prevalent ethnic group in Afghanistan (42%) while representing approximately 15% of the population of neighboring Pakistan. Although different origins for Pathans, including Greek and Jewish ancestry, have been suggested,3, 4 these affiliations have not been demonstrated and only a few studies characterizing the genetic structure of this group in Pakistan,5, 6, 7, 8, 9 Afghanistan10 and India11 have been published.
Given the limited amount of genetic data available, the present study was undertaken to ascertain, for the first time, the genetic diversity of Pathans in Afghanistan utilizing high-resolution Y-chromosome binary markers. The data generated were subsequently compared with previously published geographically and ethnically targeted worldwide populations to explore paternal signals of modern humans’ dispersals across Central Asia. In addition, we assessed genetic affinities between Pathans from Afghanistan and Pathans from neighboring Pakistan, as well as their hypothesized phylogenetic relation to Greek and Jewish populations.
Materials and methods
Sample collection and DNA isolation
Blood samples were obtained with informed consent from 190 unrelated males representing the general population of Pathans from Afghanistan. The collection was subsequently divided along the Hindu Kush Mountain Range into north Afghanistan (n=44) and south Afghanistan (n=146) to assess the role of the massif as a barrier and/or corridor to gene flow between the two regions (Figure 1). Donors provided information about their paternal ancestry for at least two previous generations. The samples were collected in accordance with the ethical guidelines of the institutions involved in this study. Genomic DNA was extracted and stored as previously described.12, 13
Y-SNP and Y-STR genotyping
A total of 116 bi-allelic markers (Figure 2) were hierarchically genotyped as previously described.14, 15 The nomenclature followed for the Y-SNP haplogroup assignment is in accordance with the Y Chromosome Consortium15 and subsequent updates.16, 17 The 17-loci Y-STR haplotype data from our previous report18 were utilized in the current investigation to perform pertinent Y-STR-based analyses.
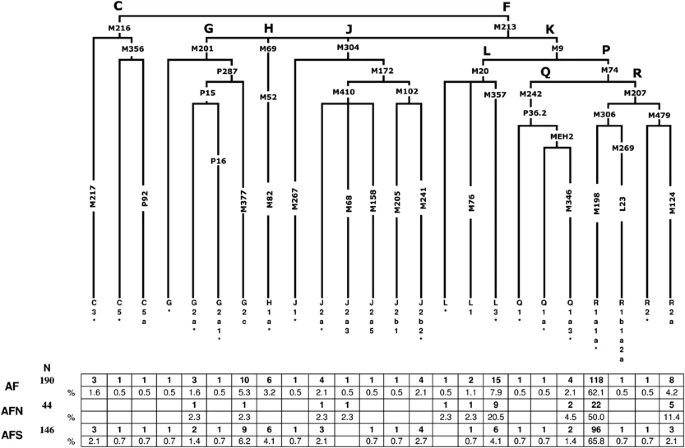
Hierarchical phylogenetic relationships of Y-chromosome haplogroups and their percentages in Afghanistan. The following 77 markers were typed but were not polymorphic in the populations: C3a-M93, C3b-P39, C3c-M77, C3d-M407, C3e-P53.1, C3f-P62, DE-YAP, F1-P92, F2-M427, F2-M428, F3-P96, F3-M282, F4-P254, G1-M285, G2a1a-P18, G2a2-M286, H1a1-M197, H1a2-M97, H1a3-M39, H2-Apt, I-M258, J1a-M62, J1b-M365, J1c-M390, J1d-P56, J1e-PAGE8, J2a1-M47, J2a2-M67, J2a2a-M92, J2a2b-M163, J2a4-M137, J2a6-M289, J2a7-M318, J2a8-M319, J2a9-M339, J2a10-M340, J2a11-M419, J2a12-P81, J2a13-P279, J2b2a-M99, J2b2b-M280, J2b2c-M321, J2b2d-P84, K1-M147, K2-P60, K3-P79, K4-P261, L2-M317, M-P256, NO-M214, O-M175, Q1a1-M120, Q1a2-M25, Q1a3a-M3, Q1a4-P48, Q1a5-P89, Q1a6-M323, Q1b-M378, R1a1a1-M56, R1a1a2-M157, R1a1a3-M204, R1a1a4-P98, R1a1a5-PK5, R1a1a6-M434, R1a1a7-M458, R1b1b1a-M412, R1b1b1a1a-M405/U106, R1b1b1a1b1-U152, R1b1b1a1b2a-M222, R1b1b1a1b2b-M37, R1b1b1a1b2c1-P66, R1b1b1a1b3-M65, R1b1b1a1b4-M153, R1b1b1a1b5-M167, R1b1b-M335, S-M230 and T-M184.
Statistical and phylogenetic analyses
To assess the phylogenetic relationships between the two Afghan collections and 16 geographically targeted reference populations (Table 1),19, 20, 21, 22 a correspondence analysis (CA)23 plot, Maximum-Likelihood (ML)24 dendrogram and Analysis of Molecular Variance (AMOVA)25 were generated. In order to make informative comparisons, the above-mentioned analyses were performed at the highest resolution available across reference populations (Table 1). Pair-wise genetic distances (Rst)26, 27 for populations included in Supplementary Table 1 were calculated using the 7-loci R1a1a-M198 haplotypes with the ‘Microsat’ software (http://hpgl.stanford.edu/projects/microsat/). The Rst distances calculated were subsequently utilized to construct a multi-dimensional scaling (MDS) projection with the statistical software package SPSS ver. 14.0 (SPSS, Chicago, IL, USA, 2001). In addition, spatial frequency maps based on individuals in the L-M20, L3-M357, R1a1a-M198 and R1a1a*-M198 haplogroups were generated using the Surfer software version 9 (Golden software Inc., Cold Spring Harbor, NY, USA; http://www.goldensoftware.com/). Haplotypes of individuals belonging to the above haplogroups were employed to generate median-joining (MJ) networks using NETWORK 4.5.1.6 (http://www.fluxus-engineering.com).28 All reference populations included in the network analyses are provided in Supplementary Table 1 (L-M20, L3-M357, R1a1a-M198 and R1a1a*-M198) and for the contour maps in Supplementary Tables 2 (R1a1a-M198 and R1a1a*-M198) and 3 (L-M20 and L3-M357). Supplementary Table 4 presents haplogroup and haplotype data for north and south Afghanistan.
The Y-STR markers were weighted inversely to their repeat variance20 and the Maximum Parsimony option was selected to obtain the least complex topology.
Expansion times based on Y-STR variation within L-M20, L3-M357, R1a1a-M198 and R1a1a*-M198 lineages present in the reference populations (Supplementary Table 5) were recalculated using the method described elsewhere.8, 29, 30 In addition, haplotype variance for the above-mentioned haplogroups were calculated using the Vp formula provided in Kayser et al.31
Results
Distribution of Y-chromosome haplogroups
From a total of 116 binary markers typed, we identified 25 paternal lineages in 190 Afghan males, 11 of which were observed in north Afghanistan and 22 in the southern collection, (Figure 2) indicating a relatively higher degree of genetic diversity in the region south of the Hindu Kush range with respect to the north. However, this finding should be tempered considering the difference in sample size between the two collections. Overall, only haplogroups R1a1a*-M198 (62.1%), L3*-M357 (7.4%) and G2c-M377 (5.3%) display frequencies >5% and collectively comprise nearly three-fourths of the Afghanistan paternal gene pool.
The majority of the Afghan individuals examined in the current investigation belong to haplogroup R-M207 (67.4%), with sub-haplogroup R1a1a*-M198 predominating in both the north (50%) and south (65.8%) collections (Figure 2). This is also reflected in the contour maps of R1a1a-M198 (Supplementary Figure 1a) and R1a1a*-M198 (Supplementary Figure 1b). It is interesting to note that the paralagous branch, R2a-M124, is observed at a considerably higher proportion in north Afghanistan (11.4%) as compared with the south (2.1%) and that haplogroups R2*-M479 (0.7%) and R1b1a2a-L23 (0.7%) are detected, albeit at low frequencies, exclusively in the southern region of the country.
Haplogroup L-M20 (9.5%), the second most abundant in this study, exhibits substantial disparity in its distribution on either side of the Hindu Kush range, with 25% of the northern Afghans belonging to this lineage, compared with only 4.8% of males from the south. Specifically, paragroup L3*-M357 accounts for the majority of the L-M20 chromosomes in both the north (20.5%) and south (4.1%) collections as evident in the contour maps provided in Supplementary Figures 2a (L-M20) and 2b (L3-M357) in Afghanistan and surrounding regions.
Haplogroup G-M201, which occurs at an average frequency of 7.9% in the Afghan gene pool, is reported at high frequencies in the Caucasus (eg, 74% in Ossetians from Digora)32 and it is thought to be associated with the Neolithic expansion throughout the region.33 Although G2c-M377 is the second most frequent haplogroup in south Afghanistan (6.2%), it is found at substantially lower levels in the northern population (2.3%). With the exception of sub-lineage G2a*-P15, observed in the north (2.3%) and south (1.4%), the remaining G derivatives (G2a1*-P16 (0.7%) and G*-M201 (0.7%)) are found exclusively in the southern provinces. Likewise, haplogroups C-M216 (3.4%) and H1a*-M82 (4.1%) are restricted to individuals from the south. Other informative haplogroups that are shared between the north and south include J-M304 and Q-M242. In the north, the aforementioned haplogroups are defined by the J2a*-M410 (2.3%), J2a3-M68 (2.3%) and Q1a3*-M346 (4.5%) mutations. Southern Afghans, in contrast, are characterized by five sub-clades within haplogroup J-M304 (ie, J1*-M267, J2a*-M410, J2a5-M158, J2b1-M205 and J2b2-M241) collectively at frequency of <3%, as well as by sub-haplogroups Q1a3*-M346 (1.4%), Q1*-P36.2 (0.7%) and Q1a*-MEH2 (0.7%).
Population relationships
In the CA plot (Figure 3a), the collections from north and south Afghanistan are part of a loose aggregate in the right half, near the center of the graph, with several neighboring populations from Pakistan. The Greeks, Ashkenazi Jews and north and south Iranians partition separately from the Pakistani and Afghani collections on the upper-left quadrant. Interestingly, Hazara from Pakistan is an outlier, possibly reflecting its unique ancestry. The genetic affinities of the 18 populations from Table 1 are illustrated in the ML tree (Supplementary Figure 3), where geographic structuring is apparent, with a few exceptions. For example, unlike the partitioning observed in the CA plot, the ML dendrogram illustrates a separation between north and south Iran, with the former branching together with Hazara from Pakistan, an outlier in the CA plot. AMOVA (Table 2) was performed to investigate potential geographic correlations with the genetic profiles of the north and south Afghanistan populations, as well as reference collections. As anticipated, the highest fraction of variability was found within populations. Variance components indicate a greater degree of geographical correlation among groups of populations as compared with among populations within groups.
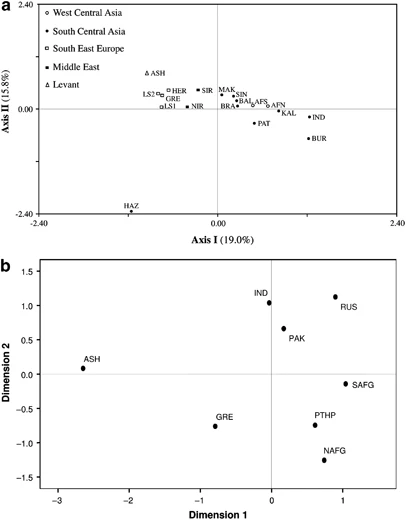
(a) CA constructed utilizing the NTSYSpc 2.02i software (Applied Biostatistics Inc., Setauket, NY, USA) and based on Y-chromosome haplogroups. Population abbreviations are given in Table 1. (b) MDS plot based on Rst distances of R1a1a-M198 haplotype frequencies of Pathans, Ashkenazi Jews, Greeks, Indians and Pakistani samples. For the MDS analysis Stress=0.06142. Population codes are: NAFG=Pathans from north Afghanistan, SAFG=Pathans from south Afghanistan, PTHP=Pathans from Pakistan, RUS=Russians (South Central Russia, South Western Russia, North Western Russia and Uralic Russia), GRE=Greeks, ASH=Ashkenazi Jews, IND=India and PAK=Pakistan general population. Populations used in the analysis are listed in Supplementary Table 1.
The MDS plot based on R1a1a-M198 (Figure 3b) haplotypes was executed to examine the genetic affinities among Pathans from Afghanistan and Pakistan in addition to several other pertinent reference populations (Supplementary Table 1). In Figure 3b, Pathans from Afghanistan and Pakistan plot close to each other in the lower-right quadrant, whereas populations from India, Pakistan and Russia loosely cluster in the upper-right section of the graph. In contrast, the Ashkenazi Jewish collection lies in the upper-left quadrant partitioning distant from all other populations included in the analysis.
Network projections and time estimates
Figure 4a illustrates MJ network based on the eight-loci Y-STR profile of R1a1a*-M198 individuals from different regions throughout Eurasia. The most abundant haplotype (DYS19*16, DYS389I*13, DYS389II*17, DYS390*24, DYS391*11, DYS392*11, DYS393*13 and DYS439*10) is observed in 5 (11.3%) individuals from north Afghanistan and 35 (24%) Afghans from the southern collection. In contrast, the second most common haplotype (DYS19*16, DYS389I*13, DYS389II*17, DYS390*25, DYS391*11, DYS392*11, DYS393*13 and DYS439*10), is prevalent in north Afghanistan (6.8%) compared with the south collection (4.8%) and it is also found among Russia, Ukraine, Slovakia and Turkey. Interestingly, the third most frequent haplotype (DYS19*16, DYS389I*13, DYS389II*17, DYS390*25, DYS391*10, DYS392*11 and DYS393*13) in the R1a1a-M198 projection (Supplementary Figure 4a) is mainly shared among Ashkenazi Jews from western and eastern Europe (4.1%) and south Afghans (3.4%), but absent in individuals from north Afghanistan.
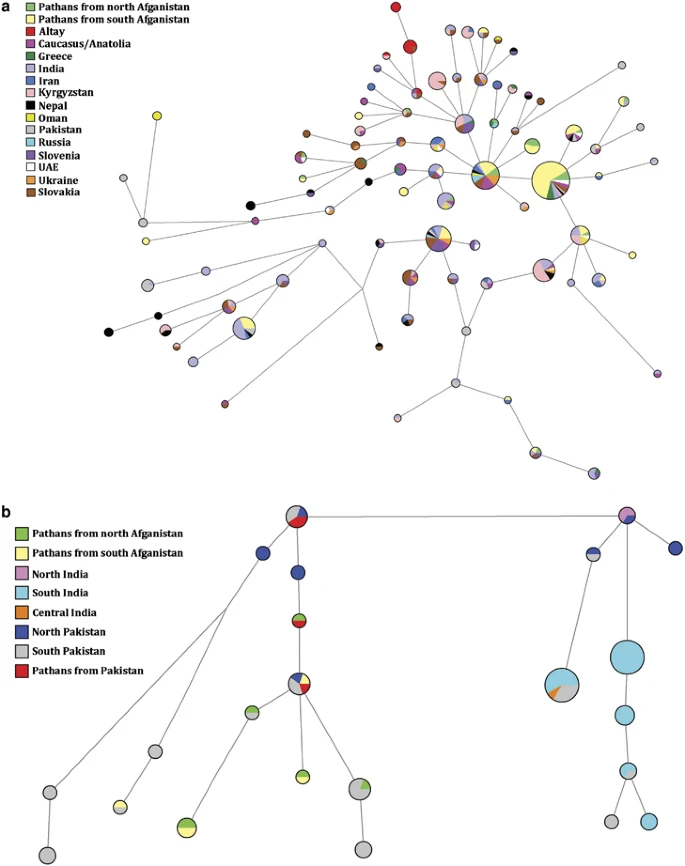
(a) Network projection of populations analyzed for R1a1a*-M198 at the resolution of eight-loci: DYS389I, DYS389II, DYS390, DYS391, DYS392, DYS393, DYS19 and DYS439. (b) Network projection of populations analyzed for L-M20 at the resolution of eight-loci: DYS389I, DYS389II, DYS390, DYS391, DYS392, DYS393, DYS19 and DYS439. Populations used for the analysis are listed in Supplementary Table 1.
In Figure 4b, the most abundant haplotype (DYS19*14, DYS389I*12, DYS389II*16, DYS390*22, DYS391*10, DYS392*14, DYS393*11 and DYS439*13) among the L-M20 individuals examined comprises 7 (2.3%) samples from southern India and 12 (13.2%) from south Pakistan. Only one individual (2.3%) from North Afghanistan shares this haplotype. The other prevalent L-M20 haplotype (DYS19*14, DYS389I*12, DYS389II*16, DYS390*22, DYS391*10, DYS392*14, DYS393*11 and DYS439*12) is shared exclusively among 12 (4.0%) individuals from southern India and 3 (3.3%) from southern Pakistan. A network analysis based on L3-M357 was not informative because of the limited number of individuals and populations available for comparison (Supplementary Figure 4b).
Supplementary Table 5 presents coalescence time estimations based on Y-STR diversity as well as haplotype variances associated with haplogroups L-M20, L3-M357, R1a1a-M198 and R1a1a*-M198 in Afghanistan and other reference populations. In addition, for the studied populations of north and south Afghanistan, we performed time estimate and haplotype variance calculations for L3*-M357. In the case of R1a1a-M198, the evolutionary time estimates based on seven Y-STR loci is 7.8±2.2 kya for the Afghanistan populations. The oldest dates for this haplogroup are observed in Pakistan (19.1±2.9 kya) and India (17.9±3.7 kya). Time estimates for Haplogroup L-M20 in north (14.6±7.3 kya) and south (17.8±8.4 kya) Afghanistan are more recent than in Pakistan (26.3± 5.3 kya). When L3-M357 and Ra1a1*-M198 are considered, the same pattern of relative ages are seen across the above-mentioned populations, with the older dates detected in Pakistan and in the Indian subcontinent.
Discussion
Although both Afghan populations are characterized predominantly by R1a1a*-M198 lineages, the two differ in the distribution of their remaining haplogroups. South Afghanistan is represented by 22 polymorphic binary markers, 14 of which are absent from the northern region (Figure 2), suggesting reduced genetic diversity in the latter population. A plausible explanation for the reduced diversity might be the presence of the Hindu Kush Mountain range, which may have served as a directional barrier to gene flow.
South Central Asian influence in Afghanistan
Haplogroup R1a1a*-M198, unlike other haplogroups, which are more geographically confined, is present at informative frequencies in a wide range of populations extending from Northern and Eastern Europe to Eastern Siberia, Central and Southern Asia.16 Eastern Europe (Ukraine)34 and South Central Asia16, 35 are proposed as the most likely places of origin because in both regions R1a1a-M198 is observed at frequencies >50%. According to Underhill et al,16 the highest Y-STR haplotype diversity for the R1a1a*(xM458) lineage is observed in South Central Asia with a coalescent time of 14 kya, suggesting that this region is the likely source of the dispersal for the M198 mutation. Alternatively, Klyosov36 claims that haplogroup R1a1a-M198 originated in South Siberia about 20 kya. Unfortunately, discrepancies between the methods used to compute TMRCA in these previous studies16, 35, 36 hinder fair comparisons with those generated in the present report. The high R1a1a haplotype diversity observed in the network projection (Supplementary Figure 4a), as well as the substantially older time estimates and high haplotype variance (Supplementary Table 5) obtained for South Central Asia (Pakistan and India) as compared with South Central Russia (Shors and Tuvinians) and Afghanistan, argues for the South Central Asian origin of this marker. Because TMRCA calculations depend on sample size, mutation rate and the number of loci examined, the data generated should be interpreted with caution and alternative approaches and/or interpretation should not be ignored.
The R1a1a-M198 network (Supplementary Figure 4a) indicates that the Afghans exhibit the highest haplotype sharing (total of 69 individuals) with populations from South Central Asia and particularly with Pathans from Pakistan. When the analysis was performed at R1a1a*-M198 (Figure 4a), we see a similar haplotype sharing with South Central Asia. Unfortunately, Pathans from Pakistan were not included in the analysis because they were not typed at the R1a1a*-M198 resolution. Genetic affinities among the above-mentioned populations that share high frequency of R1a1a*(xM458) are also observed in the CA plot (Figure 3a), which illustrates both Afghan populations clustering with most of the neighboring groups from Pakistan, whereas India plots more distantly. This finding is consistent with the AMOVA results, which indicates the impact of geography on population differentiation. However, the second most common seven-loci R1a1a-M198 haplotype (DYS389I*13, DYS389II*17, DYS390*25, DYS391*11, DYS392*11, DYS393*13 and DYS19*16) possessed by 66 individuals in the projection (Supplementary Figure 4a) differs from the modal haplotype by one repeat at locus DYS390 and corresponds to the most abundant haplotype of Russia/Ukraine and the Balkans reported by Klyosov.36 This basal haplotype is also the second most common haplotype in the R1a1a*-M198 network (Figure 4a) with similar groups of populations. The sharing of similar seven-loci haplotypes (mostly differing by a single repeat) along with relatively close age estimates (Supplementary Table 5) among populations with significant R1a1a-M198 frequencies may be indicative of common ancestry.
Haplogroup L-M20, on the other hand, was hypothesized to have originated in India or the Middle East37 approximately 30 kya. This marker, which is found at 25% in north Afghanistan and 4.8% in the south, has also been previously reported at high frequencies (48%) in the Kallar community of South India33 as well as in the Druze (35%) population from Israel.38 Time estimates generated based on seven Y-STR loci within L-M20 lineages for north (14.6±7.3 kya) and south (17.8±8.4 kya) Afghanistan populations are intermediate to those of Pakistan (26.3±5.3 kya) and India (7.5±1.7 kya) (Supplementary Table 5). Furthermore, Pakistan displays higher haplotype variance (0.548) than India (0.118), suggesting that L-M20 most likely originated in what is today Pakistan rather than in India. In addition, evolutionary time estimates (Supplementary Table 5) generated for L3-M357 lineages when combining north and south Afghanistan populations (11.4±5.0 kya) are comparable to those computed for Pakistan (10.8±3.8 kya) and higher than India (5.2±2.4 kya) at the seven-loci resolution. This finding supports the notion that the L3-M357 sub-clade is of Afghani or Pakistani origin and subsequently spread southernly to India.
Similarity between Pathans from Afghanistan and Pakistan
Our study demonstrates close genetic ties between Pathans from Afghanistan and Pakistan. The affinity between Pathans from these two regions is expected considering that the Durand Line, which established Afghanistan southeastern limits since 1893, was imposed without concern to tribal and ethnic affiliations. The CA (Figure 3a) and ML analysis (Supplementary Figure 3) support this genetic similarity since both north and south Afghanistan cluster proximal to Pakistan. The inclusion of additional haplotype data from 41 Pathans residing in the city of Peshawar in northwestern Pakistan5 (available in the YHRD database) indicates that their most abundant seven-loci haplotype (29.3%) is identical to our modal haplotype, confirming the genetic similarities between Pathans from Afghanistan and Pakistan. This phylogenetic relationship is similarly evident in the MDS graph (Figure 3b), where all three Pathan populations group close to each other. Also, in the network projection of R1a1a-M198 (Supplementary Figure 4a), these populations share various haplotypes. Moreover, the presence of haplogroups L3-M357 and Q1a3-M346 in both Pathans from Afghanistan and Pakistan8, 9 further supports genetic relationships among Pathans from these two regions.
On the origins of Pathans
Although Greeks and Jews have been proposed as ancestors to Pathans,3, 4 their genetic origin remains ambiguous. The Lasithi Plateau isolate, in the highlands of eastern Crete, partitions relatively close to the Afghanistan populations in the CA graph (Figure 3a), which could be attributed to the elevated proportion of R1a1a chromosomes20 shared among them. However, the absence of the predominantly Greek E1b1b1a2 -V13 lineage39 in Pathans does not argue for genetic contributions from Greece. Ashkenazi Levites and our north and south Afghanistan populations, on the other hand, exhibit significantly higher frequency of the R1a1a-M198 haplogroup (51.7%, 50.0% and 65.8%, respectively), whereas lower frequencies are detected in Ashkenazi Cohanims (1.3%) and Ashkenazi Israelites (4.0%).40 Overall, Ashkenazi Jews exhibit a frequency of 15.3% for haplogroup R1a1a-M198.37 Nebel et al41 proposed, on the basis of moderate to high frequency of R1a1a in Central Asia and southern Russia/Ukraine, that these R1a1a chromosomes in Ashkenazi groups might represent vestiges of Khazars. It is thought that this Turkic tribe from Central Asia had converted to Judaism at the end of the Eighth century C.E. and, after the fall of their kingdom, they spread and were assimilated by the emerging Ashkenazi community in Eastern Europe. We envision a plausible scenario in which the converted Khazars could have been absorbed by the early Pathans and that R1a1a-M198 drifted to high frequency in Afghanistan, with the Khazars being the common nexus between Ashkenazi Jews and Pathans. In addition, the Jewish traditions (particularly circumcision, a talith prayer shawl, shabbat, praying in the direction of Jerusalem during the Day of Atonement or Yom Kippur and the Magen David symbol in their houses, among several others)2 observed among Pathans from Afghanistan and the presence of haplogroup G2c-M377, a lineage commonly observed among the Ashkenazi Jewish population (∼7%),42 are congruent with the above-stated hypothesis.
Conclusion
The diversity of Y-chromosome haplogroups in the Afghanistan populations examined in this study reflects the history of the area signaling multiple migrations over thousands of years. Our results indicate that Afghanistan exhibits patrilineal elements from the Neolithic revolution dispersal across Central Asia. The observed haplogroup distribution suggests some degree of genetic isolation of the northern population, likely because of the Hindu Kush Mountain range acting as a barrier and separating them from the southern Afghans who have greater contact with neighboring Pakistan and migrants from the Indian subcontinent and Central Asia. Our study demonstrates genetic similarity among Pathans from Afghanistan and Pathans from Pakistan, supported by a significant number of individuals belonging to haplogroup R1a1a-M198 and sharing the same modal haplotype. Genetic signatures of South Central Asian populations are evident in their patrilineages and may represent gene flow associated with the Silk Road migrations. In addition, the high frequencies of R1a1a-M198 chromosomes and the sharing of seven Y-STR loci haplotypes among Pathans, Ashkenazi Jews and west Russians may represent vestiges from the Khazars of Central Asia that converted to Judaism at the end of the Eighth century C.E., connecting Pathans with certain Ashkenazi Jews by the way of a common Khazar ancestry.
References
Dupree L, Lawrence JA, Brill RH et al: Prehistoric research in Afghanistan (1959–1966). Trans Am Philos Soc 1972; 62: 1–84.
Katzir I : The Israeli source of the Pathan tribes. The Scribe 2001; 74: 53–54.
Runion ML : The history of Afghanistan. Connecticut Greenwood Press, 2007.
Caroe OP : The Pathans 550 BC-AD 1957. Oxford Oxford University Press, 1976.
Mohyuddin A, Ayub Q, Qamar R et al: Y-chromosomal STR haplotypes in Pakistani populations. Forensic Sci Int 2001; 118: 141–146.
Qamar R, Ayub Q, Mohyuddin A et al: Y-chromosomal DNA variation in Pakistan. Am J Hum Genet 2002; 70: 1107–1124.
Mansoor A, Mazhar K, Khaliq S et al: Investigation of the Greek ancestry of populations from northern Pakistan. Hum Genet 2004; 114: 484–490.
Sengupta S, Zhivotovsky LA, King R et al: Polarity and temporality of high-resolution Y-chromosome distributions in India identify both indigenous and exogenous expansions and reveals minor genetic influence of Central Asian pastoralists. Am J Hum Genet 2006; 78: 202–221.
Firasat S, Khaliq S, Mohyuddin A et al: Y-chromosomal evidence for a limited Greek contribution to the Pathan population of Pakistan. Eur J Hum Genet 2007; 15: 121–126.
Di Cristofaro J, Buhler S, Temori SA, Chiaroni J : Genetic data of 15 STR loci in five populations from Afghanistan. Forensic Sci Int Genet 2012; 6: e44–e45.
Noor S, Ali S, Eaaswarkhanth M, Haque I : Allele frequency distribution for 15 autosomal STR loci in Afridi Pathan population of Uttar Pradesh, India. Leg Med 2009; 11: 308–311.
Antunez-de-Mayolo G, Antunez-de-Mayolo A, Antunez-de-Mayolo P et al: Phylogenetics of worldwide human populations as determined by polymorphic Alu insertions. Electrophoresis 2002; 23: 3346–3356.
Sambrook J, Russell DW : Molecular cloning: A Laboratory Manual. New York Cold Spring Harbor Laboratory Press, 2001.
Gayden T, Regueiro M, Martinez L, Cadenas AM, Herrera RJ : Human Y-chromosome haplotyping by allele-specific polymerase chain reaction. Electrophoresis 2008; 29: 2419–2423.
Karafet TM, Mendez FL, Meilerman MB, Underhill PA, Zegura SL, Hammer MF : New binary polymorphisms reshape and increase resolution of the human Y chromosomal haplogroup tree. Genome Res 2008; 18: 830–838.
Underhill PA, Myres NM, Rootsi S et al: Separating the post-Glacial coancestry of European and Asian Y chromosomes within haplogroup R1a. Eur J Hum Genet 2010; 18: 479–484.
Myres NM, Rootsi S, Lin AA et al: A major Y-chromosome haplogroup R1b Holocene era founder effect in Central and Western Europe. Eur J Hum Genet 2011; 19: 95–101.
Lacau H, Bukhari A, Gayden T et al: Y-STR profiling in two Afghanistan populations. Leg Med 2011; 13: 103–108.
Battaglia V, Fornarino S, Al-Zahery N et al: Y-chromosomal evidence of the cultural diffusion of agriculture in Southeast Europe. Eur J Hum Genet 2009; 17: 820–830.
Martinez L, Underhill PA, Zhivotovsky LA et al: Paleolithic Y-haplogroup heritage predominates in a Cretan highland plateau. Eur J Hum Genet 2007; 15: 485–493.
Regueiro M, Cadenas AM, Gayden T, Underhill PA, Herrera RJ : Iran: tricontinental nexus for Y-chromosome driven migration. Hum Hered 2006; 61: 132–143.
Behar DM, Garrigan D, Kaplan ME et al: Contrasting patterns of Y chromosome variation in Ashkenazi Jewish and host non-Jewish European populations. Hum Genet 2004; 114: 354–365.
Rohlf F : NTSYSpc. Setauket, NY Exter Publishing, 2002.
Felsenstein J : PHYLIP-phylogeny inference package (version 3.2). Cladistics 1989; 5: 164–166.
Excoffier L, Laval G, Schneider S : Arlequin ver 3.0: an integrated software package for population genetics data analysis. Evol Bioinform Online 2005; 1: 47–50.
Slatkin M : A measure of population subdivision based on microsatellite allele frequencies. Genetics 1995; 139: 457–462.
Goodman SJ : Rst Calc: a collection of computer programs for calculating estimates of genetic differentiation from microsatellite data and determining their significance. Mol Ecol 1997; 6: 881–885.
Bandelt HJ, Forster P, Röhl A : Median-joining networks for inferring intraspecific phylogenies. Mol Biol Evol 1999; 16: 37–48.
Zhivotovsky LA, Underhill PA, Cinnioğlu C et al: The effective mutation rate at Y chromosome short tandem repeats, with application to human population divergence time. Am J Hum Genet 2004; 74: 50–61.
Goedbloed M, Vermeulen M, Fang RN et al: Comprehensive mutation analysis of 17 Y-chromosomal short tandem repeat polymorphisms included in the AmpFlSTR Yfiler PCR amplification kit. Int J Legal Med 2009; 123: 471–482.
Kayser M, Krawczak M, Excoffier L et al: An extensive analysis of Y-chromosomal microsatellite haplotypes in globally dispersed human populations. Am J Hum Genet 2001; 68: 990–1018.
Klyosov A : DNA genealogy, mutation rates, and some historical evidence written in the Y-chromosome part II: walking the map. J Genet Genealogy 2009; 5: 217–256.
Wells RS, Yuldasheva N, Ruzibakiev R et al: The Eurasian heartland: a continental perspective on Y-chromosomal diversity. Proc Natl Acad Sci USA 2001; 98: 10244–10249.
Semino O, Passarino G, Oefner PJ et al: The genetic legacy of Paleolithic Homo sapiens sapiens in extant Europeans: a Y-chromosome perspective. Science 2000; 290: 1155–1159.
Mirabal S, Regueiro M, Cadenas AM et al: Y-chromosome distribution within the geo-linguistic landscape of northwestern Russia. Eur J Hum Genet 2009; 17: 1260–1273.
Klyosov A : DNA genealogy, mutation rates, and some historical evidence written in the Y-chromosome part I: basic principles and the method. J Genet Genealogy 2009; 5: 186–216.
Wells RS : Deep ancestry: inside the genography project. The landmark DNA quest to decipher our distant past. National Geographics 2007, p. 103.
Shen P, Lavi T, Kivisild T et al: Reconstruction of patrilineages and matrilineages of Samaritans and other Israeli populations from Y-Chromosome and mitochondrial DNA sequence Variation. Hum Mutat 2004; 24: 248–260.
King RJ, DiCristofaro J, Kouvatsi A et al: The coming of the Greeks to provence and corsica: Y-chromosome models of archaic Greek colonization of the western Mediterranean. BMC Evol Biol 2011; 11: 69.
Behar DM, Thomas MG, Skorecki K et al: Multiple origins of Ashkenazi Levites: Y chromosome evidence for both Near Eastern and European ancestries. Am J Hum Genet 2003; 73: 768–779.
Nebel A, Filon D, Faerman M, Soodyall H, Oppenheim A : Y chromosome evidence for a founder effect in Ashkenazi Jews. Eur J Hum Genet 2005; 13: 388–391.
Hammer MF, Behar DM, Karafet TM et al: Extended Y chromosome haplotypes resolve multiple and unique lineages of the Jewish priesthood. Hum Genet 2009; 126: 707–717.
Gayden T, Cadenas AM, Regueiro M et al: The Himalayas as a directional barrier to gene flow. Am J Hum Genet 2007; 80: 884–894.
Nasidze I, Sarkisian T, Kerimov A, Toneking M : Testing hypotheses of language replacement in the Caucasus: evidence from the Y chromosome. Hum Genet 2003; 112: 255–261.
Cinnioğlu C, King R, Kivisild T et al: Excavating Y-chromosome haplotype strata in Anatolia. Hum Genet 2004; 114: 127–148.
Derenko M, Malyarhuk B, Denisova GA et al: Contrasting patterns of Y-chromosome variation in South Siberian populations from Baikal and Altai-Sayan regions. Hum Genet 2006; 118: 591–604.
Fechner A, Quinque D, Rychkov S et al: Boundaries and clines in the West Eurasian Y-chromosome landscape: insights from the European part of Russia. Am J Phys Anthropol 2008; 137: 41–47.
Abu-Amero KK, Hellani A, González AM, Larruga JM, Cabrera VM, Underhill PA : Saudi Arabian Y-Chromosome diversity and its relationship with nearby regions. BMC Genet 2009; 10: 59.
Zalloua PA, Xue Y, Khalife J et al: Y-chromosomal diversity in Lebanon is structured by recent historical events. Am J Hum Genet 2008; 82: 873–882.
Luis JR, Rowold DJ, Regueiro M et al: The Levant versus the Horn of Africa: evidence for bidirectional corridors of human migrations. Am J Hum Genet 2004; 74: 532–544.
Cadenas AM, Zhivotovsky LA, Cavalli-Sforza LL, Underhill PA, Herrera RJ : Y-chromosome diversity characterizes the Gulf of Oman. Eur J Hum Genet 2008; 16: 374–386.
Acknowledgements
The authors express their appreciation to the original DNA donors who made this study possible. We gratefully acknowledge Viviana Arce, Priscilla Torres, David Perez and Silvia Calderon for their contribution to the manuscript and we thank Tanya Simms for her valuable comments.
Author information
Authors and Affiliations
Corresponding author
Ethics declarations
Competing interests
The authors declare no conflict of interest.
Additional information
Supplementary Information accompanies the paper on European Journal of Human Genetics website
Supplementary information
Rights and permissions
About this article
Cite this article
Lacau, H., Gayden, T., Regueiro, M. et al. Afghanistan from a Y-chromosome perspective. Eur J Hum Genet 20, 1063–1070 (2012). https://doi.org/10.1038/ejhg.2012.59
Received:
Revised:
Accepted:
Published:
Issue Date:
DOI: https://doi.org/10.1038/ejhg.2012.59
Keywords
This article is cited by
-
Contrasting maternal and paternal genetic histories among five ethnic groups from Khyber Pakhtunkhwa, Pakistan
Scientific Reports (2022)
-
Mitochondrial DNA diversity in the Khattak and Kheshgi of the Peshawar Valley, Pakistan
Genetica (2020)
-
Afghanistan: conduits of human migrations identified using AmpFlSTR markers
International Journal of Legal Medicine (2019)
-
Dispersals of the Siberian Y-chromosome haplogroup Q in Eurasia
Molecular Genetics and Genomics (2018)
-
Phylogeography of human Y-chromosome haplogroup Q3-L275 from an academic/citizen science collaboration
BMC Evolutionary Biology (2017)
