
Abstract
Although human Y chromosomes belonging to haplogroup R1b are quite rare in Africa, being found mainly in Asia and Europe, a group of chromosomes within the paragroup R-P25* are found concentrated in the central-western part of the African continent, where they can be detected at frequencies as high as 95%. Phylogenetic evidence and coalescence time estimates suggest that R-P25* chromosomes (or their phylogenetic ancestor) may have been carried to Africa by an Asia-to-Africa back migration in prehistoric times. Here, we describe six new mutations that define the relationships among the African R-P25* Y chromosomes and between these African chromosomes and earlier reported R-P25 Eurasian sub-lineages. The incorporation of these new mutations into a phylogeny of the R1b haplogroup led to the identification of a new clade (R1b1a or R-V88) encompassing all the African R-P25* and about half of the few European/west Asian R-P25* chromosomes. A worldwide phylogeographic analysis of the R1b haplogroup provided strong support to the Asia-to-Africa back-migration hypothesis. The analysis of the distribution of the R-V88 haplogroup in >1800 males from 69 African populations revealed a striking genetic contiguity between the Chadic-speaking peoples from the central Sahel and several other Afroasiatic-speaking groups from North Africa. The R-V88 coalescence time was estimated at 9200–5600 kya, in the early mid Holocene. We suggest that R-V88 is a paternal genetic record of the proposed mid-Holocene migration of proto-Chadic Afroasiatic speakers through the Central Sahara into the Lake Chad Basin, and geomorphological evidence is consistent with this view.
Introduction
The Sahara, covering about one third of the African continent from the Atlantic Ocean to the Red Sea, is the earth's most extensive desert. Over the past thousands of years, the Sahara has undergone dramatic climatic oscillations including arid phases, during which it was largely uninhabitable, and humid episodes, which transformed the desert into a fertile landscape.1 After a hyper-arid period about 23–14.5 kya, the Saharan region experienced a monsoonal moist climate, characterized by increased rainfall.2, 3 During the Holocene Climatic Optimum (about 10–5 kya), a few thousand years after the beginning of the humid period, flora and fauna repopulated the desert, and a mosaic of savannah and woodland became well established throughout much of the Sahara.3 At the same time, the Sahara was home to giant lakes,4 the largest of which, the paleolake Megachad, may have possibly covered an area of at least 400 000 km2, more than the Caspian Sea, the biggest lake on earth today.5 This greening scenario was interrupted by a number of arid episodes, and at about 5–6 kya, the region experienced a rapid onset of dryer conditions. These marked the beginning of a shift towards permanent aridity, with variations in the distribution and timing of these changes between the eastern and central/western Sahara.3 Human–environment interactions in the Sahara have been greatly influenced by these climate fluctuations.1
Close links between climatic variations and prehistoric human occupation of the Sahara during the early mid Holocene (10–5 kya) are documented by archeological6, 7, 8 and paleoanthropological9, 10 evidence. However, genetic studies have been limited and mainly focused on uniparental markers and the role of the Nile basin as a corridor for human movements between northeastern and eastern Africa.11, 12, 13, 14
There have only been a few high-resolution analyses to date regarding the distribution of Y-specific haplogroups in the African continent. The emerging picture indicates a clear differentiation between central/western sub-Saharan and northern African populations. Haplogroup E-DYS271, which accounts for >70% of the Y chromosomes in most of the populations south of the Sahara, is found on an average at a frequency of 2–3% in Northern Africa, whereas haplogroups J-M304, E-M81, and E-M78, which on the whole account for 50–90% of the northern African male-specific region of the Y chromosome (MSY) gene pool, have been only rarely observed in west/central sub-Saharan Africa.12, 13, 14, 15, 16, 17, 18, 19, 20, 21, 22, 23, 24, 25
A group of chromosomes of potential interest to past trans-Saharan connections is the paragroup R1b1* (R-P25*). Cruciani et al18 found this paragroup (at that time defined as haplogroup 117, or R-M173*(xSRY10831, M18, M73, M269)) to be present at high frequencies (up to 95%) in populations from northern Cameroon. The same paragroup was only rarely observed in other sub-Saharan African regions, and not observed at all in western Eurasia.18 Subsequent studies dealing with the MSY diversity in Africa have confirmed the presence of R-P25*(xM269) in northern Cameroon at high frequencies23 and, at lower frequencies (mean 5%, range 0–20%), of R-P25* immediately south of Cameroon, in several populations from Gabon.25 Interestingly, chromosomes of haplogroup R-P25/R-M173, ancestral for M269 as well as for other ‘Eurasian’ downstream markers, have been found to be present in northern Africa (1% in Algeria, 4% in Tunisia, and 2–4% in Egypt).20, 23, 26 The presence of R-P25 Y chromosomes has also been reported in population groups from the Sudan;27 however, as no internal markers were typed, the sub-haplogroup affiliation of these chromosomes remains undefined.
To shed some light on the past demographic processes that determined the present distribution of R-P25* in Africa, we searched for new MSY mutations refining the phylogeny of haplogroup R1b, and surveyed a wide range of African populations (>1800 males from 69 populations) for the presence of the R1b haplogroup. More than 3500 subjects from Europe and Asia were also analyzed for the same haplogroup to obtain a better insight into the Asia-to-Africa back migration associated with this haplogroup.
Materials and methods
Subjects
In all, 5326 Y chromosomes from Africa and Eurasia (Table 1) were analyzed for the haplogroup R1b internal markers (Ref. 18 and this study). For all subjects, an appropriate informed consent was obtained. Four R1b subjects (two Africans R-P25* and two Europeans of haplogroup R-M269 and R-P25*) were selected to identify new mutations. Samples were obtained from peripheral blood, cultured cells, hair roots, or buccal swabs, and DNA was extracted using appropriate procedures (either phenol–chloroform extraction followed by ethanol precipitation or purification by QIAamp kit from Qiagen, Milan, Italy).
Molecular analysis
We resequenced about 0.15 Mb of the MSY for each of the four R1b subjects. PCR primers were designed on the basis of the MSY sequence reported in Genome Browser web site (February 2009 assembly of the human genome; http://genome.ucsc.edu/) using Primer3 software (http://frodo.wi.mit.edu/cgi-bin/primer3/primer3_www.cgi). Sequencing templates were obtained through PCR in a 50 μl reaction containing 50 ng of genomic DNA, 200 μ M of each dNTP, 2.5 mM MgCl2, 1 unit of Taq polymerase, and 10 pmoles of each primer. A touchdown PCR program was used with an annealing temperature decreasing from 63 to 56 °C over 14 cycles, followed by 30 cycles with an annealing temperature of 56 °C. After DNA amplification, PCR products were purified using the QIAquick PCR purification kit (Qiagen, Hilden, Germany). Cycle sequencing was performed using the BigDye Terminator Cycle Sequencing Kit with Amplitaq DNA polymerase (Applied Biosystems, Foster City, CA, USA) and an internal or PCR primer. Cycle sequencing products were purified by ethanol precipitation and run on an ABI Prism 3730XL DNA sequencer (Applied Biosystems). Chromatograms were aligned and analyzed for mutations using Sequencher 4.8 (Gene Codes Corporation, Ann Arbor, MI, USA). Six new mutations were identified (see Supplementary Table 1 for details).
All the 5326 samples were analyzed for M343,28 with the exception of the Asian samples from CEPH/HGDP.29 A total of 997 chromosomes belonging to the R1b (R-M343) haplogroup were identified and further genotyped for 11 markers defining internal nodes (Figure 1). Typing methods for six of these markers (P25, P297, M335, M18, M73, and M269) were described earlier.18, 28, 30, 31, 32, 33 The marker P25, which has been shown to be liable to back mutation by gene conversion,34 was analyzed in the Asian samples from CEPH and in the R1b (R-M343) chromosomes lacking any other internal mutation.
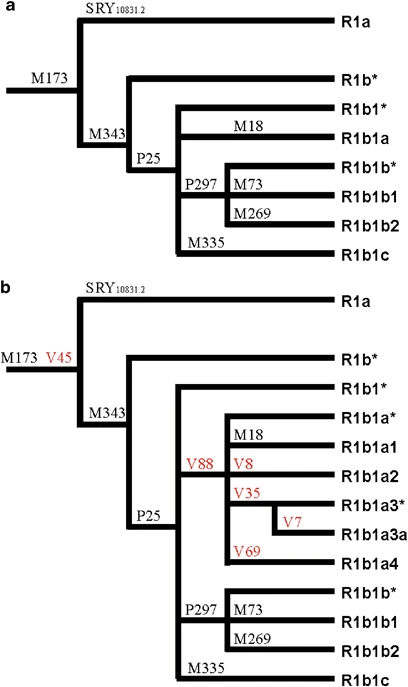
An updated phylogeny of the haplogroup R1b (R-M343). (a) Haplogroup R1b phylogeny as reported in Karafet et al.31 Twelve mutations internal to haplogroup R-M269 are not shown, as they are not relevant in this context. (b) Updated R1b phylogeny with the new mutations V7, V8, V35, V45, V69, and V88. As in Karafet et al,31 the phylogenetic position of the marker M335 within R1b is not definitively assigned, because of the absence of positive control DNAs.
To evaluate the phylogenetic relationships between the non-consensus allele 13.2 at the locus B of the microsatellite DYS38535 and other R1b markers, DYS385B was analyzed by sequencing35 in 106 R1b Y chromosomes (4 R-P25*, 57 R-V88*, 41 R-V69, and one for each of R-M18, R-M269, R-V7, and R-V8).
The internal diversity of the haplogroup R1b and its subhaplogroups was evaluated through the analysis of 210 Y chromosomes for four polymorphic dinucleotide repeats (YCAII and DYS413 duplicated loci) and seven tetranucleotide repeats (DYS19, DYS391, DYS393, DYS439, DYS460 (formerly A7.1), DYS461 (formerly A7.2), and GATA A10), as reported earlier.12
Data analysis
We obtained coalescence time estimates by using the variation associated with seven tetranucleotide microsatellites and the ASD method,36 in which the ancestral haplotype was assumed to be the haplotype carrying the most frequent allele at each microsatellite locus. Owing to the uncertainties associated with the estimate of the evolutionary effective microsatellite mutation rates, depending on the haplogroup demographic history,37 we considered two different population models: (1) a constant size population and (2) a single rate of m=0.01 for exponential population growth. After calibration for the specific microsatellites used in this study,13 we found evolutionary effective mutation rates of 7.9 × 10⁻⁴ and 1.3 × 10⁻³, respectively. Estimates for R-M343/P25, R-V88, and R-V69 were obtained from 210, 98, and 26 Y chromosomes, respectively.
Phylogenetic relationships among 11-microsatellite haplotypes (Supplementary Table 2) were obtained by sequentially performing reduced-median and median-joining procedures38, 39 through the use of the network 4.1 program (Fluxus-engineering.com, http://www.fluxus-engineering.com/sharenet.htm). To reduce reticulations in the network, microsatellites were weighted proportionally to the inverse of the repeat variance observed in each haplogroup.
Frequency map was depicted on a grid of 47 × 52 lines using the Kriging procedure40 through the use of the program Surfer 6.0 (Golden Software, Inc., Golden, CO, USA).
The Mann–Whitney U-test was performed using the Simple Interactive Statistical Analysis web tool (http://www.quantitativeskills.com/sisa/).
Results and discussion
We resequenced about 0.15 Mb of the MSY for each of the four R1b subjects and found six new mutations (V7, V8, V35, V45, V69, and V88). The V45 mutation is phylogenetically equivalent to M173. Among the other five mutations, V88 defines a new monophyletic clade (R-V88 or R1b1a), which includes haplogroups R-M18 (R1b1a1, formerly R1b1a), R-V8 (R1b1a2), R-V35 (R1b1a3, further subdivided by the V7 mutation to R1b1a3* and R1b1a3a), and R-V69 (R1b1a4) (Figure 1).
The microsatellite intermediate variant allele 13.2 at the DYS385 locus B, which has been reported to delineate a new phylogenetic substructure within the human Y chromosome paragroup R1b*,25, 35 was not observed in any of the 106 R1b Y chromosomes analyzed here. Therefore, the phylogenetic relationships between this marker and the new mutations reported here remain to be defined.
In total, 997 chromosomes belonging to the haplogroup R1b were found. The paragroup R-M343*, earlier reported in a single subject from Turkey,28 was not observed. The overall scenario was characterized by a strong inter-continental differentiation (Table 1). All the African R1b chromosomes, with the exception of one eastern- and a few northern-African R-M269 chromosomes, turned out to belong to the haplogroup R-V88. About one third of the African R-V88 chromosomes carried mutation V69, which was not observed outside Africa. The large majority of R1b chromosomes from western Eurasia carried, as expected, the M269 mutation; only five R-V88 chromosomes were observed, three of which carried distinctive mutations (M18, V35, and V7). The rare R1b chromosomes observed in Asia were either R-M73 or R-M269. The R-P25* paragroup was only found in five subjects from Europe (3), western Asia (1), and eastern Asia (1) (Table 1).
According to the phylogeography of macro-haplogroup K-M9 (which contains haplogroup R1b), an ancient Asia-to-Africa back migration has been hypothesized to explain the puzzling presence of R-P25* in sub-Saharan Africa.18 This hypothesis is strongly supported by the present data. In the revised Y chromosome phylogeny, there are 119 lineages in the macro-haplogroup K-M9 (which includes haplogroups K1-K4 and L to T).31 Of these lineages, only two have been observed in sub-Saharan Africa at appreciable frequencies: T-M7018, 41, 42 and R-V88 (this study). Both haplogroups have also been observed in Europe and western Asia (Refs 42,43 and this study). If the presence of R1b chromosomes in Africa was not because of a back migration, we would have to assume that all the mutations that connect M9 with V88 in the MSY phylogeny (>50 mutations) originated in Africa. Under this scenario, we should assume that all the K-M9 lineages that are now found outside sub-Saharan Africa have survived extinction, whereas those which should have accumulated in Africa are now extinct (with the exception of T-M70 and R-V88) and this is an unlikely scenario. We obtained the time estimate of the Asia-to-Africa back migration by using the variation associated with seven tetranucleotide microsatellites (Supplementary Table 2) and the ASD method.36 As an upper limit, we used the coalescence time of the R-M343/P25 haplogroup (12.9 ky, 95% CI=11.6–14.3 ky, under a conservative scenario of constant population size), which, on the basis of the accumulated nucleotide and microsatellite diversity (Table 1; Figure 2), most likely originated outside Africa. The coalescence time of the seemingly African-specific haplogroup R-V69 (6.0 ky, 95% CI=4.2–8.2 ky, under the hypothesis of an expanding population) was used as a lower limit.
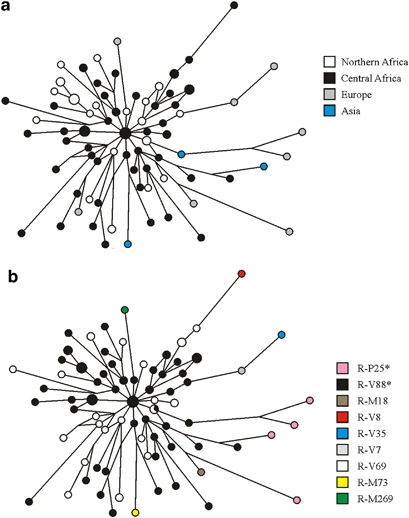
Eleven-microsatellite network of R1b chromosomes from Eurasia and Africa. Microsatellite haplotypes are represented by circles filled with colors corresponding to geographic regions (a) and binary haplogroups/paragroups (b). Only the modal microsatellite haplotypes for haplogroups R-M73 (based on 9 chromosomes) and R-M269 (based on 95 chromosomes) are shown.
Within Africa, the highest frequencies of the R-V88 haplogroup (and its commonest sub-clade, R-V69) were observed in the central Sahel (northern Cameroon, northern Nigeria, Chad, and Niger) (Table 1; Figure 3). Immediately south of this region (southern Cameroon and southern Nigeria), frequencies drastically dropped to 0.0–4.8%. The central Sahel is characterized by a strong linguistic fragmentation with populations speaking languages belonging to three of the four linguistic families of Africa (Afroasiatic, Niger-Congo, and Nilo-Saharan). When the linguistic affiliation of the populations from the central Sahel was also taken into account, a clear-cut divide was observed between those speaking Afroasiatic languages (including the Berber-speaking Tuareg, the Semitic Arab Shuwa, and Chadic-speaking populations from northern Cameroon) and the other populations (Mann–Whitney test P=1.4 × 10⁻³), with Chadic-speaking populations mostly contributing to this difference. It is worth noting that, if the finding of 20% R-V88 chromosomes among the Hausa (Table 1) is representative, this population, encompassing by far more people than all other Chadic speakers,44 also encompasses the highest absolute number of V88 carriers.
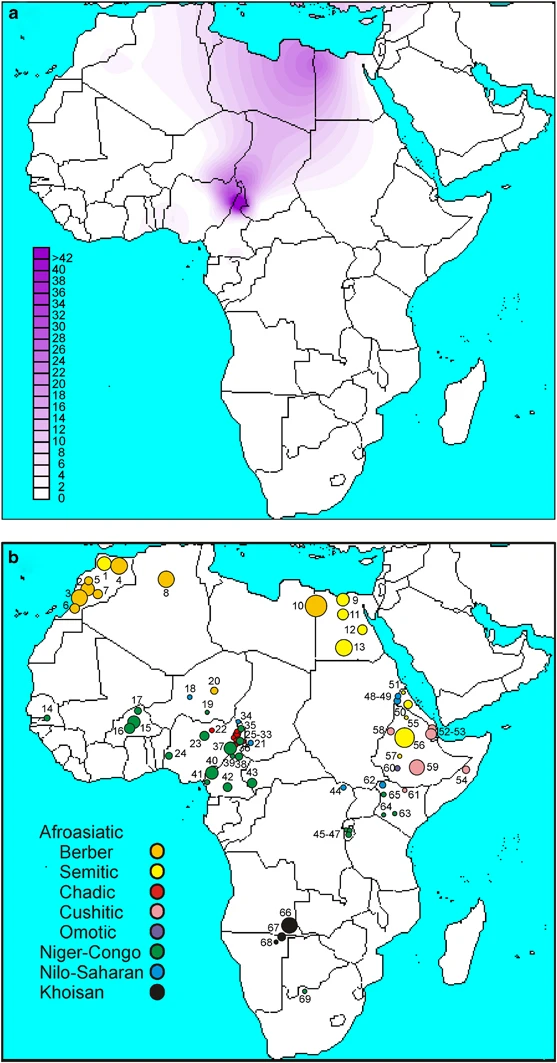
A schematic representation of the African continent. (a) Contour map of haplogroup R-V88. (b) Location and linguistic affiliation of the sampled populations. Numbers refer to populations in Table 1. Linguistic affiliations of the populations are indicated by different colors (to the left).
In contrast to prior studies on nuclear (mostly autosomal) ins/del and microsatellite markers,45 the Chadic are distinguished from the Nilo-Saharan-speaking populations at the Y chromosome variation level (Table 1; Supplementary Table 3). Repeated assimilations of Nilo-Saharan females over generations may account for these conflicting signals. Among the Niger-Congo-speaking populations, the frequency of the haplogroup R-V88 ranged between 0.0 and 66.7%. Outside central Africa, haplogroup R-V88 was only observed in Afroasiatic-speaking populations from northern Africa, with frequencies ranging from 0.3% in Morocco, to 3.0% in Algeria, and to 11.5% in Egypt, where a particularly high frequency (26.9%) was observed among the Berbers from the Siwa Oasis. Although the presence of the haplogroup R-V88 at non-negligible frequencies in some Niger-Congo-speaking populations from the central Sahel can be accounted for by Chadic admixture favored by geographic contiguity, the presence of this haplogroup both in northern Africa and the central Sahel is especially intriguing given that >1500 km across the Sahara separate the two regions. The expansion time for the haplogroup R-V88 in Africa, under two different population models (see Materials and methods), was found to be 9.2–5.6 ky (95% CI=7.6–10.8 ky and 4.7–6.6 ky, respectively).
Diverse hypotheses have been proposed to explain the process by which proto-Chadic speakers arrived to the Lake Chad region. Ehret46 has put forward a model for Afroasiatic languages with a primary division between the Omotic languages of Ethiopia and an Erythraean subgroup. This, in turn, has been subdivided into Cushitic and North Erythraean, the latter including Berber, Semitic, Ancient Egyptian, and Chadic. In his opinion, around 7000 kya proto-Chadic Afroasiatic speakers may have moved west through the Central Sahara and then farther south into the Lake Chad Basin.47 Blench,48 in turn, suggested that speakers of proto-Cushitic–Chadic language migrated east-to-west from the Middle Nile to the Lake Chad, and recent mtDNA data support this view.49 However, in contrast to the mtDNA, a strong connection between Chadic and other Afroasiatic populations from Northern Africa is revealed by the Y chromosome data. This finding would indicate the trans-Saharan47 a more likely scenario than the inter-Saharan hypothesis,48 at least as far as the male component of gene pool is concerned. In this view, it is tempting to speculate that the Y chromosome haplogroup R-V88 represents a preserved genetic record of gene flow along the same axis as the proposed spread of proto-Chadic languages.47 Indeed, geomorphological evidence4 from the paleolakes that existed in the Sahara during the mid-Holocene indicates that these lakes could have covered an area as large as about 10% of the Sahara, providing an important corridor for human migrations across the region.5
In summary, our data indicate a significant male contribution from northern Africa (and ultimately Asia) to the gene pool of the central Sahel. The trans-Saharan population movements resulting in this genetic pattern would seem to mirror the spread of the proto-Chadic languages, and most likely took place during the early mid Holocene, a period when giant paleolakes may have provided a corridor for human migrations across what is now the Sahara desert.
References
Brooks N, Chiapello I, Di Lernia S et al: The climate-environment-society nexus in the Sahara from prehistoric times to the present day. J North Afr Stud 2005; 10: 253–292.
Talbot MR : Late Pleistocene rainfall and dune building in the Sahel. Palaeoecol Afr 1983; 16: 203–213.
Burroughs WJ : Climate Change in Prehistory. The End of the Reign of Chaos. Cambridge University Press: Cambridge, 2005.
Damnati B : Holocene lake records in the northern hemisphere of Africa. J Afr Earth Sci 2000; 31: 253–262.
Drake N, Bristow C : Shorelines in the Sahara: geomorphological evidence for an enhanced monsoon from palaeolake Megachad. Holocene 2006; 16: 901–911.
Breunig P, Neumann K, Van Neer W : New research on the Holocene settlement and environment of the Chad Basin in Nigeria. Afr Archaeol Rev 1996; 13: 111–145.
Huysecom E, Ozainne S, Raeli F, Ballouche A, Rasse M, Stokes S : Ounjougou (Mali): a history of Holocene settlement at the southern edge of the Sahara. Antiquity 2004; 78: 579–593.
Kuper R, Kröpelin S : Climate-controlled Holocene occupation in the Sahara: motor of Africa's evolution. Science 2006; 313: 803–807.
Tafuri MA, Bentley RA, Manzi G, Di Lernia S : Mobility and kinship in the prehistoric Sahara: strontium isotope analysis of Holocene human skeletons from the Acacus Mts. (southwestern Libya). J Anthropol Archaeol 2006; 25: 390–402.
Sereno PC, Garcea EAA, Jousse H et al: Lakeside cemeteries in the Sahara: 5000 years of Holocene population and environmental change. PLoS One 2008; 3: e2995.
Krings M, Salem AH, Bauer K et al: mtDNA analysis of Nile River Valley populations: a genetic corridor or a barrier to migration? Am J Hum Genet 1999; 64: 1166–1176.
Cruciani F, La Fratta R, Santolamazza P et al: Phylogeographic analysis of haplogroup E3b (E-M215) Y chromosomes reveals multiple migratory events within and out of Africa. Am J Hum Genet 2004; 74: 1014–1022.
Cruciani F, La Fratta R, Trombetta B et al: Tracing past human male movements in northern/eastern Africa and western Eurasia: new clues from Y-chromosomal haplogroups E-M78 and J-M12. Mol Biol Evol 2007; 24: 1300–1311.
Tofanelli S, Ferri G, Bulayeva K et al: J1-M267 Y lineage marks climate-driven pre-historical human displacements. Eur J Hum Genet 2009; 17: 1520–1524.
Scozzari R, Cruciani F, Santolamazza P et al: Combined use of biallelic and microsatellite Y-chromosome polymorphisms to infer affinities among African populations. Am J Hum Genet 1999; 65: 829–846.
Underhill PA, Shen P, Lin AA et al: Y chromosome sequence variation and the history of human populations. Nat Genet 2000; 26: 358–361.
Bosch E, Calafell F, Comas D, Oefner PJ, Underhill PA, Bertranpetit J : High-resolution analysis of human Y-chromosome variation shows a sharp discontinuity and limited gene flow between northwestern Africa and the Iberian Peninsula. Am J Hum Genet 2001; 68: 1019–1029.
Cruciani F, Santolamazza P, Shen P et al: A back migration from Asia to sub-Saharan Africa is supported by high-resolution analysis of human Y-chromosome haplotypes. Am J Hum Genet 2002; 70: 1197–1214.
Arredi B, Poloni ES, Paracchini S et al: A predominantly neolithic origin for Y-chromosomal DNA variation in North Africa. Am J Hum Genet 2004; 75: 338–345.
Luis JR, Rowold DJ, Regueiro M et al: The Levant versus the Horn of Africa: evidence for bidirectional corridors of human migrations. Am J Hum Genet 2004; 74: 532–544.
Semino O, Magri C, Benuzzi G et al: Origin, diffusion, and differentiation of Y-chromosome haplogroups E and J: inferences on the neolithization of Europe and later migratory events in the Mediterranean area. Am J Hum Genet 2004; 74: 1023–1034.
Beleza S, Gusmão L, Amorim A, Carracedo A, Salas A : The genetic legacy of western Bantu migrations. Hum Genet 2005; 117: 366–375.
Wood ET, Stover DA, Ehret C et al: Contrasting patterns of Y chromosome and mtDNA variation in Africa: evidence for sex-biased demographic processes. Eur J Hum Genet 2005; 13: 867–876.
Rosa A, Ornelas C, Jobling MA, Brehm A, Villems R : Y-chromosomal diversity in the population of Guinea-Bissau: a multiethnic perspective. BMC Evol Biol 2007; 7: 124.
Berniell-Lee G, Calafell F, Bosch E et al: Genetic and demographic implications of the Bantu expansion: insights from human paternal lineages. Mol Biol Evol 2009; 26: 1581–1589.
Robino C, Crobu F, Di Gaetano C et al: Analysis of Y-chromosomal SNP haplogroups and STR haplotypes in an Algerian population sample. Int J Legal Med 2008; 122: 251–255.
Hassan HY, Underhill PA, Cavalli-Sforza LL, Ibrahim ME : Y-chromosome variation among Sudanese: restricted gene flow, concordance with language, geography, and history. Am J Phys Anthropol 2008; 137: 316–323.
Cinnioǧlu C, King R, Kivisild T et al: Excavating Y-chromosome haplotype strata in Anatolia. Hum Genet 2004; 114: 127–148.
Cann HM, de Toma C, Cazes L et al: A human genome diversity cell line panel. Science 2002; 296: 261–262.
Hammer MF, Karafet TM, Redd AJ et al: Hierarchical patterns of global human Y-chromosome diversity. Mol Biol Evol 2001; 18: 1189–1203.
Karafet TM, Mendez FL, Meilerman MB, Underhill PA, Zegura SL, Hammer MF : New binary polymorphisms reshape and increase resolution of the human Y chromosomal haplogroup tree. Genome Res 2008; 18: 830–838.
Underhill PA, Jin L, Lin AA et al: Detection of numerous Y chromosome biallelic polymorphisms by denaturing high-performance liquid chromatography. Genome Res 1997; 7: 996–1005.
Underhill PA, Passarino G, Lin AA et al: The phylogeography of Y chromosome binary haplotypes and the origins of modern human populations. Ann Hum Genet 2001; 65: 43–62.
Adams SM, King TE, Bosch E, Jobling MA : The case of the unreliable SNP: recurrent back-mutation of Y-chromosomal marker P25 through gene conversion. Forensic Sci Int 2006; 159: 14–20.
Myres NM, Ritchie KH, Lin AA, Hughes RH, Woodward SR, Underhill PA : Y-chromosome short tandem repeat intermediate variant alleles DYS392.2, DYS449.2, and DYS385.2 delineate new phylogenetic substructure in human Y-chromosome haplogroup tree. Croat Med J 2009; 50: 239–249.
Goldstein DB, Ruiz Linares A, Cavalli-Sforza LL, Feldman MW : Genetic absolute dating based on microsatellites and the origin of modern humans. Proc Natl Acad Sci USA 1995; 92: 6723–6727.
Zhivotovsky LA, Underhill PA, Feldman MW : Difference between evolutionarily effective and germ-line mutation rate due to stochastically varying haplogroup size. Mol Biol Evol 2006; 23: 2268–2270.
Bandelt H-J, Forster P, Sykes BC, Richards MB : Mitochondrial portraits of human populations using median networks. Genetics 1995; 141: 743–753.
Bandelt H-J, Forster P, Röhl A : Median-joining networks for inferring intraspecific phylogenies. Mol Biol Evol 1999; 16: 37–48.
Cressie NAC : Statistics for Spatial Data. John Wiley and Sons Inc: New York, 1991.
Semino O, Santachiara-Benerecetti AS, Falaschi F, Cavalli-Sforza LL, Underhill PA : Ethiopians and Khoisan share the deepest clades of the human Y-chromosome phylogeny. Am J Hum Genet 2002; 70: 265–268.
Sanchez JJ, Hallenberg C, Børsting C, Hernandez A, Morling N : High frequencies of Y chromosome lineages characterized by E3b1, DYS19-11, DYS392-12 in Somali males. Eur J Hum Genet 2005; 13: 856–866.
King TE, Bowden GR, Balaresque PL, Adams SM, Shanks ME, Jobling MA : Thomas Jefferson's Y chromosome belongs to a rare European lineage. Am J Phys Anthropol 2007; 132: 584–589.
Lewis MP (ed): Ethnologue: Languages of the World, 16th Edn. SIL International: Dallas Tex, 2009, Online version: http://www.ethnologue.com/.
Tishkoff SA, Reed FA, Friedlaender FR et al: The genetic structure and history of Africans and African Americans. Science 2009; 324: 1035–1044.
Ehret C : Reconstructing Proto-Afroasiatic (Proto-Afrasian). Vowels, Tone, Consonants, and Vocabulary. University of California Press: Berkeley, 1995.
Ehret C : The Civilizations of Africa: A History to 1800. James Currey: Oxford, 2002.
Blench R : The westward wandering of Cushitic pastoralists. Explorations in the prehistory of Central Africa. In: Baroin C, Boutrais J (eds) L’Homme et l’animal dans le bassin du lac Tchad. IRD Edn. Paris, 1999, pp 39–80.
Černý V, Fernandes V, Costa MD, Hájek M, Mulligan CJ, Pereira L : Migration of Chadic speaking pastoralists within Africa based on population structure of Chad Basin and phylogeography of mitochondrial L3f haplogroup. BMC Evol Biol 2009; 9: 63.
Acknowledgements
We are grateful to all the donors for providing DNA samples and to the people that contributed to the sample collection. In particular, we thank Laurent Varesi (for the Corsican samples), Farha El Chennawi, Anne Cambon-Thomsen, MS Issad, Eric Crubézy, Abdellatif Baali, Mohammed Cherkaoui, and Mohammed Melhaoui for their help in the collection of the Moroccan, Algerian, and Egyptian Berbers samples. This research received support from Grandi Progetti Ateneo, Università di Roma ‘La Sapienza,’ and the Italian Ministry of the University (Progetti di Ricerca di Interesse Nazionale 2007), both to RS. The sampling of the Berbers was made within the framework of the Inserm ‘Réseau Nord/Sud’ N°490NS1 (Mozabite Berbers), ‘The Origin of Man, Language and Languages’ (OMLL), EUROCORES Programme and benefited from funding by the Région Midi-Pyrénées (Toulouse, France), the CNRS (Centre National de la Recherche Scientifique), and the E.C. Sixth Framework Programme under Contract ERASCT-2003-980409.
Author information
Authors and Affiliations
Corresponding author
Ethics declarations
Competing interests
The authors declare no conflict of interest.
Additional information
Supplementary Information accompanies the paper on European Journal of Human Genetics website
Supplementary information
Rights and permissions
About this article
Cite this article
Cruciani, F., Trombetta, B., Sellitto, D. et al. Human Y chromosome haplogroup R-V88: a paternal genetic record of early mid Holocene trans-Saharan connections and the spread of Chadic languages. Eur J Hum Genet 18, 800–807 (2010). https://doi.org/10.1038/ejhg.2009.231
Received:
Revised:
Accepted:
Published:
Issue Date:
DOI: https://doi.org/10.1038/ejhg.2009.231
