
Figures, tables and video
From the following article
Peter J. Kahrilas and John E. Pandolfino
GI Motility online (2006)
doi:10.1038/gimo48
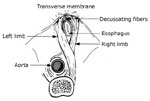
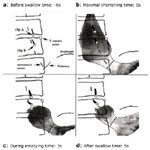
Figure 2
Demonstration of "physiologic herniation" during swallow using endoscopically placed mucosal clips.
Full size figure and legend (31K)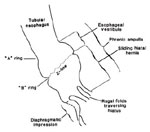
Figure 3
Anatomic features of a sliding hiatus hernia viewed radiographically during swallowing.
Full size figure and legend (16K)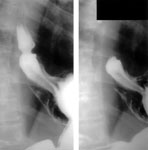
Figure 4
Radiograph of a patient with a small axial hiatal hernia (case 1).
Full size figure and legend (38K)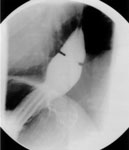
Figure 5
Radiograph of a patient with a small axial hiatal hernia (case 2).
Full size figure and legend (36K)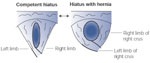
Figure 6
Alteration of the hiatal anatomy associated with sliding hiatal hernia.
Full size figure and legend (38K)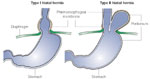
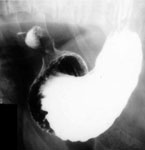
Figure 8
Type I hiatal hernia. In this example, the herniated gastric cardia is evident at rest, after completion of esophageal emptying.
Full size figure and legend (36K)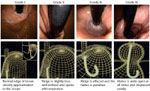
Figure 9
Three-dimensional representation of the progressive anatomic disruption of the EGJ as occurs with development of a type I hiatus hernia.
Full size figure and legend (164K)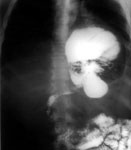
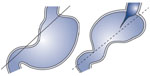
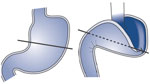

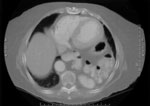
Figure 14
Computed tomography image through the chest showing a type IV paraesophageal hiatal hernia.
Full size figure and legend (46K)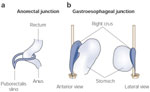
Figure 15
The "pinchcock" action of the pelvic and crural diaphragms on the alimentary canal as it enters and exits the abdominal cavity.
Full size figure and legend (40K)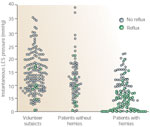
Figure 16
Success or failure of individual provocative maneuvers (coughing, leg lifting, abdominal compression, Valsalva) at eliciting gastroesophageal reflux as a function of lower esophageal sphincter (LES) pressure among groups of normal controls, patients without hiatus hernia and patients with radiographically defined hiatus hernia.
Full size figure and legend (80K)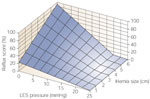
Figure 17
Model of the relationship among lower esophageal sphincter pressure (x axis), size of hernia (y axis), and the susceptibility to gastroesophageal reflux induced by provocative maneuvers that increase abdominal pressure as reflected by the reflux score (z axis).
Full size figure and legend (82K)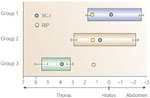
Figure 18
Esophagogastric junction high pressure zone relative to the diaphragmatic hiatus.
Full size figure and legend (39K)
Figure 19
Esophagogastric junction (EGJ) opening diameter during deglutitive relaxation.
Full size figure and legend (49K)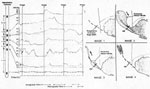
Figure 20
Concurrent manometric and videofluorographic recording of a 10-mL barium swallow in a subject with a reducing hiatal hernia characterized by late retrograde flow.
Full size figure and legend (97K)
Figure 21
Concurrent manometric and video recording of a 10-mL barium swallow characterized by early retrograde flow in a subject with a nonreducing hiatal hernia.
Full size figure and legend (74K)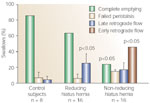
Figure 22
Esophageal emptying results among subject groups based on 10 test swallows.
Full size figure and legend (55K)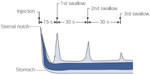
Figure 23
Graphic depiction of a radionuclide acid clearance study in a subject with a hiatus hernia.
Full size figure and legend (27K)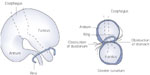
Figure 24
Obstruction and entrapment as a complication of type II paraesophageal hernia with an upside-down stomach.
Full size figure and legend (53K)