
Figure 21 - Concurrent manometric and video recording of a 10-mL barium swallow characterized by early retrograde flow in a subject with a nonreducing hiatal hernia.
From the following article
Peter J. Kahrilas and John E. Pandolfino
GI Motility online (2006)
doi:10.1038/gimo48
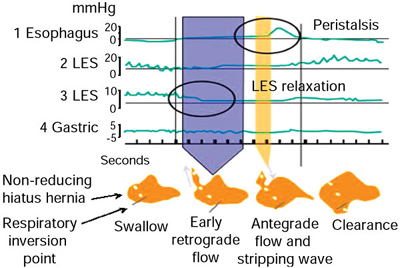
Tracings from the video images are below the manometric record and correspond to the times on the manometric tracings intersected by the vertical lines. The schematic diagram to the left depicts the relative spacing of the pressure sensors whose tracings are depicted. The arrows next to the video image indicate the direction of barium flow. The first video image to the far left shows a barium filled hiatal hernia at the time the swallow is initiated with sensor 1 in the distal esophagus, sensor 2 in the LES, sensor 3 within the hernia, sensor 4 measuring crural contractile activity, and sensor 5 within the abdominal stomach. The second image was about 1 second after the swallow and depicts the onset of retrograde flow; intrahernial pressure was 2 mmHg and LES pressure was 0 mmHg. Retrograde flow continued for 5 seconds until the peristaltic contraction reached the distal esophagus. The third image depicts antegrade flow with the stripping wave progressing down the esophagus and LES pressure increasing to equal intrahernia pressure ( 4 mmHg). The final image to the far right shows barium cleared from the esophagus with the LES pressure now exceeding intrahernial pressure. (Source: Sloan and Kahrilas,66 with permission from American Gastroenterological Association.)
Powerpoint slides for teaching
If the slide opens in your browser, Select "File > Save as" to save it.
Download Power Point slide (798K)