
Figures, tables and video
From the following article
Pathophysiology of gastroesophageal reflux disease
Nicholas E. Diamant
GI Motility online (2006)
doi:10.1038/gimo21
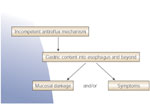
Figure 1
A simple overview of the pathogenesis of gastroesophageal reflux disease.
Full size figure and legend (38K)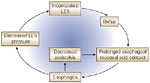
Figure 2
Gastroesophageal reflux disease initiates a vicious cycle of increasing esophageal acid exposure.
Full size figure and legend (18K)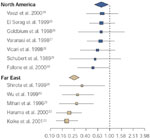
Figure 3
The odds ratio (95% confidence intervals) for prevalence of H. pylori in patients with esophagitis in North America24, 25, 26, 27, 28, 29, 30 and the Far East.19, 20, 21, 22, 23
Full size figure and legend (52K)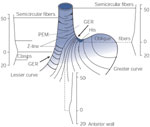
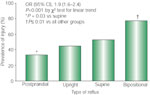
Figure 5
Body position and gastroesophageal reflux causing mucosal injury.
Full size figure and legend (42K)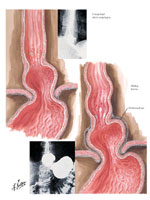
Figure 6
The phrenoesophageal ligament at the gastroesophageal junction in normal and hiatal hernia.
Full size figure and legend (153K)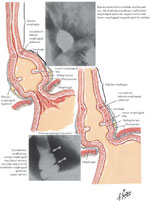
Figure 7
Attachment of phrenoesophageal ligand to lower esophageal sphincter.
Full size figure and legend (288K)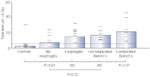
Figure 8
Duration (% time) of esophageal pH <4 in control subjects and patients with increasing severity of gastroesophageal reflux disease (GERD).
Full size figure and legend (35K)
Table 1
Factors important to the development of gastroesophageal reflux disease (GERD)
Full size table and legend