
Abstract
Percolation is a paradigmatic model in disordered systems and has been applied to various natural phenomena. The percolation transition is known as one of the most robust continuous transitions. However, recent extensive studies have revealed that a few models exhibit a discontinuous percolation transition (DPT) in cluster merging processes. Unlike the case of continuous transitions, understanding the nature of discontinuous phase transitions requires a detailed study of the system at hand, which has not been undertaken yet for DPTs. Here we examine the cluster size distribution immediately before an abrupt increase in the order parameter of DPT models and find that DPTs induced by cluster merging kinetics can be classified into two types. Moreover, the type of DPT can be determined by the key characteristic of whether the cluster kinetic rule is homogeneous with respect to the cluster sizes. We also establish the necessary conditions for each type of DPT, which can be used effectively when the discontinuity of the order parameter is ambiguous, as in the explosive percolation model.
Introduction
The percolation transition (PT)1, the emergence of a macroscopic-scale cluster at a finite threshold, has played a central role as a model for metal—insulator and sol—gel2 transitions in physical systems as well as the spread of disease epidemics3 and opinion formation in complex systems. The ordinary percolation model and many models based on it exhibit continuous transitions as a function of increasing occupation probability. Recently, however, a great interest in discontinuous percolation transitions (DPTs) has been sparked by the explosive percolation model4 and the cascading failure model in interdependent networks5,6 because of their potential applications to real-world phenomena such as large-scale blackouts in power grid systems and pandemics7. The explosive percolation model was an attempt to generate a DPT in cluster merging (CM) processes4,8,9,10,11,12,13,14, in which clusters are formed as links are added between two unconnected nodes following a given rule. However, recent extensive research15,16,17,18 shows that the explosive percolation transition in a random graph is continuous in the thermodynamic limit. This result has reinforced the robustness of continuous PTs in CM processes. Along with extensive studies on explosive percolation, a few models exhibiting DPTs in CM processes have been introduced. However, the patterns of DTP that they exhibit are not of the same type, which suggests that further studies are necessary for understanding the mechanism underlying such patterns. In this paper, we classify the patterns into two types and clarify the underlying mechanisms for each type of DPT.
We consider a CM dynamics with N nodes of size one at the beginning. At each time step, an edge is added between two nodes selected according to a given dynamic rule. Then, CM kinetics occurs when the two nodes were selected from different clusters. The number of edges added to the system at a certain time step divided by the system size N is defined as the time t, which serves as a control parameter in PTs. As time passes, the fraction of nodes belonging to the largest cluster in the system, denoted as G(t), increases from zero. In the thermodynamic limit N → ∞, G(t), called the order parameter, exhibits a phase transition from zero to O(1) at a critical point tc. Two types of DPTs are possible, as depicted in Fig. 1. For type-I DPTs, the order parameter G(t) increases dramatically with infinite slope all the way to unity at tc = 1, whereas for type-II DPTs, it also increases similarly but up to a finite value  at a critical point tc < 1, after which it gradually increases to unity.

Schematic diagram of two types of DPTs in CM processes.
ΔG = 1 at tc = 1 for type-I and ΔG < 1 at tc < 1 for type-II.
The pattern of type-I DPTs in CM processes can be found in various models such as a random aggregation model following the Smoluchowski coagulation equation with reaction kernel Kij ~ (ij)ω with 0 ≤ ω < 0.519, the Gaussian model20, the avoiding-a-spanning cluster21,22 and so on23. The type-II DPT in CM processes can be found in a limited number of mathematical models24,25,26. It would be more interesting to investigate the origin of type-II DPTs because this type of DPT can occur in other models, for example, the k-core percolation model27,28,29,30, discontinuous synchronization model31,32, jamming transition model33 and generalized epidemic process model34.
Results
Necessary conditions for two types of discontinuous percolation transitions
Here, we show that the two types of DPTs have different origins. To uncover those origins, we examine the cluster size distributions immediately before and after the percolation threshold, denoted as  and
and  , respectively and defined later in the Methods. To induce a type-II DPT, it is necessary that the clusters at
  are heterogeneous in size, ranging from small cluster sizes to large ones. Among those clusters, primarily large clusters merge to create a macroscopic-scale giant cluster during a short time interval
  . Beyond
  , most of the merging is caused by remnant small clusters, the number of which is still O(N), which mainly join the giant cluster. On the other hand, for a type-I DPT, at
  , the remaining clusters are mainly homogeneous with mesoscopic-scale size and they merge during the interval
  to create a macroscopic-scale giant cluster. A schematic comparison of these kinetics between DPTs of types II and I is shown in Fig. 2.

Schematic illustrations of the cluster size distributions for two types of DPTs.
Schematic illustrations of the cluster size distribution at  and
and  for (a) type-II and (b) type-I are depicted. The number of clusters at
  in [1,s*] is O(N) for (a) and o(N) for (b).
To quantify the origin, we propose the necessary conditions for each type of DPT as follows. Here ns(t) denotes the number of s-size clusters divided by N, which changes with time.
-
1
Necessary condition for type-II DPT: At
 , at least one characteristic cluster size s* > 1 has to exist, which fulfills the following conditions in the thermodynamic limit: I-i)
  , I-ii)
  and I-iii)
 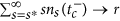 (0 < r < 1).
 -
2
Necessary condition for type-I DPT: At
 , at least one characteristic cluster size s* > 0 has to exist, which fulfills the following conditions in the thermodynamic limit: I-i)
  and II-ii)
  .
.
 , at least one characteristic cluster size s* > 1 has to exist, which fulfills the following conditions in the thermodynamic limit: I-i)
  , I-ii)
  and I-iii)
  (0 < r < 1).
 , at least one characteristic cluster size s* > 0 has to exist, which fulfills the following conditions in the thermodynamic limit: I-i)
  and II-ii)
  .
.The derivations of the two necessary conditions are presented in the Methods.
Two-species cluster aggregation model
We introduce a cluster aggregation model that exhibits both type-I and -II DPTs as the model parameter changes. The dynamic rule is depicted schematically in Fig. 3. For this model, which is referred to as the two-species cluster aggregation (TCA) model, we start with N isolated nodes, half of which are colored black and the other half of which are white. The color may represent opinion, for example, the left- and right-wing positions on a political issue. According to the dynamic rule below, all nodes in the same cluster have the same color: either black or white. At each time step, we first select one case among the three possible combinations, (black, black), (black, white), or (white, white), with probabilities 1/(1 + 2p), p/(1 + 2p) and p/(1 + 2p), respectively, where p is a model parameter in the range 0 < p ≤ 1. Second, two clusters are selected following the colors selected but independently of the cluster sizes. Finally, two nodes—one from each cluster—are selected randomly and connected, which causes the two clusters to merge. If the two selected clusters are the same, then two distinct nodes from that cluster are connected.

Schematic illustrations of the dynamic rule of the TCA model.
(a) There are three types of CM processes, each of which depends on the species of merging clusters. The probabilities for each case are given in the figure.
The colors of all the nodes in the resulting merged cluster are updated according to the following rule: if the colors of the two clusters are the same, there is no change. However, if the colors are different, then the colors of all the nodes in the smaller cluster are changed to that of the larger cluster. This change may represent opinion formation following the so-called majority rule. If the clusters have the same size but different colors, then either color is picked with equal probability. We numerically show that if 0 < p < 1, the PT is discontinuous and occurs at a finite threshold, tc < 1 and if p = 1, tc = 1 [Fig. 4(a)]. We note that if 0 < p < 1, the symmetry between different species in the dynamic rule is broken; if p = 1, the symmetry is preserved.

Numerical tests of necessary conditions for type-II DPT in TCA model.
(a) G(t) vs. t in the TCA model for various values of p for a system size of N = 105. From left to right, p = 0,0.2,0.4,0.6,0.8 and 1.0. (b) The cluster size distributions of black clusters n0s(•) and white clusters n1s(•) at  (upper panel) and
  (lower panel) for N = 212 × 104. (c)
  (◻) and
  vs. N. (d)
  (◻) and
  vs. N. The two data sets converge to the value y0 ≈ 0.63. Inset:
  (◻) and
  vs. N, respectively. The slopes of the guidelines for (◻) in (c) and the inset of (d) are equal to −0.52. The data sets for (b), (c) and (d) are obtained for p = 0.5.
The dynamic rule, particularly in the process of updating the color of nodes, can be modified in several ways. Nevertheless, the overall behavior of the DPT does not change significantly. To facilitate an analytic solution, we modify the dynamic rule as follows: When the colors of the two selected clusters are different, we take black regardless of the cluster size, i.e., without following the majority rule. This modification enables us to set up a coupled Smoluchowski coagulation equation and, consequently, to analytically understand the evolution of a large cluster. When 0 < p < 0.5, the PT is discontinuous at a finite threshold tc < 1 and ΔG < 1 (type-II DPT). When p ≥ 0.5, the PT is also discontinuous, but at tc = 1 and ΔG = 1 (type-I DPT). A detailed derivation is presented in the Methods.
Numerical tests and symmetry-preserving (-breaking) dynamics
Here we test the necessary conditions for the TCA model and clarify the origin of the type-II DPT. For this purpose, we plot the cluster size distribution for the TCA model at  and
and  in Fig. 4(b). At
  , the size distributions of the white and black clusters decay exponentially in the asymptotic region. However, the size distribution of the black clusters is extended to a larger region owing to the symmetry-breaking properties of the dynamic rule. The nodes belonging to the extended (shaded) region correspond to the powder keg referred to in previous studies11,12,16. The combined cluster size distribution exhibits crossover behavior from the region primarily composed of white clusters to that primarily composed of black clusters across a characteristic size, which we denote as s*. This segregation is induced by the symmetry-breaking dynamic rule: Merging occurs with a higher probability between black clusters than between other types of clusters. Thus, black clusters grow more rapidly and belong to the region s > s*. The cluster size distribution at
  , when the dramatically increasing order parameter G(t) changes to a gradually increasing G(t), is shown in the lower panel of Fig. 4(b). The difference between the two figures shows that during the interval
  , almost all the black clusters aggregate to form a large cluster and a small number of white clusters merge with large black clusters as black clusters. This microscopic understanding of the mechanism of a type-II DPT is schematically illustrated in Fig. 5. This origin can also be observed in other models such as the so-called Bohman—Frieze—Wormald (BFW) model24 and a half-restricted process model25, which are shown in the supplementary information. On the basis of these numerical results for the merging processes, we made the assumption stated previously when the necessary conditions were set up.

Schematic illustration of symmetry-preserving (-breaking) dynamics.
Schematic illustration of the formation of type-I and -II DPTs in CM processes through ① upper pathway and ② lower pathway, respectively.
We numerically confirm the necessary conditions that the number of clusters of size s > s* at  is sub-extensive [condition I-i)]. The total number of clusters over the entire range of s is, however, extensive to N [condition I-ii)] [Fig. 4(c)], which is needed for a gradual increase of the order parameter beyond
  . Next, we measure the number of nodes belonging to clusters of sizes s > s*, finding that the order parameter converges to a finite value r ≈ 0.63 < 1 as the system size is increased. The nodes belonging to this region become the elements of a macroscopic-scale giant cluster, as can be seen for large N cases [condition I-iii)] [Fig. 4(d)]. Numerical testing of the necessary conditions is performed for other models such as the BFW model24, the half-restricted process model25 and the ordinary percolation model in a hierarchical network with long-range connection26. The details are presented in the supplementary information.
Discussion
We investigated the origins of the two types of DPTs in CM processes and derived the necessary conditions for them. Our derivation is similar to the picture proposed by Friedman and Landsberg11, in which the occurrence of an abrupt PT is determined by the number of the clusters in the powder keg region with s > s*. They set the characteristic size as s* ~ N1−β with β < 1. Then, Δt < Nβ−1, which is reduced to zero in the limit N → ∞. This criterion is the same as condition I-i) we obtained here. On the other hand, the authors of11 did not classify the necessary conditions for a type-I or -II DPT separately. In a similar way, Hooyberghs and Schaeybroeck12 proposed another criterion for a DPT, which is again limited to our necessary condition for a type-I DPT.
We have also introduced an analytically solvable model in which two species of clusters evolve through CM processes under the symmetry-breaking rule and showed that this symmetry breaking dynamics generates a type-II DPT. This phenomena can also be found in a model for synchronization transition31,32. The detail is presented in SI.
We remark that the origin of the type-II DPT in CM processes differs from that of DPTs driven by the cascading failure dynamics in interdependent networks5 or in the k-core percolation model29. The cluster size distribution at  for the latter case does not resemble that in the former case. Thus, the necessary conditions we studied cannot be applied to the latter case. In addition, when a type-II DPT is induced by the hierarchical structure as in26, even though our necessary conditions were found to be valid, it is not clear yet whether the DPT originates from the symmetry-breaking kinetics.
Methods
Numerical testing
It is necessary to use the appropriate times  and
and  . In Fig. 6, we illustrate how to take
  and
and  in numerical tests of the necessary conditions. We used more than O(1011/N) configurations for all numerical analyses.

 and
and  used for numerical tests.G(t) vs. t for the TCA model with p = 0.5 for different system sizes, N/104 = 1,4,16,64 and 256. (a) We draw a tangent at the time at which the slope dG(t)/dt becomes maximum, which is almost independent of N and denoted as tc. The t intercept of the tangent of the curve G(t) is denoted as
  . As the system size N is increased, the slope dG(t)/dt|max increases. (b) We plot
  of different system sizes vs. a rescaled time as
  . Then, the
  intercept of the tangent of the curve
  is denoted as
  , which is independent of N. Next, we take
  as a crossover point from which
  begins to grow gradually. Then,
  .
.
Derivation of the necessary conditions
To derive the necessary conditions, we suppose the extreme case, in which CM dynamics occurs only between clusters of size s > s* during a short time interval within  . In this case, when intercluster links are added, the order parameter can increase the most rapidly. The number of links to connect all those clusters divided by N is
  , which is equivalent to
  .
.
First, we consider a type-II DPT. To verify condition I-i), we use the fact that if  in the limit N → ∞, then Δt → 0. During this interval, because the order parameter increases as much as O(1), the PT is discontinuous. Thus, condition I-i) provides a necessary condition for a discontinuous PT. To verify condition I-ii), we consider the inequality
  , which comes from the fact that the number of links added up to
  is larger than (or equal to) the number of CM events. The equality holds when the model disallows the attachment of intracluster links. In general, when
  goes to zero,
  in the thermodynamic limit. Condition I-ii),
  , provides a necessary condition for the transition point to be
  . Next, let us define
  , which corresponds to the size of the powder keg in11. Then,
  . This quantity satisfies the following inequality:
  . When conditions I-i) and I-ii) hold, r ≤ 1 − O(1). Thus, r < 1. Condition I-iii) is needed to exclude the case r = 0 for a continuous transition. Thus, conditions I-i), I-ii) and I-iii) are all needed for a type-II DPT.
We now consider a type-I DPT. Condition I-i) suggests that Δt → 0 in the thermodynamic limit. Condition II-ii) suggests that  . Then, using the inequality
  , one can obtain
  in the thermodynamic limit. Thus, the percolation threshold is positioned at tc ≥ 1. We remark that this necessary condition for a type-I DPT in CM processes is equivalent to
  .
.
Analytic calculation of the solvable two-species cluster aggregation model
Let n0s(t) and n1s(t) be the numbers of s-size black and white clusters per node, respectively, at time step t. The rate equations of the two quantities are written as


where  and
and  are the number of finite black and white clusters per node at time t in the system, respectively. Next, we define the generating functions
  and
and  , where the summation runs over finite clusters. As a result, the rate equations (1) and (2) are changed to


Using c0(t) = f(1,t) and c1(t) = g(1,t), we obtain c0(t) = 1/2 − t/(1 + 2p) and c1(t) = 1/2 − 2pt/(1 + 2p). When 0 < p < 0.5, the percolation threshold can be obtained by setting c0(tc) = 0 but c1(tc) > 0, because c0(t) decreases more rapidly than c1(t). Thus, tc = 1/2 + p and a large black cluster emerges at tc. The size of the jump in the order parameter at tc can be obtained using the formula ΔG = 1 − f′(1,tc) − g′(1,tc), which reduces to ΔG = 1 − g′(1,tc), because f′(1,tc) = 0. Thus, the jump in the order parameter is determined to be  . The PT is discontinuous at a finite threshold tc < 1 and ΔG < 1 (type-II DPT).
When p ≥ 0.5, because c1(t) decreases more rapidly than c0(t), the percolation threshold can be obtained using c1(tc) = 0 and c0(tc) > 0. Thus,  . The size of the jump in the order parameter can be obtained using the formula ΔG = 1 − f′(1,tc). However, f′(1,tc) = 1 and f′(1,t) = 1 even for t < 1. Thus, ΔG = 0 for t < 1. When t > 1, f′(1,t) = 0. Thus, the order parameter behaves as ΔG = 1 for t > 1 and the threshold tc = 1 (type-I DPT). These analytic results are checked numerically in the supplementary information.
Additional Information
How to cite this article: Cho, Y. S. and Kahng, B. Two Types of Discontinuous Percolation Transitions in Cluster Merging Processes. Sci. Rep. 5, 11905; doi: 10.1038/srep11905 (2015).
References
Stauffer, D. & Aharony, A. Introduction to Percolation Theory (Taylor and Francis, London, 1994).
Flory, P. J. Molecular size distribution in three dimensional polymers. I. Gelation. J. Am. Chem. Soc. 63, 3083–3090 (1941).
Grassberger, P. On the critical behavior of the general epidemic process and dynamical percolation. Math. Biosci. 63, 157–172 (1983).
Achlioptas, D., D’Souza, R. M. & Spencer, J. Explosive percolation in random networks. Science 323, 1453–1455 (2009).
Buldyrev, S. V., Parshani, R., Paul, G., Stanley, H. E. & Havlin, S. Catastrophic cascade of failures in interdependent networks. Nature 464, 1025–1028 (2010).
Baxter, G. J., Dorogovtsev, S. N., Goltsev, A. V. & Mendes, J. F. F. Avalanche collapse of interdependent networks. Phys. Rev. Lett. 109, 248701 (2012).
Son, S.-W., Bizhani, G., Christensen, C., Grassberger, P. & Paczuski, M. Percolation theory on interdependent networks based on epidemic spreading. Europhys. Lett. 97, 16006 (2012).
Ziff, R. M. Explosive growth in biased dynamic percolation on two-dimensional regular lattice networks. Phys. Rev. Lett. 103, 045701 (2009).
Cho, Y. S., Kim, J. S., Park, J., Kahng, B. & Kim, D. Percolation transitions in scale-free networks under the Achlioptas process. Phys. Rev. Lett. 103, 135702 (2009).
Ziff, R. M. Scaling behavior of explosive percolation on the square lattice. Phys. Rev. E 82, 051105 (2010).
Friedman, E. J. & Landsberg, A. S. Construction and analysis of random networks with explosive percolation. Phys. Rev. Lett. 103, 255701 (2009).
Hooyberghs, H. & Schaeybroeck, B. V. Criterion for explosive percolation transitions on complex networks. Phys. Rev. E 83, 032101 (2011).
D’Souza, R. M. & Mitzenmacher, M. Local cluster aggregation models of explosive percolation. Phys. Rev. Lett. 104, 195702 (2010).
Chen, W. & D’Souza, R. M. Explosive percolation with multiple giant components. Phys. Rev. Lett. 106, 115701 (2011).
da Costa, R. A., Dorogovtsev, S. N., Goltsev, A. V. & Mendes, J. F. F. Explosive percolation transition is actually continuous. Phys. Rev. Lett. 105, 255701 (2010).
Riordan, O. & Warnke, L. Explosive percolation is continuous. Science 333, 322–324 (2011).
Lee, H. K., Kim, B. J. & Park, H. Continuity of the explosive percolation transition. Phys. Rev. E 84, 020101(R) (2011).
Nagler, J., Levina, A. & Timme, M. Impact of single links in competitive percolation. Nat. Phys. 7, 265–270 (2011).
Cho, Y. S., Kahng, B. & Kim, D. Cluster aggregation model for discontinuous percolation transitions. Phys. Rev. E 81, 030103(R) (2010).
Araújo, N. A. M. & Herrmann, H. J. Explosive percolation via control of the largest cluster. Phys. Rev. Lett. 105, 035701 (2010).
Cho, Y. S., Hwang, S. M., Herrmann, H. J. & Kahng, B. Avoiding a spanning cluster in percolation models. Science 339, 1185–1187 (2013).
Schrenk, K. J., Araújo, N. A. M., Andrade, J. S. & Herrmann, H. J. Fracturing ranked surfaces. Sci. Rep. 2, 348 (2012).
Rozenfeld, H. D., Gallos, L. K. & Makse, H. A. Explosive percolation in the human protein homology network. Eur. Phys. J. B 75, 305–310 (2010).
Bohman, T., Frieze, A. & Wormald, N. C. Avoidance of a giant component in half the edge set of a random graph. Random Struct. Algorithms 25, 432–449 (2004).
Panagiotou, K., Spöhel, R., Steger, A. & Thomas, H. Explosive percolation in Erdös-Rényi-like random graph processes. Elec. Notes in Discrete Math. 38, 699–704 (2011).
Boettcher, S., Singh, V. & Ziff, R. M. Ordinary percolation with discontinuous transitions. Nat. Commun. 3, 787 (2012).
Chalupa, J., Leath, P. L. & Reich, G. R. Bootstrap percolation on a Bethe lattice. J. Phys. C 12, L31 (1979).
Kogut, P. M. & Leath, P. L. Bootstrap percolation transitions on real lattices. J. Phys. C 14, 3187 (1981).
Dorogovtsev, S. N., Goltsev, A. V. & Mendes, J. F. F. K-core organization of complex networks. Phys. Rev. Lett. 96, 040601 (2006).
Zhao, J.-H., Zhou, H.-J. & Liu, Y.-Y. Inducing effect on the percolation transition in complex networks. Nat. Commun. 4, 2412 (2013).
Gómez-Gardeñes, J., Gómez, S., Arenas, A. & Moreno, Y. Explosive synchronization transitions in scale-free networks. Phys. Rev. Lett. 106, 128701 (2011).
Zhang, X., Bocaletti, S., Guan, S. & Liu, Z. Explosive synchronization in adaptive and multilayer networks. Phys. Rev. Lett. 114, 038701 (2015).
Echenique, P., Gómez-Gardeñes, J. & Moreno, Y. Dynamics of jamming transitions in complex networks. Europhys. Lett. 71, 325–331 (2005).
Janssen, H.-K., Müller, M. & Stenull, O. Generalized epidemic process and tricritical dynamics percolation. Phys. Rev. E 70, 026114 (2004).
Acknowledgements
This work was supported by NRF grants (Grant Nos. 2010-0015066 & 2014R1A3A2069005) (BK) and the Global Frontier Program (YSC).
Author information
Authors and Affiliations
Contributions
B.K. wrote the main manuscript text and Y.S.C. performed all the simulations. Both authors analyzed all the data.
Ethics declarations
Competing interests
The authors declare no competing financial interests.
Electronic supplementary material
Rights and permissions
This work is licensed under a Creative Commons Attribution 4.0 International License. The images or other third party material in this article are included in the article’s Creative Commons license, unless indicated otherwise in the credit line; if the material is not included under the Creative Commons license, users will need to obtain permission from the license holder to reproduce the material. To view a copy of this license, visit http://creativecommons.org/licenses/by/4.0/
About this article

Cite this article
Cho, Y., Kahng, B. Two Types of Discontinuous Percolation Transitions in Cluster Merging Processes. Sci Rep 5, 11905 (2015). https://doi.org/10.1038/srep11905
Received:
Accepted:
Published:
DOI: https://doi.org/10.1038/srep11905
This article is cited by
-
Explosive Contagion in Networks
Scientific Reports (2016)
-
Anomalous critical and supercritical phenomena in explosive percolation
Nature Physics (2015)
Comments
By submitting a comment you agree to abide by our Terms and Community Guidelines. If you find something abusive or that does not comply with our terms or guidelines please flag it as inappropriate.
