
Abstract
To generate an understanding of the physiological significance of MR images of Non-Thermal Irreversible Electroporation (NTIRE) we compared the following MR imaging sequences: T1W, T2W, PD, GE, and T2 SPAIR acquired after NTIRE treatment in a rodent liver model. The parameters that were studied included the presence or absence of a Gd-based contrast agent, and in vivo and ex-vivo NTIRE treatments in the same liver. NTIRE is a new minimally invasive tissue ablation modality in which pulsed electric fields cause molecularly selective cell death while, the extracellular matrix and large blood vessels remain patent. This attribute of NTIRE is of major clinical importance as it allows treatment of undesirable tissues near critical blood vessels. The presented study results suggest that MR images acquired following NTIRE treatment are all directly related to the unique pattern of blood flow after NTIRE treatment and are not produced in the absence of blood flow.
Introduction
Non-thermal irreversible electroporation (NTIRE) is a new minimally invasive tissue ablation modality in which high strength, nanosecond to millisecond long pulsed electric fields are delivered across the cell to produce nanoscale defects in the cell membrane and thereby cause cell death1,2,3,4. An important attribute of this technique is its ability to selectively ablate the tissue cells while leaving the extracellular matrix intact5. This selectivity is of significant advantage when treating tumors in the vicinity of important physiological structures, such as blood vessels and ducts6, which remain mechanically and morphologically intact after NTIRE.
The application of medical imaging for monitoring minimally invasive tissue ablation was introduced first in the early 1980's for cryosurgery7,8. The application of medical imaging for obtaining maximum treatment efficacy with minimum damage to surrounding normal tissue remains of great importance for any ablation technology. Therefore we attempted medical imaging of NTIRE treated tissues already in the first large animal study in the field using ultrasound5. A markedly hypoechoic lesion was seen on ultrasound in the expected location of the NTIRE treatment, immediately following the application of the electric pulses to a pig liver5. At 24 hours, the hypoechoic ultrasound appearance of the lesion has turned into hyperechoic5. We found that the hypoechoic lesion seen on ultrasound immediately after NTIRE was in good agreement with the region of ablated tissue measured from histology and with predictions from mathematical modeling5. Lee et al.9, reported similar observations on ultrasound imaging of NTIRE and correlation with histology. Appelbaum et al10, have performed a comprehensive study on ultrasound imaging of IRE in the pig liver and the utility of ultrasound measurements in the accurate assessment of ablations margins. They found that immediately following NTIRE the treated zone appeared hypoechoic with well-demarcated margins. During the next 8–15 minutes, this zone decreased in size and became progressively more isoechoic. A peripheral hyperechoic rim surrounding the isoechoic zone developed 25–90 minutes after IRE. The final dimensions of the outer margin of this rim provided the greatest accuracy and tightest correlation with gross pathologic findings. Ed et al11 reported similar observations in NTIRE of the rat liver.
Thomson's group6,12 reported from clinical experience that ultrasound visualization can be difficult, since no reliable differentiation of the entity before IRE/ablation therapy nor afterwards is possible, and therefore, computed tomography (CT) was used for image guidance. Other groups also reported that the lesion produced by NTIRE could be imaged with CT13,14. A recent study by Lee et al15 studied the acute CT characteristics of the ablation zone created by IRE and the correlation with histopathology. To this end CT images of NTIRE treated porcine liver were analyzed using three-dimensional software, and the size of the ablation zone calculated from the portal contrast-enhanced CT scans correlated well with the histopathologically determined size and shape. The appearance of the NTIRE lesion on CT was isodense pre-contrast and hypodense to liver post-contrast, with best delineation in the portal phase. In general, on histopathology, IRE ablation zones showed preserved microvasculature with congestion of sinusoids.
The group of Lee13, showed that MRI, CT, and ultrasound depict NTIRE treatment effects. Recently, a thorough study by the group of Larson, on the use of MRI for imaging NTIRE in the liver of a rodent animal model was published16,17. Using MR-compatible electrodes, the IRE procedure was scanned with T1-weighted (T1W) and T2-weighted (T2W) MRI acquired before and immediately after application of the IRE pulses. MR images were compared with both finite element modeling (FEM) anticipated ablation zones and histologically confirmed ablation zones at necropsy. MR images provided immediate depiction of IRE ablation zones that were hypointense on T1-weighted images and hyperintense on T2-weighted images. MR imaging-based measurements demonstrated excellent consistency with FEM-anticipated ablation zones (for both T1- and T2-weighted images). The MR imaging measurements were also highly correlated with histologically confirmed ablation zone measurements. In a contrast-enhanced MRI study of the rodent liver, IRE was monitored with conventional T1-weighted gradient-recalled echo (GRE) and inversion recovery (IR)-prepared GRE methods to quantitatively measure the size of irreversible electroporation. The analysis showed that necrotic areas measured on the pathology images were well correlated with the hyperintense regions measured on T1-weighted GRE images and normal tissue-nulled IR images, that could be used for qualitative differentiation of the reversible penumbra16,17. The group of Wendler showed inhomogeneous IRE ablation areas in different MRI sequences of pig's kidney, whereas others studies observed homogenous texture in CT scans of ablation area immediately and 7 days after IRE18,19. Wendler et al demonstrated that MRI provides better monitoring of the IRE ablation zones than CT scans due to the higher soft tissue contrast, especially when using selective partial inversion recovery (SPIR) T2-weighted MR images with fat suppression18.
As evident from the papers discussed above, most of the research in medical imaging of NTIRE is of clinical radiology nature and is focused on finding correlations between the images and the extent of the NTIRE-ablated tissue. Yet, defining the clinical border of IRE may be challenging due to a time dependent and currently unpredictable course between reversible and irreversible electroporation of the peri-focal zone. Post-treatment inflammation can also prevent radiological determination of the electroporation treatment margin. The purpose of the presented study was to seek a physiological interpretation of the MR images of NTIRE, rather than a correlation between the image and the extent of tissue damage. We decided to study the liver, for which the majority of the imaging of NTIRE studies was performed. To develop a fundamental understanding of the physiological significance of the MR images, we compared various MR imaging sequences acquired after NTIRE treatment in a rodent liver model. The images were studied pre and post contrast and following in vivo and ex-vivo NTIRE treatments in the same liver.
Results
The following MRI sequences were used in this study: T1W, T2W, PD, GRE and fat suppression sequences T2 Spectral Adiabatic Inversion Recovery (SPAIR). A listing of the MRI sequence parameters used is given in Table 1. The T1W image contrast depends on the spin longitudinal relaxation after RF excitation. Administration of gadolinium-based contrast agents enhances tissue image contrast by shortening T1 tissue relaxation times thus producing a stronger signal. In T2W imaging, the image contrast depends on spin transversal relaxation. Therefore tissues with a longer relaxation time, for instance water, produce a stronger signal. PD MR imaging sequences are usually used to depict pathology in a similar way to T2W. In a GE sequence, the data are sampled during a gradient echo which is one of the advantages of this sequence, allowing better sensitivity to subtle hemorrhages. When using GE imaging sequences, hemorrhages are seen as hypointense regions.

Arrows.
Electroporation effects in MR images
-
Electroporation effects in T1W MR images: Figure 2, shows typical images obtained with the T1W imaging sequence. Figures 2A and 2B show images of NTIRE in vivo treated tissues with 1000 V and 1500 V respectively (Group 1 and Group 2). In these images Gd-DOTA was injected about 2 minutes prior to the NTIRE in vivo treatment and the images were acquired immediately after the treatment. Figures 2A and 2B show a hyperintense signal in the treated regions (arrows).
Figure 2: T1W images taken at: (A) Group 1 step d, (B) Group 2 step d, (C) Group 4 step d, (D) Group 3 step e, (E) Group 1 step g, (F) Group 2 step g. 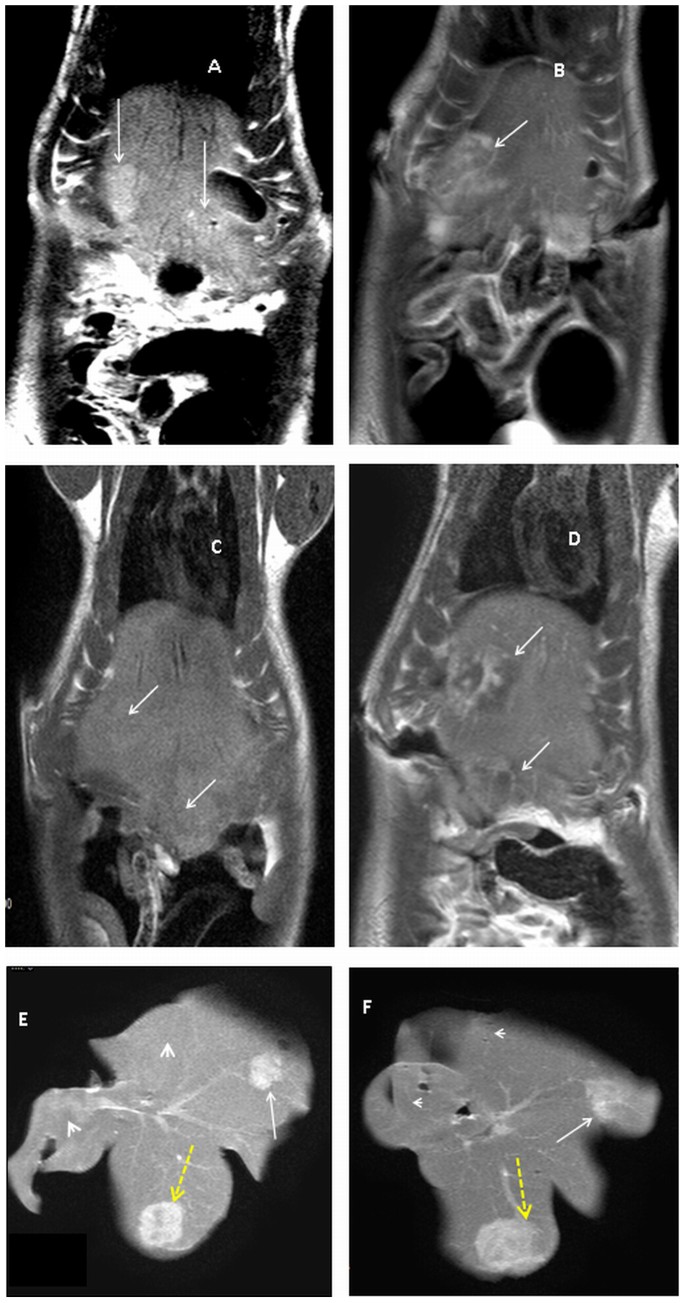
Areas treated with plate electrodes (Dotted yellow arrows), zones treated with needle electrodes (white arrows). Tissues treated in vivo (arrows) and those treated ex vivo (arrowheads).
Figure 2C illustrates the typical appearance of liver treated by NTIRE in vivo 1000 V when no contrast agent was injected prior to the treatment (Group 4). All T1W MR images acquired immediately post NTIRE treatment in vivo without contrast injection, showed in the treated region isointense signals with occasional hypointense signals (arrows).
Figure 2D illustrates the MRI appearance of a liver treated with NTIRE in vivo 1500 V when contrast was injected 20 minutes after the NTIRE treatment and the image was acquired immediately after the contrast injection (Group 3). Interestingly, unlike Figures 2A, 2B and 2C, Figure 2D shows in the NTIRE treated volume mixed hypointense and hyperintense regions.
The images in Figures 2E and 2F were obtained with T1W sequences after livers treated in vivo were removed and then treated ex vivo with the same NTIRE parameters as in vivo (Group 1 and Group 2). The figures are typical to all the various protocols tested. Figure 2E was obtained for a NTIRE protocol using 1000 V and Figure 2F using 1500 V. The most striking observation is that while the tissues treated in vivo retained a hyperintense signal when imaged ex-vivo more than 20 minutes after the in vivo NTIRE treatment (arrows), the tissues treated ex vivo showed an isointense signal (arrow heads).
-
Electroporation effects in T2W MR images: Figure 3, shows typical images obtained with a T2W imaging sequence. Figures 3A and 3B show T2W MR images of NTIRE in vivo treated tissues with 1000 V and 1500 V respectively (Group 1 and Group 2). Gd-DOTA was injected about 2 minutes prior to the NTIRE in vivo treatment and the images were acquired immediately after the treatment. Figure 3C illustrates the typical appearance of liver treated with NTIRE in vivo 1000 V when no contrast was injected prior to the treatment (Group 4). Figure 3D illustrates the MRI appearance of a liver treated with NTIRE in vivo 1500 V when the contrast agent was injected 20 minutes after the NTIRE treatment and the image was acquired immediately after the contrast injection (Group 3). In all the figures that depict T2W images of tissues treated in vivo the treated volumes show a hyperintense signal.
Figure 3: T2W images taken at: (A) Group 1 step d, (B) Group 2 step d, (C) Group 4 step d, (D) Group 3 step e, (E) Group 1 step g, (F) Group 2 step g. 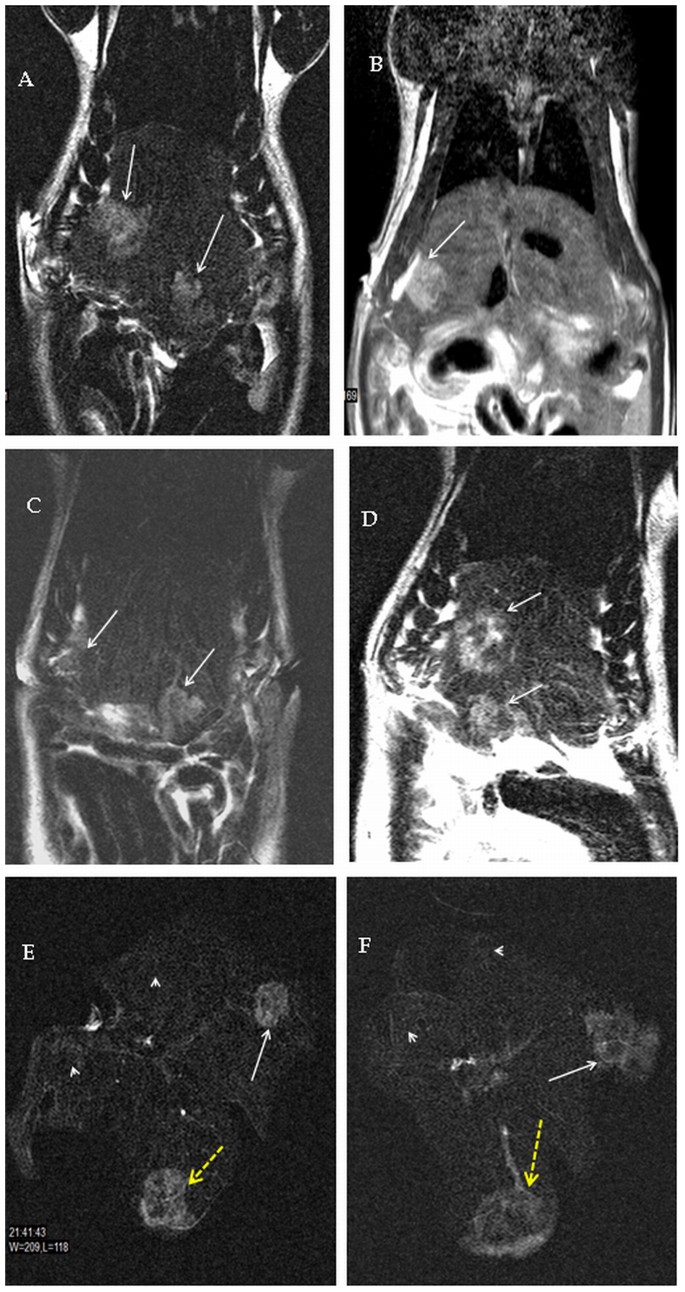
Areas treated with plate electrodes (Dotted yellow arrows), zones treated with needle electrodes (white arrows). Tissues treated in vivo (arrows) and those treated ex vivo (arrowheads).
The images in Figures 3E and 3F were obtained with T2W sequences after livers treated in vivo were removed and then treated ex vivo with the same NTIRE parameters as in vivo. The figures are typical to all the various protocols tested. Figure 3E was obtained for a NTIRE protocol using 1000 V and Figure 3F using 1500 V (Group 1 and Group 2, respectively). It is interesting that while the tissues treated in vivo retained a hyperintense signature (arrows) more than 20 minutes after the NTIRE in vivo treatment and after trauma from excising the liver, the tissues treated ex vivo appear isointense (arrow heads).
-
Electroporation effects in PD MR images: Figure 4, shows typical images obtained with a PD imaging sequence. Figures 4A and 4B show images of in vivo NTIRE treated tissues with 1000 V and 1500 V respectively (Group 1 and Group 2, respectively). The images in Figures 4C and 4D were obtained with PD sequences after livers treated in vivo were removed and then treated ex vivo with the same NTIRE parameters as in vivo. Figure 4C was obtained for a NTIRE protocol using 1000 V and Figure 4D using 1500 V (Group 1 and Group 2, respectively). Figures 4A and 4B of PD MR images show a hyperintense signal from the in vivo treated regions of tissue. Similarly, a hyperintense signal can be seen from the in vivo NTIRE treated tissues, when scanned ex vivo (4C and 4D). In contrast, NTIRE tissues treated ex vivo with the same parameters as in vivo show isointense signal (arrowheads in Figures 4C and 4D).
Figure 4: PD images taken at: (A) Group 1 step d, (B) Group 2 step d, (C) Group 1 step g, (D) Group 2 step g. 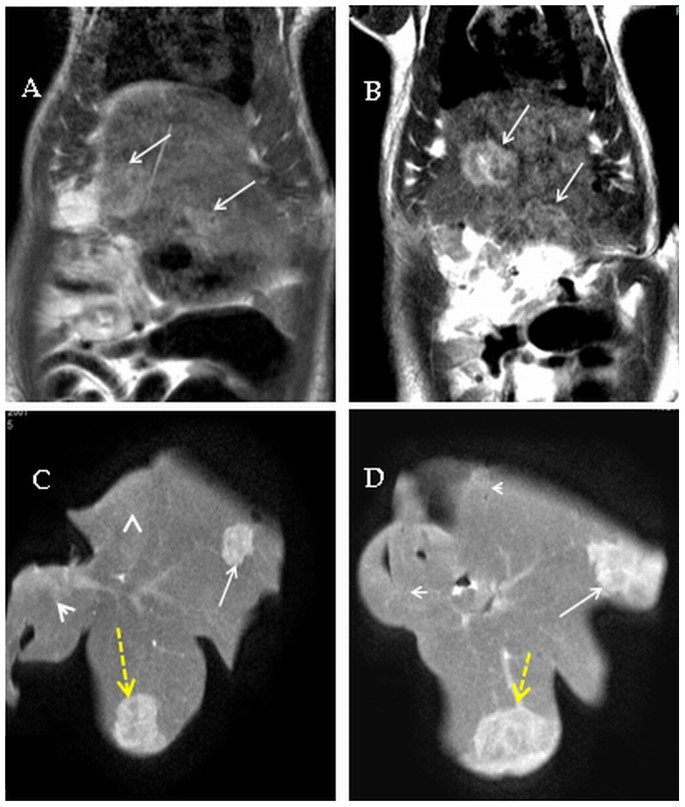
Areas treated with plate electrodes (Dotted yellow arrows), zones treated with needle electrodes (white arrows). Tissues treated in vivo (arrows) and those treated ex vivo (arrowheads).
-
Electroporation effects in GE MR images: Figure 5, shows typical images obtained using a GE imaging sequence. Figures 5A and 5B show images of NTIRE in vivo treated tissues with 1000 V and 1500 V respectively (Group 1 and Group 2, respectively). The images in Figures 5C and 5D were obtained with GE sequences after livers treated in vivo were removed and then treated ex vivo with the same NTIRE parameters as in vivo. Figure 5C was obtained for a NTIRE protocol using 1000 V and Figure 5D using 1500 V (Group 1 and Group 2, respectively). GE images of in vivo treatment, Figures 5A and 5B, show mixed signals in the treated zones including hypointense signals indicating acute hemorrhages surrounded by hyperintense signals indicating accumulation of fluid. A similar combination of hyperintense and hypointense signals can be seen from the same zones scanned ex vivo, Figures 5C and 5D. However, regions treated with NTIRE ex vivo, with the same parameter as those used in vivo, are isointense (arrow heads).
Figure 5: GRE images taken at: (A) Group 1 step d, (B) Group 2 step d, (C) Group 1 step g, (D) Group 2 step g. 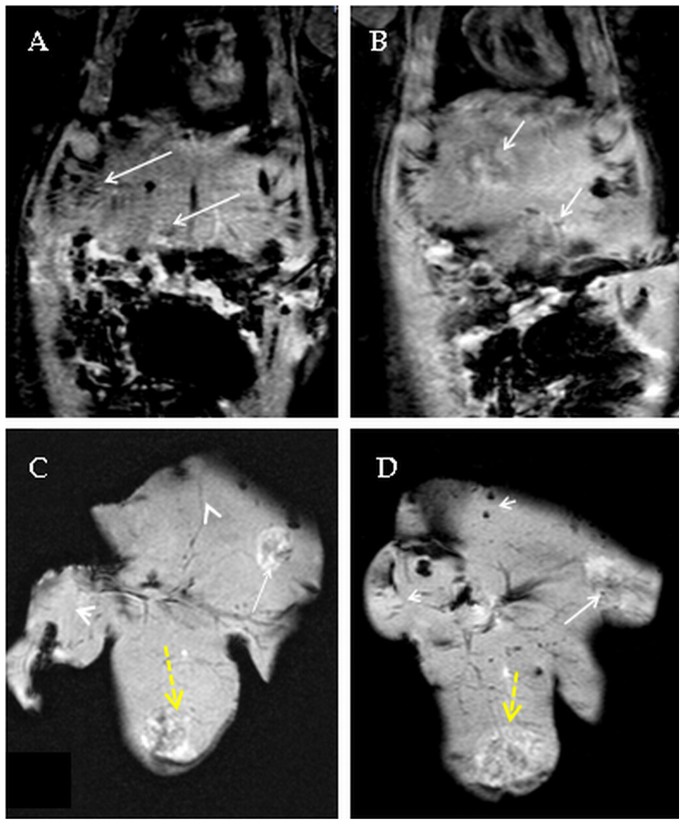
Areas treated with plate electrodes (Dotted yellow arrows), zones treated with needle electrodes (white arrows). Tissues treated in vivo (arrows) and those treated ex vivo (arrowheads).
-
Electroporation effects in T2 SPAIR MR images: Figure 6, shows typical images obtained with a T2 SPAIR sequence. Figures 6A and 6B show images of NTIRE in vivo treated tissues with 1000 V and 1500 V respectively (Group 1 and Group 2). The images in Figures 6C and 6D were obtained after livers treated in vivo were removed and then treated ex vivo with the same NTIRE parameters as in vivo (Group 1 and Group 2, respectively). Figure 6C was obtained for a NTIRE protocol using 1000 V and Figure 6D using 1500 V. SPAIR images shows increased signals only from the in vivo treated volumes, in agreement with the previous sequences.
Figure 6: T2 SPAIR images taken at: (A) Group 1 step d, (B) Group 2 step d, (C) Group 1 step g, (D) Group 2 step g. 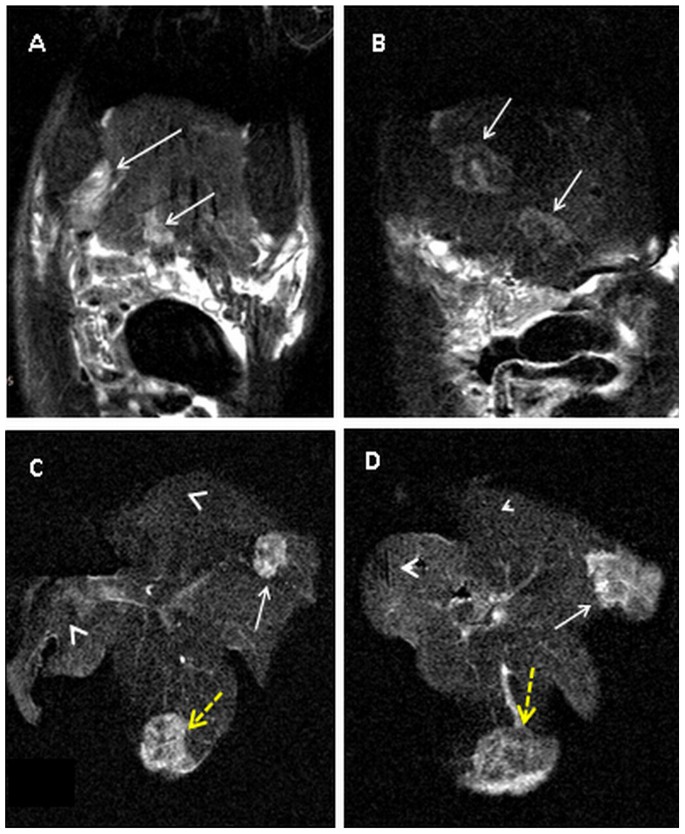
Areas treated with plate electrodes (Dotted yellow arrows), zones treated with needle electrodes (white arrows). Tissues treated in vivo (arrows) and those treated ex vivo (arrowheads).


In addition to the observations listed above, we have also calculated the volumes of the treated tissues with various electroporation parameters as calculated from the various imaging sequences. The volumes of the treated tissues as calculated from the T1W, T2W and PD MR images are given in Table 3.
Electroporation effects in histological samples
Figure 7, shows typical images of H&E stained tissues treated with NTIRE in vivo in comparison with similar NTIRE treatments ex vivo. Figures 7A and 7C were obtained for an in vivo NTIRE treated liver with needle electrodes and plate electrodes, respectively. They show that the nucleus of the cells (hepatocytes) in the treated region was pyknotic (dark and shriveled) and that red blood cells accumulated in the NTIRE treated region. Figures 7B and 7D were obtained for an ex-vivo NTIRE treated liver with needle electrodes and plate electrodes, respectively. The most striking difference in the histological appearance of in vivo NTIRE treated tissues 7A and 7C and ex-vivo NTIRE treated tissue 7B and 7D was the red blood cells accumulation. Focusing on the accumulation of the red blood cells we notice that the highest concentration was in the vicinity of major blood vessels that were not occluded (arrows in Figures 7A and 7C). In contrast, in ex-vivo NTIRE treated tissues there was no red blood cells accumulation near large blood vessels in the treated volume (arrow in Figure 7B). It is important to also note that the hepatocytes in the region adjacent to the large blood vessel were pyknotic, which indicates that the treatment has ablated the cells.

(× 10).
Discussion
MRI plays an important role in diagnostic imaging. It is also important in treatment planning, monitoring and follow up of minimally invasive surgical techniques. While previous imaging studies of NTIRE focused on the clinically important correlation between the images acquired after NTIRE and the long-term outcome of the procedure in terms of tissue ablation, the goal of this study was to generate a physiological interpretation of various MR imaging sequences acquired immediately following NTIRE. Below we evaluate the significance of each sequence separately and then discuss the significance in the context of histology. Briefly, our results suggest that changes in the enhancement observed in the MR images are a consequence of NTIRE induced changes in local blood flow such as increased accumulation of fluid, accumulation of red blood cells and retention or wash out of contrast agents due to particular patterns of the blood flow. Sersa et al reported a remarkable phenomenon of blood perfusion disruption with consecutive ischemia during in vivo electroporation, referred to as the vascular lock and explained as electrical vasoconstriction reflex or collapse by decreased intravascular pressure of afferent arterioles20,21. Other experimental studies of histological analysis after NTIRE of in vivo porcine liver demonstrated intact major vascular structures and necrotic small vessels with organized intraluminal fibrin thrombi in the ablated area within 24 hours after NTIRE1,5,13. Wendler et al demonstrated NTIRE pulse synchrone concentric wavelike fluctuation of the diffusible contrast agent in DSA during NTIRE of the perfused ex vivo kidney and excluded extravasation of non-diffusible barium X-ray contrast agent in mammography technique after NTIRE22. This subject was further studied by Markelc et al and Bellard et al23,24 on the level of single normal and tumor blood vessels and by Guo et al25 in the rabbit liver tumor.
Figures 2A and 2B show a hyperintense signal from the NTIRE treated tissue, in MR images acquired immediately after the treatment. This observation is consistent with previous similar MRI studies16,17.
The long term survival animal studies have also shown that the hyperintense T1W signal correlates well with tissue ablation, suggesting that the enhanced contrast is related to the NTIRE induced opening of the cell membrane and small blood vessels (sinusoids) rupture. This allows the contrast agent, injected prior to NTIRE, to be retained in the treated volume in a higher concentration, while it is washed out from the untreated volume. This is supported by Figure 2C, in which T1W images were acquired without a contrast agent, showing only a faint hypointense signal in the treated zone. Interestingly, unlike Figures 2A, 2B and 2C, Figure 2D, for which the contrast agent was injected 20 minutes post in vivo NTIRE, shows mixed hypointense and hyperintense regions. This is consistent with the hypothesis that hyperintense signals are produced by contrast agent in the treated volume where blood can reach. The explanation is also consistent with the histological data discussed in5,11, showing that in NTIRE in the liver, small blood vessels (sinusoids) are damaged and occluded while large vessels remain intact and open. In fact, the patency of large blood vessels after NTIRE is the major advantage of NTIRE over other ablation methods. Figure 2D, can be explained similarly. The hypointense regions are those in which the small blood vessels have been destroyed and to which the contrast injected 20 minutes later had no access. The hyperintense regions represent the patent blood vessels within the NTIRE treated region through which blood carrying the contrast agent flows. To the best of our knowledge this is the first experimental examination with MR imaging of the hypothesis that after NTIRE, large blood vessels and ducts remain patent. It also suggests that later stage injection of contrast agents could be used to evaluate with T1W sequences the patency of blood vessels in the NTIRE treated volumes.
Figures 2E and 2F show that in tissues treated with NTIRE ex vivo the signal is isointense. The fact that the regions treated in vivo retained hyperintense signals despite the traumas the livers have experienced following removal and further NTIRE treatment, serves as proof that the in vivo NTIRE treated region has trapped the contrast agent, probably in the regions in which the small blood vessels have collapsed. This could be valuable in combining chemotherapy with NTIRE as discussed in5. Similarly to the contrast agent, therapeutic agents injected prior to NTIRE would be trapped in the treated volumes and should continue to be effective after the NTIRE treatment. The damaged small blood vessels in the treated regions prevented the contrast agent washout. Therefore, T1W images using gadolinium-based contrast agents injected prior to in vivo NTIRE treatment depicting hyperintense regions represent volumes of tissue in which the small blood vessels have been destroyed and blood flow has ceased. T1W images with contrast injected after NTIRE may be used to provide evidence of the patency of large blood vessels or duct structures, reflected as hyperintense regions.
In Figures 3A and 3B that depict T2W images taken immediately after NTIRE in vivo, the treated volumes show a bright signature. The hyperintense signal is generated from accumulation of fluid, consistent with edema, and is not significantly affected by Gd-based contrast agents. A comparison of Figs. 2C and 3C, that were acquired without contrast agent injection, is particularly interesting. In Figure 2C, which was acquired using a T1W sequence, there is no signal from the treated volume in the absence of Gd-DOTA. In contrast, in Fig. 3C, which was acquired with a T2W sequence that depicts accumulation of fluid, there is a hyperintense signal in the treated region even in the absence of the contrast agent. This is consistent with both the nature of T1W and T2W MR sequences imaging and the physiological phenomena which were observed after NTIRE5,11, i.e. accumulation of fluid and red blood cells in the treated volume. There is no such signal for ex vivo treated tissues, as expected. Figure 3D shows heterogeneous signal with mixed hyperintense and hypointense regions in the in vivo NTIRE treated zone acquired 20 minutes after the treatment. This could be also explained by the mechanism of blood flow and the patency of large blood vessels. The image is actually qualitatively similar to Figure 2D.
Figures 3F and 3E show that the tissues treated in vivo produce hyperintense signals (arrows) more than 20 minutes after the NTIRE in vivo treatment and after trauma from excising the liver. In contrast, the tissues treated ex vivo appear isointense (arrow heads). The fact that the regions treated in vivo retain some hyperintense signals ex vivo, suggests that accumulation of fluid in the NTIRE treated region remains, at least for a short period after the removal of the liver and in some parts of the treated volume. It is interesting to note that the regions treated ex vivo, produce no signal change in T2W sequence MR images. It should be emphasized that the ex vivo NTIRE treatment and imaging occurred within several minutes from removal of the liver which is not sufficient for substantial physiological and metabolic changes. The only major change and immediate physiological change is cessation of blood flow. This suggests that the T2W images of NTIRE are related to physiological changes associated with the effect of NTIRE on blood flow. Our explanations for the difference between the T2W images of tissues treated with NTIRE in vivo and ex-vivo are supported by the histological analysis.
Figures 3 and 4 show that PD and T2W sequences show similar qualitative effects of NTIRE. They both show hyperintense signal after in vivo NTIRE and isointense signal after ex vivo NTIRE. The strong signal of the in vivo NTIRE treated region is retained after the liver was excised, suggesting that the sequence does not show cell damage of the kind that PD MRI can detect.
Figures 5A–D GE images show a heterogeneous signature in the in vivo NTIRE treated volumes. Hypointense regions surrounded by hyperintense signals are seen in both in vivo and ex vivo taken sequences. Figure 5B, shows that the central part of the treated volume is hypointense due to hemorrhage. However, these mixed signals are not seen from the sites treated ex vivo. In particular, the hypointense signals indicating hemorrhages are missing. This may be explained by the lack of blood supply to the treated zone.
SPAIR is a powerful technique for fat suppression. SPAIR plays an important role in liver lesions interpretation and is crucial for the depiction of edema and/or free fluid. As with the previous sequences T2 SPAIR shows hyperintense signal in the in vivo NTIRE treated zones, when imaged in vivo and ex vivo. In contrast an isointense signal is produced from the ex vivo NTIRE treated region. This confirms, once again, the hypothesis that NTIRE imaging is related to local edema or fluid accumulation which does not occur in the absence of blood flow (i.e., ex vivo).
Figures 7A and 7C of in vivo NTIRE treated livers show images similar to those reported in previous studies5,11. They show accumulation of red blood cells in the treated region, in which the cells have pyknotic nuclei and therefore dead. The figures also show that while the sinusoids are occluded, the larger blood vessels are open. Focusing on larger blood vessels we notice that in the in vivo NTIRE treated region the accumulation of the red blood cells is not uniform through the treated volume. The highest concentration of red blood cells is found in the vicinity of the major blood vessels that are not occluded (arrows in Figures 7A and 7C). This is probably caused by a balance between the higher pressure of the blood in the open large blood vessels and the increased resistances to blood flow through the damaged/occluded smaller vessels.
The most striking difference in the histology of in vivo NTIRE treated tissues 7A and 7C from ex-vivo NTIRE treated tissue 7B and 7D is the red blood cells accumulation. It is evident that in the ex-vivo NTIRE treated tissues there is no red blood cells accumulation, even near large blood vessels in the treated volume (arrow in Figure 7B). Nevertheless the hepatocytes in the region adjacent to the large blood vessel are pyknotic, which indicates that the NTIRE treatment has ablated the cells. This may be explained by the cells still being intact by the time of electroporation. A comparison between histology of liver treated by NTIRE in vivo and ex vivo was not done before, to the best of our knowledge. The histology taken together with the various MR imaging sequences tentatively supports the idea that the enhancement seen in the MR images is related to the effect of NTIRE on blood flow. In the absence of blood flow no MR contrast is produced by NTIRE. The imaging equivalence of the accumulation of red blood cells seen in vivo histologically, is the enhancement seen in the MR images reflecting accumulation of the contrast agent. Similarly to the histological entrapment of the blood cells, the contrast agent is entrapped in the volume treated in vivo. The non-contrast agent dependent sequences show images that are also consistent with the histological observations. The enhanced signal is either due to accumulation of fluid or of blood. No contrast enhancement is seen in ex vivo NTIRE treated tissues.
In the current study we showed that small vessel occlusion and accumulation of blood cells and fluid seen histologically in larger vessels may explain the enhancement seen on MR images after NTIRE with and without prior injection of contrast agents. The question of whether these results may be applied for monitoring NTIRE treatment in other organs is yet to be studied. Still, it is reasonable to assume that the effect of NTIRE on blood vessels does not depend on the tissue type, and therefore the effect of contrast entrapment in treated tissue, resulting in contrast-enhancement on T1W MR images, is expected to be reproduced also in other organs treated by NTIRE. Similarly, edema is depicted on T2W MR images as increased signal intensity in most organs and therefore, is expected to be reproduced as well following NTIRE.
The results of volume calculation show that for the same voltage, the volumes of regions treated with plate electrodes (PE) were significantly larger (p < 0.0001) than the volume produced with needle electrodes (NE): 625.6 ± 30.0 versus 387.0 ± 9.0 respectively. The volumes produced using stronger electric fields (1500 V) were significantly larger (p < 0.0001) than those treated using a weaker field (1000 V): 1019.5 ± 46.0 versus 625.6 ± 30.0 respectively. This is as expected. However, it is interesting to note that the volumes calculated from the images produced with the different MRI sequences of the same mode of administration of NTIRE were not significantly different, (p < 0.001) suggesting that they all represent the same physiological mechanism.
In summary, in order to provide a fundamental understanding of the physiological significance of the NTIRE-induced MR effects, we compared the following MR sequences: T1W, T2W, PD, GE, and T2 SPAIR acquired after NTIRE treatment in a rodent liver model. The parameters that were studied included the presence or absence of a Gd-based contrast agent, and in vivo and ex-vivo NTIRE treatments in the same liver. A most striking observation was that the same MRI sequences that showed changes in contrast at the treated site after NTIRE in vivo failed to show signal change at the treated site when NTIRE was performed ex-vivo, within minutes after the excision of the organ. A comprehensive evaluation of the results suggests that all the MR sequences produce changes in contrast that are related to the unusual effect of NTIRE on blood vessels; in which smaller blood vessels are destroyed while larger blood vessels remain patent. The blood flow through the larger blood vessels causes accumulation of fluid and blood cells (and contrast agents) in the treated area. We tentatively suggest that this accumulation is what the MRI shows. It should be emphasized that the fact that blood accumulates in the NTIRE treated zone was observed in the past by us and by many others10,11,13. The results further suggest the importance of understanding the physiological significance of immediately or real-time medical imaging of NTIRE26,27 and the value of further advancing the understanding of how blood flow is related to tissue ablation by NTIRE.
Methods
All procedures complied with the National Institute of Health Guide for the care and use of Laboratory Animals and were approved by and performed in accordance with the guidelines of The Animal Care and Use Committee of the Sheba Medical Center, which is approved by the Israeli authorities for animal experimentation.
Animal model
The study was performed using forty-two male Spring Dawley rats, weighing 300–324 grams at the day of the treatment, in groups as detailed later.
Surgical procedure
Prior to the NTIRE procedure, the rats were anesthetized using ketamine and xylasine (40 mg/kg and 10 mg/kg, respectively). Once anesthetized, a transverse incision was made starting from the mid-sagittal position, approximately 1 cm caudal to the xiphoid process, exposing the liver. The animals were under controlled anesthesia throughout the entire experiment until euthanasia.
Experimental outline
The experiment was designed to permit comparison between images produced by various MRI sequences of rat livers treated with the NTIRE procedure in vivo and ex vivo with contrast agents injected at various times in relation to the performance of the procedure or without contrast injection.
The general experimental outline was as following: a) Rats were anesthetized and the liver was exposed (but remained intact within the rat vasculature), b) NTIRE treatment was delivered to selected lobes of the liver, in vivo c) Various MRI sequences were acquired within two minutes from the NTIRE treatment, d) The liver was removed and NTIRE treatment was delivered ex-vivo to previously untreated lobes of the liver, e) the entire liver was imaged with the same MRI sequences as the in vivo NTIRE treated liver within two minutes after the ex-vivo NTIRE treatment, f) livers were sent for histology.
Injection of contrast agent
Contrast agents were either: a) injected two minutes prior to the in vivo NTIRE treatment, b) injected 20 minutes after the NTIRE treatment, c) not injected.
The rats were injected intraperitoneal (IP) with an MRI contrast agent, 600 μl/kg Gd-DOTA (DOTAREM, 0.5 mmol/mL, Guerbet, France).
NTIRE treatment
Electroporation was performed using two electrode types, needle and plates (Figure 1). Figure 1 A shows two 25 G stainless steel needle electrodes, inserted vertical to the surface of the lobe into the liver tissue, 5 mm apart, resulting in a two-dimensional lesion. Figure 1 B shows two parallel stainless steel plate electrodes (5 × 6 mm) applied parallel to the surface of the lobe in such a way as to clamp a part of a liver lobe between the plates. The spacing between the plate electrodes was set to 5 mm. The NTIRE parameters were chosen from the published literature so as to produce irreversible electroporation of a type that is visible with medical imaging and for which it is known that the MR image correlates well to tissue ablation5,6,7,9,12,13,14,15,16,17. Specifically, the NTIRE parameters used were either 1000 V on the energized electrode (2000 V/cm – voltage/distance between electrodes) or 1500 V on the energized electrode (3000 V/cm – voltage/distance between electrodes)5. The NTIRE treatment consisted of eight pulses of either 1000 V or 1500 V, each 100 μs long, delivered at a frequency of 4 Hz. The power supply was a commercial electroporator, BTX power supply (BTX 830; Harvard Apparatus, Holliston, MA), connected to the electrodes.
MRI data acquisition and analysis
The rats were scanned under full anesthesia in a clinical GE 1.5 T MRI system (Optima MR450w, General Electric, Milwaukee) using the standard phased array human wrist coil. MR images were acquired with the following parameters: 14 slices of 2 mm thickness; Field of view: 80 × 80 mm; Reconstruction matrix of 512 × 512. The dimensions of the treated lesions were calculated from the MR images by plotting regions of interest over the entire lesion region in each slice, adding the number of pixels in each slice and multiplying by the volume of each pixel. The following MRI sequences were used in this study: T1W, T2W, PD, GRE and fat suppression sequences T2 Spectral Adiabatic Inversion Recovery (SPAIR). A listing of the MRI sequence parameters used is given in Table 1.
The T1W image contrast depends on the spin longitudinal relaxation after RF excitation. Administration of gadolinium-based contrast agents enhances tissue image contrast by shortening T1 tissue relaxation times thus producing a stronger signal. In T2W imaging, the image contrast depends on spin transversal relaxation. Therefore tissues with a longer relaxation time, for instance water, produce a stronger signal. PD MR imaging sequences are usually used to depict pathology in a similar way to T2W. In a GE sequence, the data are sampled during a gradient echo which is one of the advantages of this sequence, allowing better sensitivity to subtle hemorrhages. When using GE imaging sequences, hemorrhages are seen as hypointense regions.
Histology
The liver lobes in which the NTIRE lesions were made were removed and stored in a 4% fixative solution. For microscopic analysis the tissue was bread loafed perpendicular to the lobe surface through the NTIRE treated lesion. The tissue samples were routinely processed from 10% Phosphate Buffered Formalin to wax blocks. Five-micrometer sections were made from each block and stained with Hematoxylin and Eosin for histological examination. The goal of the histological analysis was to compare the nature of tissue treated with NTIRE in vivo and ex vivo, in particular in relation to the vascular content and structure with emphasis on parameters affected by flow. Parameters to be studied are accumulation of red blood cells (and its uniformity) in the treated region, occluded versus open blood vessels and the histological appearance of the tissue in the vicinity of the patent blood vessels.
Study groups
The study consisted of four groups of rats, all of which treated with needle and plate electrodes. Each rat underwent the following procedure: a) livers were surgically exposed, b) contrast agent was injected IP (as listed in Table 2), c) within two minutes selected lobes of the liver were treated in vivo with needle and plate electrodes with the treatment voltage listed in Table 2, d) within two minutes after NTIRE various MR images using various sequences were acquired, e) within 20 minutes from the NTIRE treatment the livers were removed, f) within two minutes after removal the liver lobes were treated ex vivo with needle and plate electrodes with NTIRE-Protocol A, g) within two minutes after the ex vivo NTIRE the excised liver was imaged with various MR imaging sequences in such a way that the sites treated in vivo and ex-vivo were visible, h) the livers were fixated and sent for histological evaluation. The number of rats in each group and the specific treatment parameters are listed in Table 2.
References
Rubinsky, B. in Series in Biomedical Engineerng (ed Joachim, H.) 314 (Springer, New York, 2010).
Weaver, J. C. Theory of electroporation: a review. Bioelectrochem Bioenerg 41, 135–160 (1996).
Chen, C., Smye, S. W., Robinson, M. P. & Evans, J. A. Membrane electroporation theories: a review. Med Biol Eng Comput. 44, 5–14 (2006).
Teissie, J., Golzio, M. & Rols, M. P. Mechanisms of cellmembrane electropermeabilization: a minireview of our present (lack of?) knowledge. Biochim Biophys Acta. 1724, 270–280 (2005).
Rubinsky, B., Onik, G. & Mikus, P. Irreversible electroporation: a new ablation modality-clinical implications. Technol Cancer Res Treat 6, 37–48 (2007).
Thomson, K. R. et al. Investigation of the safety of irreversible electroporation in humans. J Vasclnterv Radiol 22, 611–621 (2011).
Onik, G., Cooper, C., Goldberg, H. I., Moss, A. A., Rubinsky, B. & Christianson, M. Ultrasonic characteristics of frozen liver. Cryobiology 21, 321–328 (1984).
Gilbert, J. C., Onik, G. M., Haddick, W. K. & Rubinsky, B. CryoBiology 22, 319–330 (1985).
Lee, E. W., Loh, C. T. & Kee, S. T. Imaging guided percutaneous irreversible electroporation: ultrasound and immunohistological correlation. Technol Cancer Res Treat 6, 287–294 (2007).
Appelbaum, L., Ben-David, E., Sosna, J., Nissenbaum, Y. & Goldberg, S. N. US Findings after irreversible electroporation ablation: Pathological Correlation. Radiology 262, 117–125 (2012).
Edd, J. F., Horowitz, L., Davalos, R. V., Mir, L. M. & Rubinsky, B. In vivo results of a new focal tissue ablation technique: irreversible electroporation. IEEE Trans Biomed Eng 53, 1409–1415 (2006).
Ball C, T. K. & Kavnoudias, H. Irreversible electroporation: a new challenge in “out of operating theater”anesthesia. AnesthAnalg 110, 1305–1309 (2010).
Lee, E. W., Chen, C., Prieto, V. E., Dry, S. M., Loh, C. T. & Kee, S. T. Advanced hepatic ablation technique for creating complete cell death: irreversible electroporation. Radiology 255, 426–433 (2010).
Deodhar, S. et al. Percutaneous Irreversible Electroporation Lung Ablation:Preliminary Results in a Porcine Model. CardiovascInterventRadiol 34, 1278–1287 (2011).
Lee, Y. J., Lu, D. S., Osuagwu, F. & Lassman, C. Irreversible Electroporation in Porcine Liver: Acute Computed Tomography Appearance of Ablation Zone With Histopathologic Correlation. J Comp Assist Tomog 37, 154–158 (2013).
Zhang, Y. et al. MR imaging to assess immediate response to irreversible electroporation for targeted ablation of liver tissue: preclinical feasibility studies in a rodent model. Radiology 256, 424–432 (2010).
Guo, Y. et al. Irreversible electroporation in the liver: contrast inversion imaging approaches to differentiate reversible electroporation penumbra from irreversible electroporation zones. Radiology 258, 461–468 (2011).
Wendler, J. J. et al. Short- and mid-term effects of irreversible electroporation on normal renal tissue: an animal model. Cardiovasc Intervent Radiol 36, 512–520 (2013).
Deodhar, A. et al. Renal tissue ablation with irreversible electroporation: preliminary results in a porcine model. Urology 77, 754–760 (2011).
Sersa, G. et al. Vascular disrupting action of electroporation and electrochemotherapy with bleomycin in murine sarcoma. Br J Cancer 98, 388–398 (2008).
Calmels, L., Al-Sakere, B., Ruaud, J. P., Leroy-Willig, A. & Mir, L. M. In vivo MRI follow-up of murine tumors treated by electrochemotherapy and other electroporation-based treatments. Technol Cancer Res Treat 11, 561–70 (2012).
Wendler, J. J. et al. Angiography in the isolated perfused kidney: radiological evaluation of vascular protection in tissue ablation by nonthermal irreversible electroporation. Cardiovasc Intervent Radiol 35, 383–390 (2012).
Markelc, B., Sersa, G. & Cemazar, M. Differential mechanisms associated with vascular disrupting action of electrochemotherapy: intravital microscopy on the level of single normal and tumor blood vessels. PLoS One 8, e59557 (2013).
Bellard, E. et al. Intravital microscopy at the single vessel level brings new insights of vascular modification mechanisms induced by electropermeabilization. J Control Release 163, 396–403 (2012).
Guo, Y. et al. Electroporation-mediated transcatheter arterial chemoembolization in the rabbit VX2 liver tumor model. Invest Radiol 47, 116–20 (2012).
Hjouj, M. & Rubinsky, B. Magnetic resonance imaging characteristics of non-thermal irreversible electroporation in vegetable tissue. J Membrane Biol 236, 137–146 (2010).
Hjouj, M. et al. MRI study on reversible and irreversible electroporation induced blood brain barrier disruption. PLoS One 7, e42817 (2012).
Acknowledgements
The authors gratefully acknowledge Dr. Izzeddin Bakri, MD, and Nael Anabtawi, Histology Technologist, from the Department of Pathology, Makassed Hospital, Jerusalem for their help in the histology specimens.
Author information
Authors and Affiliations
Contributions
Hjouj M., Mardor Y., Lavee J. and Rubinsky B. wrote the main manuscript text and prepared the figures; Hjouj M., Last D., Guez D., Daniels D. and Sharabi S. performed the experiments. All authors reviewed the manuscript.
Corresponding author
Ethics declarations
Competing interests
The authors declare no competing financial interests.
Rights and permissions
This work is licensed under a Creative Commons Attribution-NonCommercial-NoDerivs 3.0 Unported License. To view a copy of this license, visit http://creativecommons.org/licenses/by-nc-nd/3.0/
About this article
Cite this article
Hjouj, M., Lavee, J., Last, D. et al. The Effect of Blood Flow on Magnetic Resonance Imaging of Non Thermal Irreversible Electroporation. Sci Rep 3, 3088 (2013). https://doi.org/10.1038/srep03088
Received:
Accepted:
Published:
DOI: https://doi.org/10.1038/srep03088
Comments
By submitting a comment you agree to abide by our Terms and Community Guidelines. If you find something abusive or that does not comply with our terms or guidelines please flag it as inappropriate.
