
Abstract
The lack of publicly available datasets of computed-tomography angiography (CTA) images for pulmonary embolism (PE) is a problem felt by physicians and researchers. Although a number of computer-aided detection (CAD) systems have been developed for PE diagnosis, their performance is often evaluated using private datasets. In this paper, we introduce a new public dataset called FUMPE (standing for Ferdowsi University of Mashhad's PE dataset) which consists of three-dimensional PE-CTA images of 35 different subjects with 8792 slices in total. For each benchmark image, two expert radiologists provided the ground-truth with the assistance of a semi-automated image processing software tool. FUMPE is a challenging benchmark for CAD methods because of the large number (i.e., 3438) of PE regions and, more especially, because of the location of most of them (i.e., 67%) in lung peripheral arteries. Moreover, due to the reporting of the Qanadli score for each PE-CTA image, FUMPE is the first public dataset which can be used for the analysis of mortality and morbidity risks associated with PE. We also report some complementary prognosis information for each subject.
Design Type(s) | observation design |
Measurement Type(s) | Pulmonary embolism |
Technology Type(s) | computed tomography scanner |
Factor Type(s) | diagnosis |
Sample Characteristic(s) | Homo sapiens • lung |
Machine-accessible metadata file describing the reported data (ISA-Tab format)
Background & Summary
Pulmonary embolism (PE) is a sudden blockage of a lung artery by a deep vein thrombosis (DVT) clot, typically originating in the pelvis veins and carried by the blood flow through the heart into the lung. Since it may reduce respiratory capability by pulmonary artery (PA) closure, early diagnosis and treatment of DVT can decrease the risk of PE.
However, once arterial obstruction exceeds 50% of the cross-sectional area, massive PE may occur with acute and severe cardiopulmonary failure because of right ventricular overload. It was reported that 70% of patients died within the first hour after onset of the above symptoms. Therefore, early and precise diagnosis of PE is important, due to the high morbidity and mortality risk1,2.
Contrast-enhanced computed tomography (called CT angiography or CTA) images have been widely used for PE diagnosis3–5 because of their suitable lesion discrimination in blood vessels6. Specifically, PE regions appear as dark spots among the bright regions of blood arteries in CTA images7. The radiologist should record the CTA image in a suitable time interval after injection of the contrast material and before its traveling from the arteries to the veins. In this case, although the vein and PE regions may have similar gray-levels in the CTA image, the latter can be distinguished from the former by its higher contrast. Nevertheless, lymphatic tissue, parenchymal disease, and partial volume effect may also provide similar dark regions (especially, on artery boundaries) in CTA images8. This is why the manual delineation of PE regions is a time consuming task and depends on the expert insight9.
In recent years, by progressing computing and computational technologies, computer-aided detection (CAD) systems have gained increasing impact in clinical and research applications5. However, due to the above challenges, automated/semi-automated detection of PE, still, is a challenging endeavor for radiologists, physicians, and biomedical engineers. These groups are unable to precisely evaluate and compare their results with each other, due to the lack of a proper dataset of PE-CTA images with suitable ground-truth, evaluation scores, and prognosis information. To tackle this problem, some researchers have generated private datasets, which are not widely shared4,8,10. Recently, Madrid-MIT M+Visión Consortium11 supplied a public dataset of 20 PE-CTA images with ground-truth. However, they reported neither the clinical information of subjects nor, evaluation scores of PE-CTA images.
In this paper, we present a new dataset of three dimensional (3D) PE-CTA images, called FUMPE (standing for Ferdowsi University of Mashhad's PE dataset), for computer-aided detection with research and education purposes. It includes 35 PE-CTA images with a total of 8792 slices. Furthermore, an expert radiologistmanually and precisely delineated the PE regions in every slice of each CTA image as the ground-truth. We took advantage of a semi-automated software tool to enhance the segmentation results. The final PE regions were re-examined by another expert radiologist. In addition, for further evaluation, the first radiologistprovided five CTA measurements for every benchmark image.
Methods
We primarily obtained ethical approval of the ethics committee of Mashhad University of Medical Sciences. Although all images have been anonymously published in the proposed dataset to avoid the risk of privacy breach, we got a signed informed consent from every patient. As shown in Fig. 1, the development process of the proposed dataset consists of contrast material injection, image acquisition, image selection, image segmentation, and Qanadli scoring, as comprehensively stated in the sequel.

Five steps of the development process of the proposed dataset.
Contrast material injection
In a normal PE-CTA, the pulmonary arteries should be full of the contrast material while the aorta should be empty of it. Therefore, a total of 70-100 mL of non-ionic contrast material (containing 300-370 milligrams of iodine per milliliter) was injected into the right antecubital vein by using gauge-18 or -16 catheters (with the flow of 4-5 mm per second) at 10-12 seconds before imaging.
Prognosis symptoms
To collect the FUMPE dataset, 400 PE-CTA images were primarily recorded from different patients. The most-common patient-complaints were dyspnea, tachypnea, and pleuritic chest pain with haemoptysis. Moreover, some patients had non-specific signs and symptoms, such as tachycardia, palpitations, wheezing, and cough. However, patients with massive PE had hypotension, extreme hypoxemia, cyanosis, syncope, or even cardiac arrest. Furthermore, for non-urgent patients, the DVT test was performed.
Imaging
CT-scanning was performed in Emam-Reza and Ghaem Medical Centers (http://quaem.mums.ac.ir/index.php/en) by using the NeuViz 16 multi–slice helical CT scanners of Philips and Neusoft Medical System Co., Ltd with 120 kVp, 0.75 mm × 16 collimation, the gantry rotation time of 0.75 s, and a beam-pitch of 1.2. Also, in order to automatically adjust the tube current, scanners took advantages of both the dose modulation and angular/longitudinal tube-current modulation (with automatic current selection) for all subjects except Patient21. The range of the tube current variations for each subject was reported in Table 1. All PE-CTA images of FUMPE were acquired in one breath hold with:
-
slice-thickness≤1mm (except for Patient24 and Patient32 with slice-thickness=2mm)
-
slice-interval≤1.5 (except for Patient03, Patient10, and Patient28 with slice-interval=4mm)
-
in the caudocranial direction (except for Patient12 and Patient13 with the craniocaudal direction)
Image selection
It was frequently demonstrated that CAD systems could better extract PE regions in the main arteries compared to the peripheral vessels, due to higher contrast and better discrimination8. Thus, a suitable benchmark dataset for evaluation of CAD systems should considerably include a large number of PE regions in the peripheral arteries. Therefore, from among all the recorded PE-CTA images, by visual inspection, we choose 35 images with the largest number of PE regions in peripheral arteries to make the proposed dataset.
Image segmentation
To establish the ground-truth, a board-certified radiologist (with over 5-year experience for PE-CTA analysis) primarily delineated all PE regions of interest (PE-ROIs) in each PE-CTA image. He also took advantage of a semi-automated software tool called MIS (standing for medical image segmenter) which supports the coronal and sagittal reconstructions (in addition to the original axial view) to ensure about delineation accuracy. Finally, the delineated PE-ROIs were re-examined and approved by the head of the radiology department (with 18-year experience) of Emam-Reza Medical Center (http://emamreza.mums.ac.ir/index.php/en).
Code availability
We developed the MIS software tool in the MATLAB R2017 environment. It consists of a GUI window in which the user can see a 3D DICOM image in the axial, coronal, and sagittal views. Also, the user can choose the region of interest in each slice by multiple mouse selections. The software took advantage of a semi-automated segmentation algorithm which consists of the thresholding and connected-component analysis steps12. It can determine the local connected region to a seed point, chosen by the user, through a gray-level similarity criterion. The source codes (in the MATLAB environment), compiled executable file, and pictorial user manual of MIS are publicly available in: https://doi.org/10.6084/m9.figshare.6289085 (with the Figshare Repository).
CTA measurements
We provided five measurements for each PE-CTA image, as follows:
-
RV/LV Ratio: The right ventricular (RV) failure is one of the most important causes of early death after PE13. CTA enables the radiologist to assess RV dysfunction by calculating the ratio of RV to left ventricular (LV) diameter (called RV/LV ratio) in the reconstructed four-chamber views.
-
Reflux into IVC: Reflux of the contrast material into the inferior vena cava (IVC), which can be observed in CTA images, is associated with right heart failure due to PE14.
-
Straight Septum & PA Diameter: Severe PE increases the right heart pressure. In this case, the interventricular septum may be abnormally shifted toward the left ventricle15; and also, the diameter of the main pulmonary artery (lateral to the ascending aorta and at the level of its bifurcation) may be increased16.
-
Q-score: After image segmentation, we assessed the arterial clots of each subject according to the Qanadli scoring system (Q-score). Generally, the Q-score is computed as the superposition where n indicates the total number of proximal clot sites and dk determines the obstruction index of the k-th one. In more detail, in the left lung, the upper, lingual, and lower lobar arteries are branched into three (apical, posterior, and anterior), two (superior and inferior), and five (superior, medial, lateral, posterior, and anterior) segments, respectively. Similarly, the lobar arteries of the right lung are also separated into 10 segments, in the same manner. Thus, as illustrated in Fig. 2, we totally have n=20 segments in both lungs. For the k-th segment (k=1,2,…,n), dk is set equal to 0, 1, and 2 for the clot-free, partial obstruction, and total occlusion situations, respectively17. Once there is an embolus in the most proximal arterial level, its corresponding index is computed as the superposition of the obstruction indices of all segmental arteries arising distally. For example, Fig. 2 illustrates the obstruction indices of all arterial segments in the left and right lungs of Patient16. The Q-score can be used for prognosis evaluation, treatment-reply, and determining the anti-coagulant treatment period18. Also, the patients with larger Q-scores than 18 have high mortality and morbidity rates19.
Figure 2: Sample Q-Score computation. 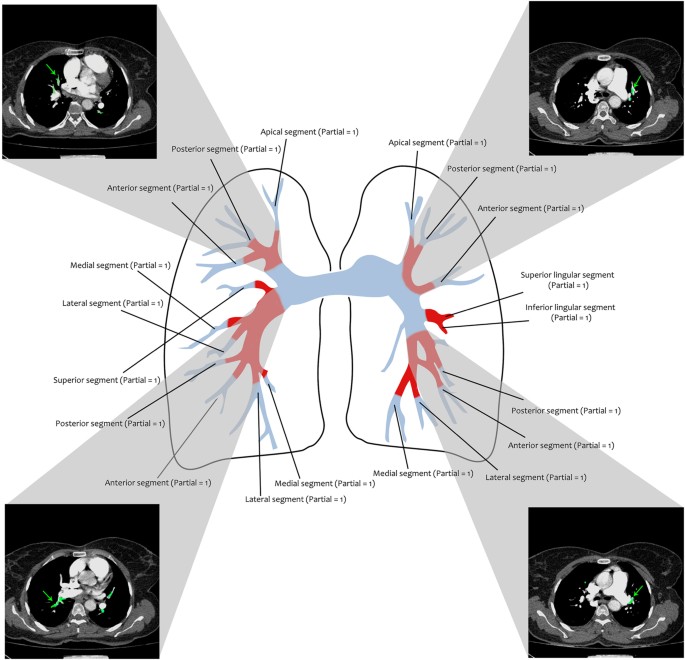
The arterial segments of the left and right lungs of Patient16 (used for Q-score computation) are illustrated as an example. The obstruction index of each segment is indicated in the figure. The total Q-score (i.e. 19) was computed as the superposition of all the obstruction indices.

Data Records
All data records described in this paper are available on the Figshare Repository, organized in 35 different patients (Patient01 to Patient35, Data Citation 1) and one ground-truth archive (Ground Truth, Data Citation 1). Each patient archive includes all slices of the corresponding 3D CTA image (stored in the DICOM file format) while the ground-truth archive consists of all the 3D ground-truth images of FUMPE in the MAT file format. MAT files can be simply loaded to the MATLAB programming environment by using the function load. In every ground-truth image, the foreground and background voxels were indicated by the gray-levels 1 and 0, respectively.
Technical Validation
Each image was visually checked by an experienced CT technologist to be artifact-free and have sufficient contrast for image analysis. If the image quality was not acceptable, he repeated the image acquisition process.
Summary of the dataset
Table 1 reports the characteristics of all CTA images of the proposed dataset including the subject gender and age, DVT test, slice thickness and interval, range of the tube current, imaging direction, number of slices, number of PE regions in the main arteries, and that in the peripheral arteries. FUMPE includes the PE-CTA images of 17 male and 18 female patients (aged 24-82 years). In addition, from among all FUMPE images (with totally 8792 slices), only Patient24 and Patient32 have no PE-clots (false positives) in both the main and peripheral arteries.
For example, Fig. 3 illustrates the source and ground-truth images of the 77th, 80th, 106th, 116th, 119th, 133th, 139th, and 151th slices of Patient16. Note that here, all PE regions of the ground-truth were indicated by the semi-transparent green color over the source image for better visual inspection. Also, the size of PE regions was significantly various from few to hundreds of voxels.

Including the source (left-hand side in each pair) and ground-truth (right-hand side in the same pair) images corresponding to the (a) 77th, (b) 80th, (c) 106th, (d) 116th, (e) 119th, (f) 133th, (g) 139th, and (h) 151th slices of Patient16.
For every ground-truth image of the dataset, we counted the number of PE regions in the main and peripheral arteries. As reported in Table 1, the proposed dataset totally includes 3438 PE-ROIs; such that most of them (i.e. 67%) are located in the peripheral arteries. Therefore, FUMPE is a challenging benchmark for evaluation of CAD systems.
Finally, Table 2 reports the five specified CTA measurements (including RV/LV ratio, Reflux into IVC, straight septum, PA diameter, and Q-score) for all FUMPE images. As further illustrated in Fig. 4-scores were ranged from 0 to 31. Also, the most frequent Q-scores were 20, 7, and 3, with the abundance of 5, 4, and 3 subjects, respectively. Moreover, 11 patients, with larger Q-scores than 18, had high mortality/morbidity risk.

The Q-score histogram of FUMPE.
Comparing with other PE datasets
As shown in Table 3, FUMPE is further compared with 14 PE-CTA datasets reported in3–5,8,10,11,20–27. All the counterpart datasets, except m+visión11, are private (i.e. with non-public accessibility). Clearly, FUMPE includes a large number of PE-ROIs compared to the other datasets. Furthermore, it is the first public PE dataset with the Q-score evaluation, which can be used for development of automatic scoring algorithms and medical education purposes. It is also the only dataset which provides appropriate complementary prognosis information such as DVT test, RV/LV ratio, reflux into IVC, straight septum, and PA diameter.
Additional information
How to cite this article: Masoudi, M. et al. A new dataset of computed-tomography angiography images for computer-aided detection of pulmonary embolism. Sci. Data 5:180180 doi: 10.1038/sdata.2018.178 (2018).
Publisher’s note: Springer Nature remains neutral with regard to jurisdictional claims in published maps and institutional affiliations.
References
References
Domingo, M. L., Martí-Bonmatí, L., Dosdá, R. & Pallardó, Y. Inter observer agreement in the diagnosis of pulmonary embolism with helical CT. European Journal of Radiology 34, 136–140 (2000).
Sadeghi, A. et al. Acute massive pulmonary embolism. Tex Heart Inst J. 32, 430–433 (2005).
Buhmann, S. et al. Clinical evaluation of a computer-aided diagnosis (CAD) prototype for the detection of pulmonary embolism. Acad. Radiol. 14, 651–658 (2007).
Wittenberg, R. et al. Computed tomography pulmonary angiography in acute pulmonary embolism: the effect of a computer-assisted detection prototype used as a concurrent reader. Journal of Thoracic Imaging. 28, 315–321 (2013).
Özkan, H., Osman, O., Şahin, S. & Boz, A. F. A novel method for pulmonary embolism detection in CTA images. Computer Methods and Programs in Biomedicine. 113, 757–766 (2014).
Chan, H. P., Hadjiiski, L., Zhou, C. & Sahiner, B. Computer-aided diagnosis of lung cancer and pulmonary embolism in computed tomography-a review. Acad. Radiol. 15, 535–555 (2008).
Liang, J. & Bi, J. Computer aided detection of pulmonary embolism with tobogganing in CT angiography. 20th International Conference on Information Processing in Medical lmaging 630–641 (2007).
Bouma, H., Sonnemans, J. J., Vilanova, A. & Gerritsen, F. A. Automatic detection of pulmonary embolism in CTA images. IEEE Transactions on Medical Imaging. 28, 1223–1230 (2009).
Stein, P. D. et al. Multidetector computed tomography for acute pulmonary embolism. New England Journal of Medicine. 354, 2317–2327 (2006).
Park, S. C., Chapman, B. E. & Zheng, B. A multistage approach to improve performance of computer-aided detection of pulmonary embolisms depicted on CT images: preliminary investigation. IEEE Transactions on Biomedical Engineering 58, 1519–1527 (2011).
González, G. et al. CAD-PE Challengehttp://www.cad-pe.org/ (2012).
Gonzalez, R. C. & Woods, R. E. Digital Image Processing. 3rd ed, (Prentice Hall, 2008).
Wood, K. E. Major pulmonary embolism: review of a pathophysiologic approach to the golden hour of hemodynamically significant pulmonary embolism. Chest 121, 877–905 (2002).
Yeh, B. M. et al. Clinical relevance of retrograde inferior vena cava or hepatic vein opacification during contrast-enhanced ct. Am. J. Roentgenol 183, 1227–1232 (2004).
Oliver, T. B., Reid, J. H. & Murchison, J. T. Interventricular septal shift due to massive pulmonary embolism shown by CT pulmonary angiography: an old sign revisited. Thorax 53, 1092–1094 (1998).
Sanal, S. et al. Prediction of moderate or severe pulmonary hypertension by main pulmonary artery diameter and main pulmonary artery diameter/ascending aorta diameter in pulmonary embolism. Cardiology in Review 14, 213–214 (2006).
Qanadli, S. D. et al. New CT index to quantify arterial obstruction in pulmonary embolism: comparison with angiographic index and echocardiography. Am. J. Roentgenol 176, 1415–1420 (2001).
Hendriks, B. M. et al. Individually tailored contrast enhancement in CT pulmonary angiography. The British journal of radiology 89 (2016).
Araoz, P. A., Gotway, M. B., Harrington, J. R., Harmsen, W. S. & Mandrekar, J. N. Pulmonary embolism: prognostic CT findings. Radiology 242, 889–897 (2007).
Masutani, Y., MacMahon, H. & Doi, K. Computerized detection of pulmonary embolism in spiral CT angiography based on volumetric image analysis. IEEE Transactions on Medical Imaging. 21, 1517–1523 (2002).
Pichon, E., Novak, C. L., Kiraly, A. P. & Naidich, D. P. A novel method for pulmonary emboli visualization from high-resolution CT images. Proc. SPIE 5367, 161–170 (2004).
Das, M. et al. Computer-aided diagnosis of peripheral pulmonary emboli. Radiological Society of North America (RSNA) Program Book 5367, 351–352 (2003).
Digumarthy, S. et al. Computer-aided detection (CAD) of acute pulmonary emboli: evaluation in patients without signicant pulmonary disease. Proc. RSNA (2006).
Maizlin, Z. V., Vos, P. M., Godoy, M. B. & Cooperberg, P. L. Computer-aided detection of pulmonary embolism on CT angiography: initial experience. Journal of Thoracic Imaging. 22, 324–329 (2007).
Kiraly, A. P. et al. A comparison of 2D and 3D evaluation methods for pulmonary embolism detection in CT images. Proceedings of the SPIE. International Society for Optics and Photonics 6146 (2006).
Zhou, C. et al. Preliminary investigation of computer-aided detection of pulmonary embolism in three-dimensional computed tomography pulmonary angiography images. Acad. Radiol. 12, 782–792 (2005).
Tajbakhsh, N., Gotway, M. B. & Liang, J. Computer-aided pulmonary embolism detection using a novel vessel-aligned multi-planar image representation and convolutional neural networks. International Conference on Medical Image Computing and Computer-Assisted Intervention. Springer, Cham 62–69 (2015).
Data Citations
Masoudi, M. et al. Figshare https://doi.org/10.6084/m9.figshare.c.4107803 (2018)
Author information
Authors and Affiliations
Contributions
M.M. performed this research as a part of his MSc thesis. H.-R.P. designed the study as the research supervisor. M.S.-T. participated in image analysis and drafted the manuscript. N.E. and F.S.Z. participated in image segmentation and Qanadli scoring. M.P.R. approved the segmentation and Q-score results as the head of the radiology department.
Corresponding author
Ethics declarations
Competing interests
The authors declare no competing interests.
ISA-Tab metadata
Rights and permissions
Open Access This article is licensed under a Creative Commons Attribution 4.0 International License, which permits use, sharing, adaptation, distribution and reproduction in any medium or format, as long as you give appropriate credit to the original author(s) and the source, provide a link to the Creative Commons license, and indicate if changes were made. The images or other third party material in this article are included in the article’s Creative Commons license, unless indicated otherwise in a credit line to the material. If material is not included in the article’s Creative Commons license and your intended use is not permitted by statutory regulation or exceeds the permitted use, you will need to obtain permission directly from the copyright holder. To view a copy of this license, visit http://creativecommons.org/licenses/by/4.0/ The Creative Commons Public Domain Dedication waiver http://creativecommons.org/publicdomain/zero/1.0/ applies to the metadata files made available in this article.
About this article

Cite this article
Masoudi, M., Pourreza, HR., Saadatmand-Tarzjan, M. et al. A new dataset of computed-tomography angiography images for computer-aided detection of pulmonary embolism. Sci Data 5, 180180 (2018). https://doi.org/10.1038/sdata.2018.180
Received:
Accepted:
Published:
DOI: https://doi.org/10.1038/sdata.2018.180
This article is cited by
-
PE-Ynet: a novel attention-based multi-task model for pulmonary embolism detection using CT pulmonary angiography (CTPA) scan images
Physical and Engineering Sciences in Medicine (2024)
-
An Analysis of Deep Transfer Learning-Based Approaches for Prediction and Prognosis of Multiple Respiratory Diseases Using Pulmonary Images
Archives of Computational Methods in Engineering (2024)
-
Enhancing the detection of airway disease by applying deep learning and explainable artificial intelligence
Multimedia Tools and Applications (2024)
-
Pixel-level annotated dataset of computed tomography angiography images of acute pulmonary embolism
Scientific Data (2023)
-
Automated detection, segmentation and measurement of major vessels and the trachea in CT pulmonary angiography
Scientific Reports (2023)
