
Abstract
Globally, 1.6 billion people in rural regions face water scarcity. Expanding freshwater access via brackish groundwater desalination can provide additional resources to address this challenge. In this study, we have developed a time-variant electrodialysis reversal (EDR) technology that flexibly uses available solar energy for desalination. Our proposed photovoltaic-powered desalination system can vary pumping and EDR power to match the availability of intermittent solar power, maximizing the desalination rate. Our results show improved system performance with the direct use of 77% of available solar energy—91% more than in conventional systems—and a 92% reduction in battery reliance. In a village-scale desalination case study in India, these system improvements lead to a 22% reduction in water cost, making the technology competitive with the currently used on-grid, village-scale reverse osmosis systems that are mainly powered by fossil fuels. Future advances could further reduce costs, providing an improved, sustainable solution to water scarcity in remote areas.
Main
Providing affordable access to clean water on a global scale was set in the United Nations 2030 Agenda for Sustainable Development1. Recent surveys indicate that 17 countries that are home to a quarter of the world’s population face ‘extremely high’ water stress2. Water scarcity is particularly severe in developing countries and emerging markets such as India, the focus region for the present study.
Over two billion people depend on groundwater for drinking3, yet around 1.7 billion reside in areas with stressed groundwater supplies, notably in India and China4. Groundwater quality is further compromised by natural and human-induced salinization, turning much of it brackish or saline. Worldwide, 56% of groundwater is saline and unsuitable for consumption5. This issue is prevalent in India, where 60% of the land harbours brackish or saline water6. Consequently, there is a pressing need for affordable, efficient methods for the desalination of brackish underground water to mitigate water scarcity and groundwater depletion.
Reverse osmosis (RO) systems and electrodialysis (ED) or electrodialysis reversal (EDR) are two widely used techniques in brackish water desalination. RO uses pressure to force water through a polymer membrane, while its constitutive ions are blocked by the membrane. Unlike RO, an EDR module is made up of a stack of ion exchange membranes and uses an electric field to move ions from the diluate flow channels to the brine flow channels between each membrane (Fig. 1a). This electric field can be intermittently reversed to prevent the build-up of scale on the membrane, thus adding ‘R’ to EDR.

a, Schematic of a batch EDR module (right) and the typical EDR power consumption profile (left) repeated during each batch when a constant voltage and flow rate are applied. The voltage applied to the EDR stack drives ions across the ion exchange membranes from the diluate channels to the concentrate channels. b, Daily PV and EDR power profiles when solar panels are coupled to the EDR module in constant operation (top). The mismatch between the solar power and EDR power profiles requires a 6 kWh battery capacity (for a representative community-scale system) to discharge solar energy (bottom). The corresponding integrated flow into the battery during the day is shown in red. The x axis label in the bottom plot also applies to the top plot.
For village-scale systems, previous studies have shown that EDR has a lower specific energy consumption and a higher water recovery than RO for salinity levels of less than 5,000 mg l−1 (ref. 7), making it well suited to desalinating brackish groundwater. However, ED does not have the capital expenditure (CapEx) advantage of a mass-produced technology, the estimated market size of ED equipment being less than 6% of the RO market in 20198. ED/EDR contribute about 3% of the total desalinated water produced globally; 60% of this water is produced from brackish water, and 20% comes from rivers9.
Unreliable energy sources in the rural areas of developing countries complicate brackish groundwater desalination. The lack of access to energy resources hinders water scarcity solutions as electricity is crucial for most desalination methods. Renewable energy, particularly solar, has proven effective for the supply of energy for potable water provision in remote or off-grid locations10,11. With the substantial reductions in the cost of solar photovoltaic (PV; 82% reduction from 2010 to 2019 with an expected additional 55% drop by 2030)12,13, solar energy is increasingly viable for water-stressed regions.
However, solar desalination systems must address the intermittency of solar power, often managed by costly, high-maintenance batteries, posing challenges in resource-limited communities. EDR, more energy efficient and with higher water recovery than RO, is advantageous for renewable-powered desalination. Wright and Winter14 suggested that EDR could operate with half of the solar and battery capacity needed for a comparable PV-RO system, achieving up to 90% water recovery. In this context, we have developed a flexible EDR technology that adapts to the variability of solar energy, potentially reducing the costs for PV-EDR brackish water desalination systems.
Previous studies on solar-powered desalination examined both practical PV desalination systems and theoretical cases to evaluate their technical and economic viability across different locations. There are two main types of solar desalination system: direct-drive systems, which operate without energy storage, and integrated systems, which use energy storage. Research on direct-drive systems includes PV-RO15,16 and PV-EDR17, with Bilton et al.15 estimating the lowest cost of water for small-scale, batteryless PV-RO systems at US$2.17 m−3, excluding detailed costs such as piping and sensors. Research on solar desalination systems with energy storage has explored various technologies, such as pumped hydro18, compressed air19, hydrogen20, flow batteries21 and lithium-ion batteries22. These storage-integrated systems can surpass diesel-based desalination in terms of cost-effectiveness20,21,22 and offer benefits such as fresh water provision, grid stability and regional job creation18,19.
Unlike these previous two methods, which focus on solar power supply to address intermittency, researchers have also investigated ways to manage power consumption on the desalination side. The aim of their studies was to avoid the use of batteries, potentially leading to lower costs compared with energy storage-integrated solutions, and included load scheduling, allowing the operation of the system to vary from one day to another, for example, by implementing a simple on/off control rule where the system is turned on only under sufficient irradiance conditions23,24. In this case, a variable amount of product water is produced every day depending on the daily available solar energy. The problem of intermittency can also be addressed by optimally resizing the desalination load or by investigating hybrid solar and wind power to smooth the overall intermittent energy supply25. Bian et al.26 co-optimized the number of cell pairs in the EDR stack, the solar panel area, the battery capacity and the storage tank size for a small-scale brackish groundwater PV-EDR system. They showed that a 40% reduction in capital cost can be achieved compared with conventional design practices by combining load-scheduling and system-sizing insights.
These concepts of desalination flexibility have been taken one step further with methods to continuously vary the energy consumption of the desalination system. Atia and Fthenakis27 investigated the active control of input water salinity by mixing solutions with different salinities, and several other researchers28,29,30 investigated variable pump flow rate over time to accommodate variable solar and wind resources. In these studies, a control strategy was defined that maximizes both renewable energy use and water production31. However, this work was performed only with seawater RO systems, often on large scales; little research has been proposed to increase the flexibility of ED/EDR desalination. Our recent investigation of EDR technology for small-scale point-of-use applications has shown that actively controlling the voltage of the EDR stack can expand the EDR operation and increase desalination performance32.
The motivation of this study was to substantially reduce the water cost of PV-EDR brackish water desalination systems at a community scale by increasing the direct use of intermittent solar energy, thus reducing the dependence on batteries, with the purpose of greatly improving water access in remote areas. To this end, we have developed a novel PV-EDR technology that enables flexibility of the desalination load while guaranteeing a maximized water production at any solar irradiance level. We show experimentally that this improved performance can potentially lead to cost parity of PV-EDR brackish water desalination with the existing on-grid RO brackish water desalination systems currently used in rural India. Because India’s grid electricity is heavily dependent on fossil fuel-based generators (more than 75% of the country’s electricity generation was from fossil fuels in 202033), PV-EDR could help to notably reduce carbon emissions while improving water security, especially in remote communities. This cost-competitive, low-emission, solar-powered brackish water desalination technology can also reduce water waste through increased recovery ratios and enable the independence of water supply from grid infrastructure for rural areas in India and other resource-constrained countries.
Flexible batch EDR
Conventional batch EDR systems, typically grid-operated with a fixed voltage and flow rate for energy efficiency, lack flexibility once powered by solar energy (Fig. 1). This rigidity leads to solar energy inefficiencies due to its weather-dependent, intermittent nature. Figure 1b shows the mismatch between the power profile of an EDR system, operated under ‘constant’ or ‘conventional’ operation, and available solar power. These mismatches require energy storage, particularly at the start and end of the day when solar power is low. This results in high battery costs and ‘oversized’ solar systems to compensate for low irradiance periods, as well as energy waste during peak solar times34.
To overcome these problems, we have developed a flexible batch EDR technology that incorporates a time-variant voltage and flow rate adjustment. A model-based control method enables the EDR system to align its power consumption with available solar power at each time step while optimizing water production under varying solar conditions.
Prototype PV-EDR system
A prototype PV-EDR system was built and tested at the Brackish Groundwater National Desalination Research Facility (BGNDRF), Alamogordo, NM, United States. We designed and built a real-time monitoring and control architecture to implement flexible operation (Fig. 2). The specific hardware components used for these experiments are detailed in Supplementary Table 1. The architecture comprises:
-
A feed-forward, model-based main controller running in Python 3.6 in real time. It uses sensor readings (100 Hz sampling rate) and time-variant EDR control theory to compute the optimal pump flow rate (and the corresponding pump speed σ) and the EDR stack voltage V that maximizes the desalination rate and instantaneous use of solar energy every 3 s.
-
A programmable logic controller (PLC) communicating with the main controller, sending sensor readings and receiving optimal values for V and σ with the system control hardware, sending analogue control signals for V and σ, and sampling analogue signals from sensors.
-
A pyranometer located at the centre of the solar array that senses the incoming irradiance on the solar array and is calibrated to convert the irradiance into the generated electrical power.
-
Four inline probes detect the diluate and brine conductivities at the inlet and outlet of the EDR stack.
-
A programmable DC power supply that supplies the voltage V dictated by the PLC signal to the EDR stack using an internal feedback control loop.
-
Two variable frequency drives (VFDs) that control the motor speed of two high-speed pumps with an internal feedback control loop using the PLC signal as reference. The curves of the two pumps at different speeds can be experimentally measured to build relationships between the pump speed, flow rate and c. The experimentally fitted pump curves can then be used in the model-based control.

The architecture implements in real time the optimal control strategy created to vary the EDR stack voltage and pump flow rate. Details of the hardware components (brand and model) are presented in Supplementary Table 1. The symbols C, V and Q represent conductivity sensors, voltage sensors and flow rate sensors, respectively.
The experimental system (Table 1) closely reflects the typical design parameters and operational conditions for a community-scale PV-EDR system sized to produce 6 m3 freshwater per day26,34. Real groundwater available in the BGNDRF from well number 1 was used as feed water with an average starting salinity of 970 mg l−1 (a detailed report of the water constituents is presented in Supplementary Table 2). This pilot system was built with a 20 kWh battery capacity, which is more than the capacity needed for constant operation according to the results of our simulations. This allowed us to seamlessly run tests in constant or flexible operation to compare their performance. A conservatively low recovery ratio of 60% was chosen for EDR (still higher than the 25–50% recovery reported for RO systems35) as the experimental set-up did not include an automated acid rinse to mitigate scaling in the brine channels.
Single day analysis
Figure 3 shows the single-day testing results of a full-scale PV-EDR pilot system, including the power profile of the solar power system and the power profiles of the prototype in both flexible and conventional operation, each producing the same quantity and quality of product water. The flexible strategy was tested for six full days in March 2019 under various weather conditions, representing a wide spectrum of daily input solar power profiles in terms of both the total solar energy available for the day and the variability of the solar power (see Fig. 4). The solar power available, the power consumption of the EDR system and the cumulative water production were recorded every 1 s for the duration of the operation (on average 8.9 h). As a benchmark, the system was also run for one day in conventional constant operation. Constant and flexible operations could not be run on the same day (as we had only one EDR desalination system); however, in constant operation, the same voltage and flow rate were used for each batch, and thus each batch exhibits the same power consumption pattern. The power consumption profile to achieve a given number of batches is independent of the shape of the input solar power, and therefore single batch data can be extended to multiple batches and compared with flexible operation on any day.

Experimental results from two single day tests on a full-scale PV-EDR pilot system under flexible and constant operation in New Mexico. The flexible and constant operation tests were performed on 17 and 11 March 2019, respectively. Raw solar power data were extrapolated to a complete common full day (see Supplementary Table 3 for details). The difference between generated and consumed power over time was analysed to derive the integrated power flow into batteries, the minimum battery capacity required by a real installation to produce the desired water demand and the corresponding state of charge (SOC). The power profiles and SOC of batteries in the flexibly operated PV-EDR are shown in the first two figures on the top. The power profiles and SOC of batteries in the constantly operated PV-EDR are shown in the last two figures at the bottom. The x axis applies to all plots.
Figure 3 shows that on the day of the experiment, the power consumption of the flexible system closely follows the variable solar power during EDR desalination. This close agreement contributes to the increased level of power use compared with the conventional EDR system, which maintains a consistently low power profile throughout the day. Between batches, the recirculation tanks were drained and refilled, when the water pumps were controlled. At the beginning and end of the day, the power consumption of the flexible system is nearly identical to the measured solar power. In the middle of the day, when the available solar power is high, the power consumption deviates slightly below the measured solar power as each batch progresses. These deviations reflect times when the EDR system has reached the maximum voltage and/or flow rate constraints of the system’s hardware. Within a batch during solar peak generation, this deviation between the desalination load and the solar energy tends to occur more as the batch progresses and the limiting current density decreases at the maximum flow rate.
The specific energy consumption (SEC) of the flexible EDR batches (3.3 ± 0.17 kWh m−3 on average over the 15 flexible EDR batches measured experimentally over a day) is about 40% higher than the SEC of the constant EDR batches (2.4 ± 0.12 kWh m−3 on average over the eight constant EDR batches measured experimentally over a day). However, SEC may not be the only factor that can be used to assess the energy efficiency of desalination, particularly when solar energy generation is considered as the energy input. In conventional PV-EDR systems, a lot of solar energy is wasted when the PV panels produce more electrical power than the system can accept, even though the conventionally defined SEC (which does not consider ‘wasted’ solar energy) is low. In contrast, the flexible EDR system can use the ‘wasted’ solar energy that cannot be harnessed by conventional constant EDR systems, thus producing more water for a given capital cost investment in a solar power system. For these reasons, the Cost analysis uses monetary costs to compare system architectures, providing a single metric to capture the capital and operational costs associated with energy and the effective cost of wasted energy. Therefore, the flexible system can directly use much more of the available solar energy than the conventional system (75% versus 40%). This significant increase demonstrates that the flexible controller is able to substantially improve the productive use of the system’s solar generation capacity in real hardware and environmental conditions.
These experimental results also indicate that the field-tested PV-EDR system reached its operational boundaries during flexible operation, subject to the system’s limitations in maximum power consumption (this can be seen by the gaps between the power consumption and the solar supply during batches in the middle of the day). These operations reached the maximum voltage and flow rates that were allowed for the PV-EDR prototype. In other words, the results in Fig. 3 represent the full operational range of the prototype PV-EDR system, from the minimum power level (for example, start-up from the shut-down status) to the maximum power level with the highest voltage and flow rate applied. As this full operational range was demonstrated experimentally in the field, we considered and used the same performance parameters in a further cost analysis when the system was simulated using varying solar energy throughout the seasons (see Cost analysis for further details).
As shown in Fig. 3, there are periods of relatively poor power use between batches when there are drain and fill events for both flexible and conventionally operated systems. During these periods, the time-variant controller has only one degree of freedom to control the power consumption of the system, the pump flow rate, which is limited by the maximum operating range of the pump. At most times of day, operating the pump at its maximum flow rate requires much less power than the solar power available, limiting the controller’s ability to satisfy the power constraint (equation (1) in Methods).
The duration of the drain and fill events relative to desalination can be controlled and potentially optimized to further maximize power use. Reducing the batch volume would decrease the duration of each drain and fill event, although the total number of these events would increase because more batches would be required to achieve the same volume of product water. Another solution to reduce the duration of the drain and fill events is to use larger pumps operating at increased flow rates. Larger pumps would also allow the power consumption of the flexible system to match the available solar power more closely during the EDR process in the middle of the day. However, larger pumps have higher capital costs. A comprehensive techno-economic model of the PV-EDR system is needed to fully weigh these complex trade-offs.
The impact of flexible operation on battery capacity is apparent in the integrated energy flow to the batteries, shown for both flexible and conventional operation in Fig. 3. The flexible system requires an almost negligible amount of energy from the batteries to operate throughout the day (0.11 kWh), corresponding to 3% of the battery capacity required by the conventional system (3.7 kWh). The small amount of energy required by the flexible system is needed to address the brief power overshoots at the start of each batch. These brief power overshoots reflect a limitation of the controller in predicting the current at the very beginning of a batch, as described by He et al.34. As the controller underestimates the power demand, it attempts to make full use of the available solar power by increasing the voltage and flow rate, resulting in a spike in power consumption. Despite these spikes, the required battery capacity is minimal compared with the conventional system design. To produce the same volume of water as the flexible system, the conventional system requires significant amounts of stored energy at both the beginning and end of the day. This difference in battery capacity can lead to significant differences in both the capital cost and the periodic replacement costs of PV-EDR systems.
Figure 3 also clearly shows the difference in the total operating time required for the flexible and conventional systems. On the day represented, the flexible system was able to produce as much water as the conventional system in 33% less time, or in a total operating time of about 10.8 h. This measured time saving is substantial and could reduce the labour and overhead costs of operation.
Performance over multiple days
The single day analysis was replicated over 6 days of operation, and the results are summarized in Fig. 4. Figure 4a demonstrates the range of solar irradiance profiles tested and the total volume of water produced by the flexible PV-EDR system on each day. During the 6 days, the prototype experienced a wide range of solar conditions, including days with rapid variations due to cloud cover as well as sunny days with minimal variation. On each day, the system was able to deliver the target production volume of ~6 m3. This demonstrates the ability of the control strategy to reliably deliver the desired level of performance under various solar conditions.

a, Experimental daily water production (blue bars) achieved for six different solar power profiles (green). b, Statistical analysis of daily PV power generation (green bars) and PV power variability (blue triangles). The six experiments represent a wide range of PV energy and PV output variability. The data points in b correspond to the solar power profiles shown in a. The bars represent the mean values and the error bars show the standard deviation (SD). The number of data points (that is, the solar power) measured over 6 days (n) are shown above the bars. c, Fraction of solar energy directly used in both flexible (F) and constant (C) operation over 6 days. Regarding the constant operation during the 6 days, the same daily energy consumption data (measured in the field) were used for all 6 days because the constant EDR operation does not change in the conventional operation. d, Minimum battery capacity needed to achieve the same daily production in flexible and constant operation. Flexible operation requires on average less than 10% of the battery capacity needed for constant operation. e, Daily operation time for flexible and constant operation. In c–e, the bars represent the mean values with the error bars showing the SD. The corresponding data points (n = 6) are shown as black dots. The experiments were run at BGNDRF between 12 and 21 March 2019. The experimental data collected on a daily basis are presented in Supplementary Table 3.
The solar profiles are further statistically characterized in Fig. 4b, which presents the mean solar power, the standard deviations of the solar power profile and the PV power variability metric, as defined by Hoff and Perez36. The PV power variability metric reflects the magnitude of the rate of change in PV power, with a higher variability indicating a more challenging test environment for the controller. Rapid changes in solar irradiance could potentially cause the controller to demand too little or too much power compared with the available power, negatively affecting either the energy use or the battery capacity required to operate. However, Fig. 4c,d shows that the variation in energy use and minimum required battery capacity in the flexible system is relatively small over the 6 test days, despite the relatively high variation in total solar energy (28% of the maximum value) and PV power variability (75% of the maximum value). This suggests that the benefits of flexible operation are robust across both more and less challenging solar conditions.
The average performance of the flexible system for 6 days is compared with the conventional system in three key metrics in Fig. 4c–e. Figure 4c shows that the flexible system is able to directly use 77% of the available solar energy on average compared with only ~40% in the conventional system (a 91% increase). This suggests that a conventional system would require much more solar panel area to operate directly (that is, without any energy storage), increasing capital costs.
Conversely, Fig. 4d presents the average minimum battery capacity required to operate each system using the same solar panel area; in this case, the flexible system requires only 0.27 kWh on average compared with 3.3 kWh for the conventional system (a 92% reduction). This significant difference could translate into a large saving in capital costs due to the relatively high cost of battery storage. The standard deviation of the minimum battery capacity required for the conventional system is also quite large. To ensure reliable operation, the battery capacity would have to be set towards the top of this range to operate under the poorest solar conditions, further adding to the capital cost. Finally, Fig. 4e shows that the flexible system can reach its production volume up to 54% faster than the conventional system.
Cost analysis
Making the desalination load flexible could lead to a significant improvement in the economics of water treatment. By minimizing the required battery capacity, the capital expenditure and maintenance costs (including hardware replacement) of the PV-EDR system can be considerably reduced. The reduction in daily operating time also lowers the operating cost. Therefore, we next examined the impact of shifting from constant to flexible operation on the levelized cost of water (LCOW) using a rural village in India (Chelluru, near Hyderabad) as a case study.
Using a simplified model (Supplementary Information 1.4) to simulate the batch-wise performance of flexible operations, we optimized the system design of flexible-operated EDR systems. We compared the result with the cost of implementing conventional commercial RO on the grid for groundwater desalination in the same context and explain the high potential of flexible EDR technology to improve clean water access in remote areas.
The LCOW in US dollars per cubic metre is a measure of the full cost of building and operating a system over its lifetime, scaled by the total water production. The LCOW or unit product cost of water combines capital and operating expenditures in a single indicator, measuring a system’s ability to treat and render usable water37. The LCOW is used to investigate the cost-optimal system design for a given technology and application. In this study, the LCOW was calculated over a 10-year period. Details of the cost model are presented in Methods.
Particle swarm optimization38 was selected to solve the optimization problem to minimize the LCOW of the PV-EDR system. It is a heuristic approach where a population of candidate particles (that is, design variables as shown in Table 2) is expected to evolve in the search space towards the least-cost configuration. Each particle’s movement is influenced by both its local best-known position and the best-known position in the search space so far. This algorithm is particularly suited to this non-convex optimization problem where both the objective function (in this study, the LCOW) and the feasible space of the design variables (for example, the PV panel area, the energy capacity of batteries, the volume of water tanks, the area of the electrodes, the number of membrane pairs and the selection of pumps and VFDs) have a complex, implicit dependency on the design variables.
To quantify the improvements enabled by flexible operation, we compared our flexible PV-EDR system with three other reference systems that have been field-tested for village-scale water applications in rural India34,39: two conventional PV-EDR systems (systems 1 and 2) in constant operation and a local commercial on-grid RO system (system 3). Below is a detailed description of how each of these systems would be designed to meet Chelluru’s daily water demand and the derivation of the corresponding LCOW. To guarantee a fair comparison with flexible operation, the two constant PV-EDR systems used the latest commercial EDR stack on the market40, which is the cheapest available EDR stack for small-scale operation.
-
1.
A conventional PV-EDR system as it would be installed in the field today. This system design was derived using the ‘rule-of-thumb’ design practices described by Bian et al.26.
-
2.
A state-of-the-art PV-EDR system reflecting the improvements realized by Bian et al.26, who optimized the PV-EDR system design for lowest capital cost.
-
3.
A commercial on-grid RO system sized for a 600 l h−1 production flow rate in continuous mode. The design parameters and component costs for this system were estimated on the basis of the current products manufactured by a local technology supplier41. Over 3,000 of these commercial-scale RO systems have been installed throughout India. We obtained the costs of the products from the local supplier. We estimate that this system produced freshwater at a LCOW of US$1.71 m−3 (Fig. 5c).The capital and operational costs for the EDR variants are normalized to those of the on-grid RO in Fig. 5a,b, respectively. The cost breakdown for the on-grid RO system is not reported to protect the proprietary information of the local supplier.
Fig. 5: Comparison of water costs between the proposed flexible PV-EDR and reference technologies. 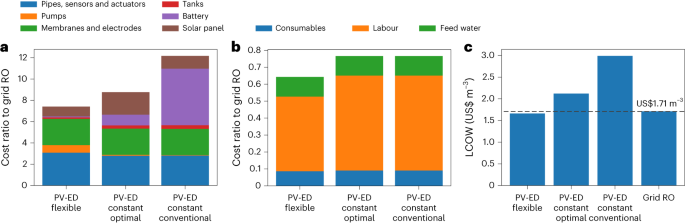
a–c, CapEx (a), operational expense (b) and LCOW (c) for a cost-optimal, flexible PV-EDR system compared with the three reference systems.

The optimized LCOW achieved by the proposed flexible PV-EDR system is US$1.66 m−3, which improves the cost by 22% compared with the current state-of-the-art PV-EDR system and by 46% compared with the conventional PV-EDR system. The detailed cost breakdown presented in Fig. 5 shows that these substantial reductions are achieved by using a reduced solar panel area, eliminating almost all battery capacity, and requiring less operator time and labour costs to achieve daily water production. The yearly time series of water production for the state-of-the-art, constant and flexible PV-EDR systems shown in Supplementary Fig. 4 illustrate the capacity of the flexible system to scale water production across the full range of solar power profiles. The amount of energy captured by the constant system is limited on days of high irradiance by its cost-optimal battery capacity.
Despite the additional expense required to implement flexible operation (more powerful pumps and power supply, VFDs), the capital cost of the flexible system remains lower than that of the constant systems due to the reductions in solar panel area and battery capacity. The cost of operating the flexible system is also lower than the cost of constant operation because the water production schedule is synchronized with solar hours and therefore requires the presence of an operator for only 11 hours instead of 14.5 hours in constant operation.
The flexible PV-EDR system achieves a critical milestone for off-grid water treatment systems: our results show that the flexible solar-powered PV-EDR system is cost-competitive with the on-grid RO systems currently commercialized in Indian villages. The capital cost of the PV-EDR system is higher than that of the on-grid RO module as the EDR module itself has a higher cost and the active control requires expensive dedicated hardware. However, the grid electricity required to power the RO system needs an additional US$0.36 m−3 operational cost. This brings the LCOW for on-grid RO to US$1.71 m−3, 3% above the LCOW of flexible PV-EDR.
Discussion
The demonstrated flexible PV-EDR technology could bring transformative improvements to freshwater supply in remote areas, both in the near and distant future. Regulations are evolving towards stricter brine disposal policies42 to limit the environmental impact of inland groundwater desalination. This evolution favours PV-EDR, as it produces substantially less waste water and carbon emissions compared with current village-scale desalination solutions. The cost benefits of EDR compared with RO for small-scale systems are even more significant when including the capital cost of installing evaporation ponds to manage brine. PV-EDR can achieve up to 90% recovery and therefore requires evaporation ponds for as little as 20% of the feed water volume, while conventional village-scale RO systems reject 60% of feed water on average15. If brine management costs are included, the LCOW of PV-EDR is 37% lower than the LCOW of on-grid RO systems (Supplementary Information 1.7). The high recovery ratio of EDR implies that its cost is relatively insensitive to brine management, ensuring that PV-EDR will have greater economic benefits compared to other solutions. It is very likely remaining an affordable option, whereas the cost of RO increases more rapidly than EDR due to the brine disposal expenses.
If PV-EDR systems become more widespread, their capital costs will probably decrease. This prediction is based on the experience of RO technology, which has rapidly developed in the past several decades43. Following its commercialization, RO saw a dramatic 94% reduction in membrane costs between 1975 and 200244, suggesting a similar potential for cost reductions in EDR membrane and electrode materials. This could lead to a lowering of the LCOW to below US$1.45 m−3. Additionally, advances in automation may further reduce the costs of sensors and controls. A projected 50% CapEx reduction over the next decade could allow PV-EDR systems to produce freshwater at a LCOW of around US$1.3 m−3, without brine management.
Despite its benefits, flexible PV-EDR technology faces challenges for its widespread adoption in rural communities. PV-EDR systems are expected to cost three to four times more than on-grid RO systems, posing affordability issues for lower-income rural Indian customers. The pay-as-you-go model, successful in commercial on-grid RO systems in rural India, could mitigate this by allowing manufacturers or operators to maintain ownership and spread costs over time, typically 10 years in India34,45. This model is financially viable, with system owners benefiting from both equipment production and water service provision. End-users would pay for only the water they use, potentially at rates comparable to or lower than RO-treated water. Public financing with zero or very low interest rates, such as the Government of India’s Jal Jeevan Mission with an investment of approximately US$12 billion by 2024, plays a crucial role in establishing rural water infrastructure, including solar-powered solutions46. Government support also encourages private investment through innovative financing structures47.
Other factors, such as membrane fouling, component degradation and geographic variations, will affect the long-term efficacy of the flexible PV-EDR technology. The current study’s limitation lies in its singular focus on a 6-day test with one type of brackish water in a single location. Despite this, the results affirm the system’s reduced battery dependence and overall feasibility, showcasing its full operational range. This includes varying levels of operation, from start-up to maximum power. The successful test under diverse weather conditions suggests the system’s adaptability to real-world scenarios. Future testing will expand to longer durations, different locations and varied feed salinities to further assess the technology’s robustness across diverse operational conditions and potential failure points.
We did not directly compare PV-EDR and PV-RO systems in this study. Previous research14 suggested that EDR, being more energy efficient at Indian groundwater salinities (1,000–5,000 mg l−1), could be more cost-effective than RO for off-grid applications; a PV-EDR system might need a smaller solar panel array than a PV-RO system, potentially halving the power system’s capital cost at a salinity of 2,000 mg l−1. Therefore, our comparisons focused on conventional EDR versus flexible EDR systems. The three systems we compared against the proposed flexible PV-EDR, namely, conventional PV-EDR, state-of-the-art PV-EDR and on-grid RO, have all been field-tested in rural India. There are limited test data for PV-RO systems in these areas, based on literature and field surveys. Studies in the literature focusing on other regions, primarily simulations, indicate that PV-RO costs for brackish water desalination are in the range of US$1.96–9.1 m−3, above our predicted LCOW for flexible PV-EDR (Fig. 5c). Further research and experimental testing are needed to assess the cost and performance of PV-RO in rural India, which is beyond the scope of this study.
Future PV-EDR research should explore varied conditions, such as changing feed water compositions, salinities and locations, especially in under-served remote areas in developing countries. This study’s cost analysis focused mainly on capital and some operational costs, omitting other expenses, such as land costs, provider profit margins and other project fees. Consequently, the actual cost of water to the customer may exceed our estimated LCOW. Nonetheless, our findings suggest that the proposed PV-EDR system could reduce costs, carbon emissions and brine discharge compared with current on-grid RO systems in rural India, enhancing water affordability and minimizing environmental impact. Future research should evaluate the advantages of desalination in various geographical areas, taking into account the diverse salinity levels and compositions of local water sources. This involves tailoring desalination processes to effectively use the region-specific solar energy resources, which vary according to the location.
Methods
Ethics statement
All of the collaborators of this study who have fulfilled the criteria for authorship required by Nature Portfolio journals have been included as authors, as their participation was essential for the design and implementation of the research. Roles and responsibilities were agreed among collaborators ahead of the research. This work includes findings that are locally relevant, and were determined in collaboration with local partners. Local and regional research relevant to our study was taken into account in citations.
Time-variant control theory
In conventional static operation, the constant voltage (V) applied to the electrodes of the EDR stack is chosen so that the current density (i) never exceeds a limiting value of the current density (ilim) at any point in the batch process. Above the threshold ilim, appreciable water splitting begins to occur in the ion-depleted boundary layers close to the membranes, reducing the transfer rate of ions and decreasing the overall desalination rate. The threshold ilim is proportional to the concentration of the diluate channel, which decreases over the course of the batch. Thus, as detailed in previous work32,48, the constant value of V is constrained throughout the entire batch by the lowest value of ilim, which occurs only at the end of the batch. As a result, for the majority of the batch process, V is lower than it should be to satisfy i(t) ≤ ilim(t), where t is the time. This inefficiency revealed an opportunity to maximize the desalination rate by continuously adjusting V to maintain i close to ilim at each time step32, known as variable voltage operation.
Taking the variable voltage theory one step further, we proposed to manipulate ilim by varying the flow rate (Q) at the same time. Manipulation of the limiting current density by controlling the flow rate leads to (1) higher ion-driven currents than the currents of the conventional constant operation, which can increase desalination rates, and (2) a considerably expanded operational range of batch EDR systems, creating flexible EDR systems that can directly use intermittent renewable energy (such as solar energy) over a wide range of power generation. As a consequence, a flexible EDR system can maximize the use of available solar power and reduce the inefficiency of solar energy use in conventional EDR systems.
Therefore, the proposed flexible EDR system needs to control both the voltage and flow rate simultaneously to maximize the desalination rate and the use of the available power. These conditions can be written as functions of the operating variables \({V}^{{\tau }_{i}}\) and \({Q}^{{\tau }_{i}}\) at the ith control time step τi:
Here, PED (W) and Ppumps (W) are the energy consumption of the ED stack and the pumps, respectively, Pavail (W) is the available power from the solar panel, and PED,max (W) and Ppumps,max (W) are the maximum ED power and pumping power, respectively.
An iterative strategy to solve equation (1) for \({V}^{{\tau }_{i}}\) and \({Q}^{{\tau }_{i}}\) at intervals of Δt is proposed to maximize the use of solar energy for water production. Using sensors, the controller measures the values of the available instant solar power (\({P}_{{\mathrm{avail}}}^{{\tau }_{i}}\)) and the diluate concentration at the outlet of the stack (\({C}_{{\mathrm{d}}}^{{\tau }_{i}}\)) as inputs for each time step (τi). This control theory has been implemented in a feed-forward controller that includes constraints to address hardware limitations of the power supply and pump (for example, maximum voltage and flow rate). Operating under this feed-forward control strategy is referred to as ‘flexible’ operation, reflecting that the system operating parameters are adjusted in real time to flexibly accommodate changing environmental conditions. Details of the models can be found in the Supplementary Information 1.7.
Cost modelling
A parametric model was created to predict the LCOW achieved by a given PV-EDR system. It combines an economic model of capital, operational and maintenance costs incurred by the water system operator with an assessment of the long-term reliable water production of the system (equation (2)). This model reflects the framework established by Bhojwani et al.37, where depreciation is taken as the lifetime of the system without salvage value.
where Ccapital (US$) is the system capital cost, Cmaintenance (US$) is the cost of replacing components with a lower lifetime than the system lifetime Tlife, coperational (US$ m−3) is the operational cost and Vrel (m3) is the daily volume of freshwater supplied. These costs can be broken up per component i (for example, solar panel). They depend on the unit cost Ci (for example, US$98 m−2 for the solar panel) and the corresponding system design Vari (for example, the area of the solar panel used in m2). These design variables include the area of the solar panel (Asol), the energy capacity of the batteries (Cbatt), the volume of the water tank (Vtank), the area of the electrodes used in the ED stack (Astack), the number of membrane pairs (NCP), and the selection of pumps, piping, sensors and control electronics. The maintenance cost depends on the number of replacements required (Ni) over the lifetime of the system (Tlife (h)). For example, solar panels last longer than Tlife, so in this study, Ni = 0. Thus, the maintenance cost is Ci × Vari × Ni.
For the operation cost, this study considered the labour cost of one operator per system at a unit rate (US$ h−1) that was costed with the operating hours for water production, the cost of the feed water (US$ m−3) and the cost of consumables, including filters (US$ month−1) and acid for brine dosing (US$ m−3).
The detailed parameters of this model (Table 2) have been informed by cost data collected in the field in India during a PV-EDR pilot in Chelluru in May 201734. The system is predicted to have a 10-year lifetime, which is a conservative estimate of the lifetime of the EDR membranes49. Moreover, this assumption facilitates a direct comparison with the LCOW of existing small-scale RO systems calculated over a 10-year period. The cost of brine management was not taken into account (in the results shown in Fig. 5) owing to the high uncertainty of the cost of an evaporation pond and because surface discharge of brine is typically practised in India. However, a preliminary investigation of the cost sensitivity of the PV-EDR system to brine management costs was developed in comparison with the on-grid RO system (Supplementary Information 1.8). All of the cost components used in the cost model are reported in Table 2.
Data availability
The data that underlie this study are available at https://doi.org/10.5281/zenodo.10581994.
References
UN Sustainable Development Goals. United Nations https://sdgs.un.org/goals (accessed 5 February 2024).
Updated global water risk atlas reveals top water-stressed countries and states. World Resources Institute (6 August 2019).
Jasechko, S. et al. Global aquifers dominated by fossil groundwaters but wells vulnerable to modern contamination. Nat. Geosci. 10, 425–429 (2017).
Gleeson, T., Wada, Y., Bierkens, M. F. & Van Beek, L. P. Water balance of global aquifers revealed by groundwater footprint. Nature 488, 197–200 (2012).
Gleick, P. H. et al. The World’s Water Volume 7: The Biennial Report on Freshwater Resources (Island Press, 2012).
Ground Water Quality in Shallow Aquifers of India (Central Ground Water Board, Government of India, 2010).
Sathre, R., Madhavi, S., Catena, M. & Baluswar, S. Technology Breakthough for Global Water Security: A Deep Dive into South Asia (ITT, 2018); https://transformativetechnologies.org/insights/water-security/technology-breakthroughs-for-global-water-security-a-deep-dive-into-south-asia/
Electrodialysis equipment market size to reach USD 390 million by 2024. Marketwatch https://www.marketwatch.com/press-release/electrodialysis-equipment-market-size-to-reach-usd-390-million-by-2024-2019-03-05/print (5 March 2019).
Jones, E., Qadir, M., van Vliet, M. T., Smakhtin, V. & Kang, S.-m The state of desalination and brine production: a global outlook. Sci. Total Environ. 657, 1343–1356 (2019).
D'Amato, V. A., Moeller, J. C. & Striano, E. Rethinking decentralized systems water management. Water Environ. Technol. 23, 62–66 (2011).
Luo, B. T. These 20 water-stressed countries have the most solar and wind potential. World Resources Institute (2018).
Renewable Power Generation Costs in 2019 (IRENA, 2020); https://www.irena.org/-/media/Files/IRENA/Agency/Publication/2020/Jun/IRENA_Power_Generation_Costs_2019.pdf
Taylor, M. Analysis shows wind and solar costs will continue to fall dramatically throughout the 2020s Energy Post (6 November 2020); https://energypost.eu/analysis-shows-wind-and-solar-costs-will-continue-to-fall-dramatically-throughout-the-2020s/
Wright, N. C. & Winter, A. G. Justification for community-scale photovoltaic-powered electrodialysis desalination systems for inland rural villages in India. Desalination 352, 82–91 (2014).
Bilton, A. M., Wiesman, R., Arif, A. F., Zubair, S. M. & Dubowsky, S. On the feasibility of community-scale photovoltaic-powered reverse osmosis desalination systems for remote locations. Renew. Energy 36, 3246–3256 (2011).
Bilton, A. M. A Modular Design Architecture for Application to Community-Scale Photovoltaic-Powered Reverse Osmosis Systems. PhD thesis, Massachusetts Institute of Technology (2013).
Abraham, T. & Luthra, A. Socio-economic and technical assessment of photovoltaic powered membrane desalination processes for India. Desalination 268, 238–248 (2011).
Slocum, A. H., Haji, M. N., Trimble, A. Z., Ferrara, M. & Ghaemsaidi, S. J. Integrated pumped hydro reverse osmosis systems. Sustain. Energy Technol. Assess. 18, 80–99 (2016).
Zhao, P. et al. The feasibility survey of an autonomous renewable seawater reverse osmosis system with underwater compressed air energy storage. Desalination 505, 114981 (2021).
Rezk, H. et al. Fuel cell as an effective energy storage in reverse osmosis desalination plant powered by photovoltaic system. Energy 175, 423–433 (2019).
Kotb, K. M. et al. A fuzzy decision-making model for optimal design of solar, wind, diesel-based RO desalination integrating flow-battery and pumped-hydro storage: case study in Baltim, Egypt. Energy Convers. Manage. 235, 113962 (2021).
Elmaadawy, K. et al. Optimal sizing and techno-enviro-economic feasibility assessment of large-scale reverse osmosis desalination powered with hybrid renewable energy sources. Energy Convers. Manage. 224, 113377 (2020).
Watson, S. et al. Advantages of operation flexibility and load sizing for PV-powered system design. Solar Energy 162, 132–139 (2018).
Kumarasamy, S., Narasimhan, S. & Narasimhan, S. Optimal operation of battery-less solar powered reverse osmosis plant for desalination. Desalination 375, 89–99 (2015).
Bourouni, K., Ben M’Barek, T. & Al Taee, A. Design and optimization of desalination reverse osmosis plants driven by renewable energies using genetic algorithms. Renew. Energy 36, 936–950 (2011).
Bian, D. W. et al. Optimization and design of a low-cost, village-scale, photovoltaic-powered, electrodialysis reversal desalination system for rural India. Desalination 452, 265–278 (2019).
Atia, A. A. & Fthenakis, V. Active-salinity-control reverse osmosis desalination as a flexible load resource. Desalination 468, 114062 (2019).
Thomson, M. & Infield, D. A photovoltaic-powered seawater reverse-osmosis system without batteries. Desalination 153, 1–8 (2003).
Singh, M. K. & Kekatos, V. Optimal scheduling of water distribution systems. IEEE Trans. Control Netw. Syst. 7, 711–723 (2020).
Kim, J. S., Chen, J. & Garcia, H. E. Modeling, control, and dynamic performance analysis of a reverse osmosis desalination plant integrated within hybrid energy systems. Energy 112, 52–66 (2016).
Miranda, M. S. & Infield, D. A wind-powered seawater reverse-osmosis system without batteries. Desalination 153, 9–16 (2003).
Shah, S. R., Walter, S. L. & Winter, A. G. Using feed-forward voltage-control to increase the ion removal rate during batch electrodialysis desalination of brackish water. Desalination 457, 62–74 (2019).
India Energy Outlook 2021 Ch. 1 (IEA, 2021); https://www.iea.org/reports/india-energy-outlook-2021/energy-in-india-today
He, W. et al. Field demonstration of a cost-optimized solar powered electrodialysis reversal desalination system in rural India. Desalination 476, 114217 (2020).
Nayar, K. G. et al. Feasibility study of an electrodialysis system for in-home water desalination in urban India. Dev. Eng. 2, 38–46 (2017).
Hoff, T. E. & Perez, R. Quantifying PV power output variability. Sol. Energy 84, 1782–1793 (2010).
Bhojwani, S., Topolski, K., Mukherjee, R., Sengupta, D. & El-Halwagi, M. M. Technology review and data analysis for cost assessment of water treatment systems. Sci. Total Environ. 651, 2749–2761 (2019).
Poli, R., Kennedy, J. & Blackwell, T. Particle swarm optimization. Swarm iIntell. 1, 33–57 (2007).
Wright, N. C. & Winter, A. G. Village-scale electrodialysis desalination: field trial validation. In International Design Engineering Technical Conferences and Computers and Information in Engineering Conference Vol. 58134, V02BT03A019 (American Society of Mechanical Engineers, 2017).
Electrodialysis reversal (EDR). Suez Water Technologies and Solutions https://www.watertechnologies.com/products/electrodialysis-reversal-edr (2022).
Water. Tata Projects https://www.tataprojects.com/sectors/water/ (2022).
Barron, O. et al. Feasibility assessment of desalination application in Australian traditional agriculture. Desalination 364, 33–45 (2015).
Amy, G. et al. Membrane-based seawater desalination: present and future prospects. Desalination 401, 16–21 (2017).
National Research Council Desalination: A National Perspective (National Academies Press, 2008).
Yadav, P., Heynen, A. P. & Palit, D. Pay-as-you-go financing: a model for viable and widespread deployment of solar home systems in rural India. Energy Sustain. Dev. 48, 139–153 (2019).
National rural drinking water mission. Press Information Bureau, Delhi (24 March 2022); https://pib.gov.in/PressReleasePage.aspx?PRID=1809209
Pories, L., Fonseca, C. & Delmon, V. Mobilising finance for WASH: getting the foundations right. Water 11, 2425 (2019).
He, W. et al. Voltage- and flow-controlled electrodialysis batch operation: flexible and optimized brackish water desalination. Desalination 500, 114837 (2021).
Singh, R. in Emerging Membrane Technology for Sustainable Water Treatment 135–162 (Elsevier, 2016).
Product price list. Automation Direct https://www.automationdirect.com/adc/pricelist/catalogrequest (accessed January 2024).
Acknowledgements
This work was supported by the US Bureau of Reclamation DWPR Program (R17AC00150 and R18AC00109), Tata Projects, Xylem Water Solutions and Water Technology, and the MIT Energy Initiative. We thank R. Shaw, D. Lucero and F. Nisino at BGNDRF for their technical support. We thank J. Costello, E. Brownell, N. C. Wright, R. Al-Rashed, S. R. Shah and S. L. Walter for building the pilot system presented in this work at BGNDRF and for their fruitful discussions on this research. I.M.P. and T.B acknowledge support from the National Research Foundation Singapore through the Singapore-MIT Alliance for Research and Technology’s ‘Low Energy Electronic Systems (LEES) IRG’. W.H. acknowledges support from the Royal Academy of Engineering Research (RAEng) through an Engineering Research for Development Fellowship (RF\201819\18\89).
Author information
Authors and Affiliations
Contributions
W.H. and A.G.W.V conceived the idea. W.H. and A.-C.L.H. developed the theoretical formalism, performed the analytical calculations, developed the model, implemented the controller on the hardware, conducted the experiments and analysed the experimental results. W.H., A.-C.L.H. and S.A. contributed to installing the testing system with instruments. W.H. and A.-C.L.H. contributed to the drafting of the paper. W.H., A.-C.L.H., S.A., A.G.W.V, I.M.P. and T.B. contributed to the editing and proofreading of the paper. A.G.W.V, S.A. and I.M.P. supervised the project. A.G.W.V, I.M.P., T.B. and W.H. contributed to the acquisition of funding.
Corresponding authors
Ethics declarations
Competing interests
A.-C.L.H., W.H., A.G.W. and I.M.P. are named inventors on patents related to this work. This IP will likely be licensed by members of A.G.W.’s group to start a company.
Peer review
Peer review information
Nature Water thanks Shane Walker and the other, anonymous, reviewer(s) for their contribution to the peer review of this work.
Additional information
Publisher’s note Springer Nature remains neutral with regard to jurisdictional claims in published maps and institutional affiliations.
Supplementary information
Supplementary Information
Supplementary Tables 1–4, Figs. 1–5 and Methods.
Rights and permissions
Open Access This article is licensed under a Creative Commons Attribution 4.0 International License, which permits use, sharing, adaptation, distribution and reproduction in any medium or format, as long as you give appropriate credit to the original author(s) and the source, provide a link to the Creative Commons licence, and indicate if changes were made. The images or other third party material in this article are included in the article’s Creative Commons licence, unless indicated otherwise in a credit line to the material. If material is not included in the article’s Creative Commons licence and your intended use is not permitted by statutory regulation or exceeds the permitted use, you will need to obtain permission directly from the copyright holder. To view a copy of this licence, visit http://creativecommons.org/licenses/by/4.0/.
About this article

Cite this article
He, W., Le Henaff, AC., Amrose, S. et al. Flexible batch electrodialysis for low-cost solar-powered brackish water desalination. Nat Water 2, 370–379 (2024). https://doi.org/10.1038/s44221-024-00213-w
Received:
Accepted:
Published:
Issue Date:
DOI: https://doi.org/10.1038/s44221-024-00213-w
