
Abstract
Globally, the largest tsunamigenic earthquakes have occurred along subduction zones. Devastating events exceeding magnitude 9, such as those in Chile, Sumatra, and Japan, struck in regions lacking instrumental records of similar events. Despite the absence of such events along the 1000-kilometer-long Mexican subduction zone, historical and geologic evidence suggests the occurrence of a magnitude 8.6 tsunamigenic earthquake. However, the Guerrero seismic gap has not experienced a high-magnitude earthquake in over 100 years. Here we present results on analyses of sediment grain size, geochemistry, microfossils, magnetic properties, and radiometric and optical stimulated luminescence dating conducted along the Guerrero coast. We provide evidence of a 2000-year history of large tsunamis triggered by potentially large earthquakes. Numerical modeling supports our findings, indicating a magnitude >8 event around the year 1300 in the Guerrero seismic gap. This evidence underscores the importance of assessing earthquake and tsunami potential using long-term evidence and instrumental observations along subduction zones globally.
Introduction
High-magnitude ( > 8 Mw) earthquakes and megaearthquakes ( ≥ 9 Mw) often occur along subduction zones, e.g., Chile in 1960, Sumatra in 2004, and Japan in 2011. The Guerrero seismic gap (GSG), an approximately 200 km-long part of the Mexican subduction zone (MSZ), is known for low seismic activity (Fig. 1a, b). A proposed plausible rupture of the entire gap could generate an earthquake of Mw = 8.41. An earthquake scenario of such magnitude would affect the Mexico City metropolitan area with more than 22 million people. A catastrophic tsunami accompanying this earthquake could cause considerable damage to coastal communities such as Acapulco, among others. Recent hypothesis suggest that the rheology on the GSG of the MSZ promotes slow slip over fast slip, with earthquake generation at the plate interface2. However, this hypothesis is based on an incomplete assessment of tsunamigenic earthquakes historically and in the late Holocene. Indeed, in other subduction zones, where initially the earthquake and tsunami hazard was underestimated, large earthquakes and tsunamis have occurred in the past leaving their signature in the geologic record and proving the tsunamigenic and earthquake potential of these subduction zones, such as the Japan3, Chile4, Sumatra5, and Cascadia6 subduction zones.

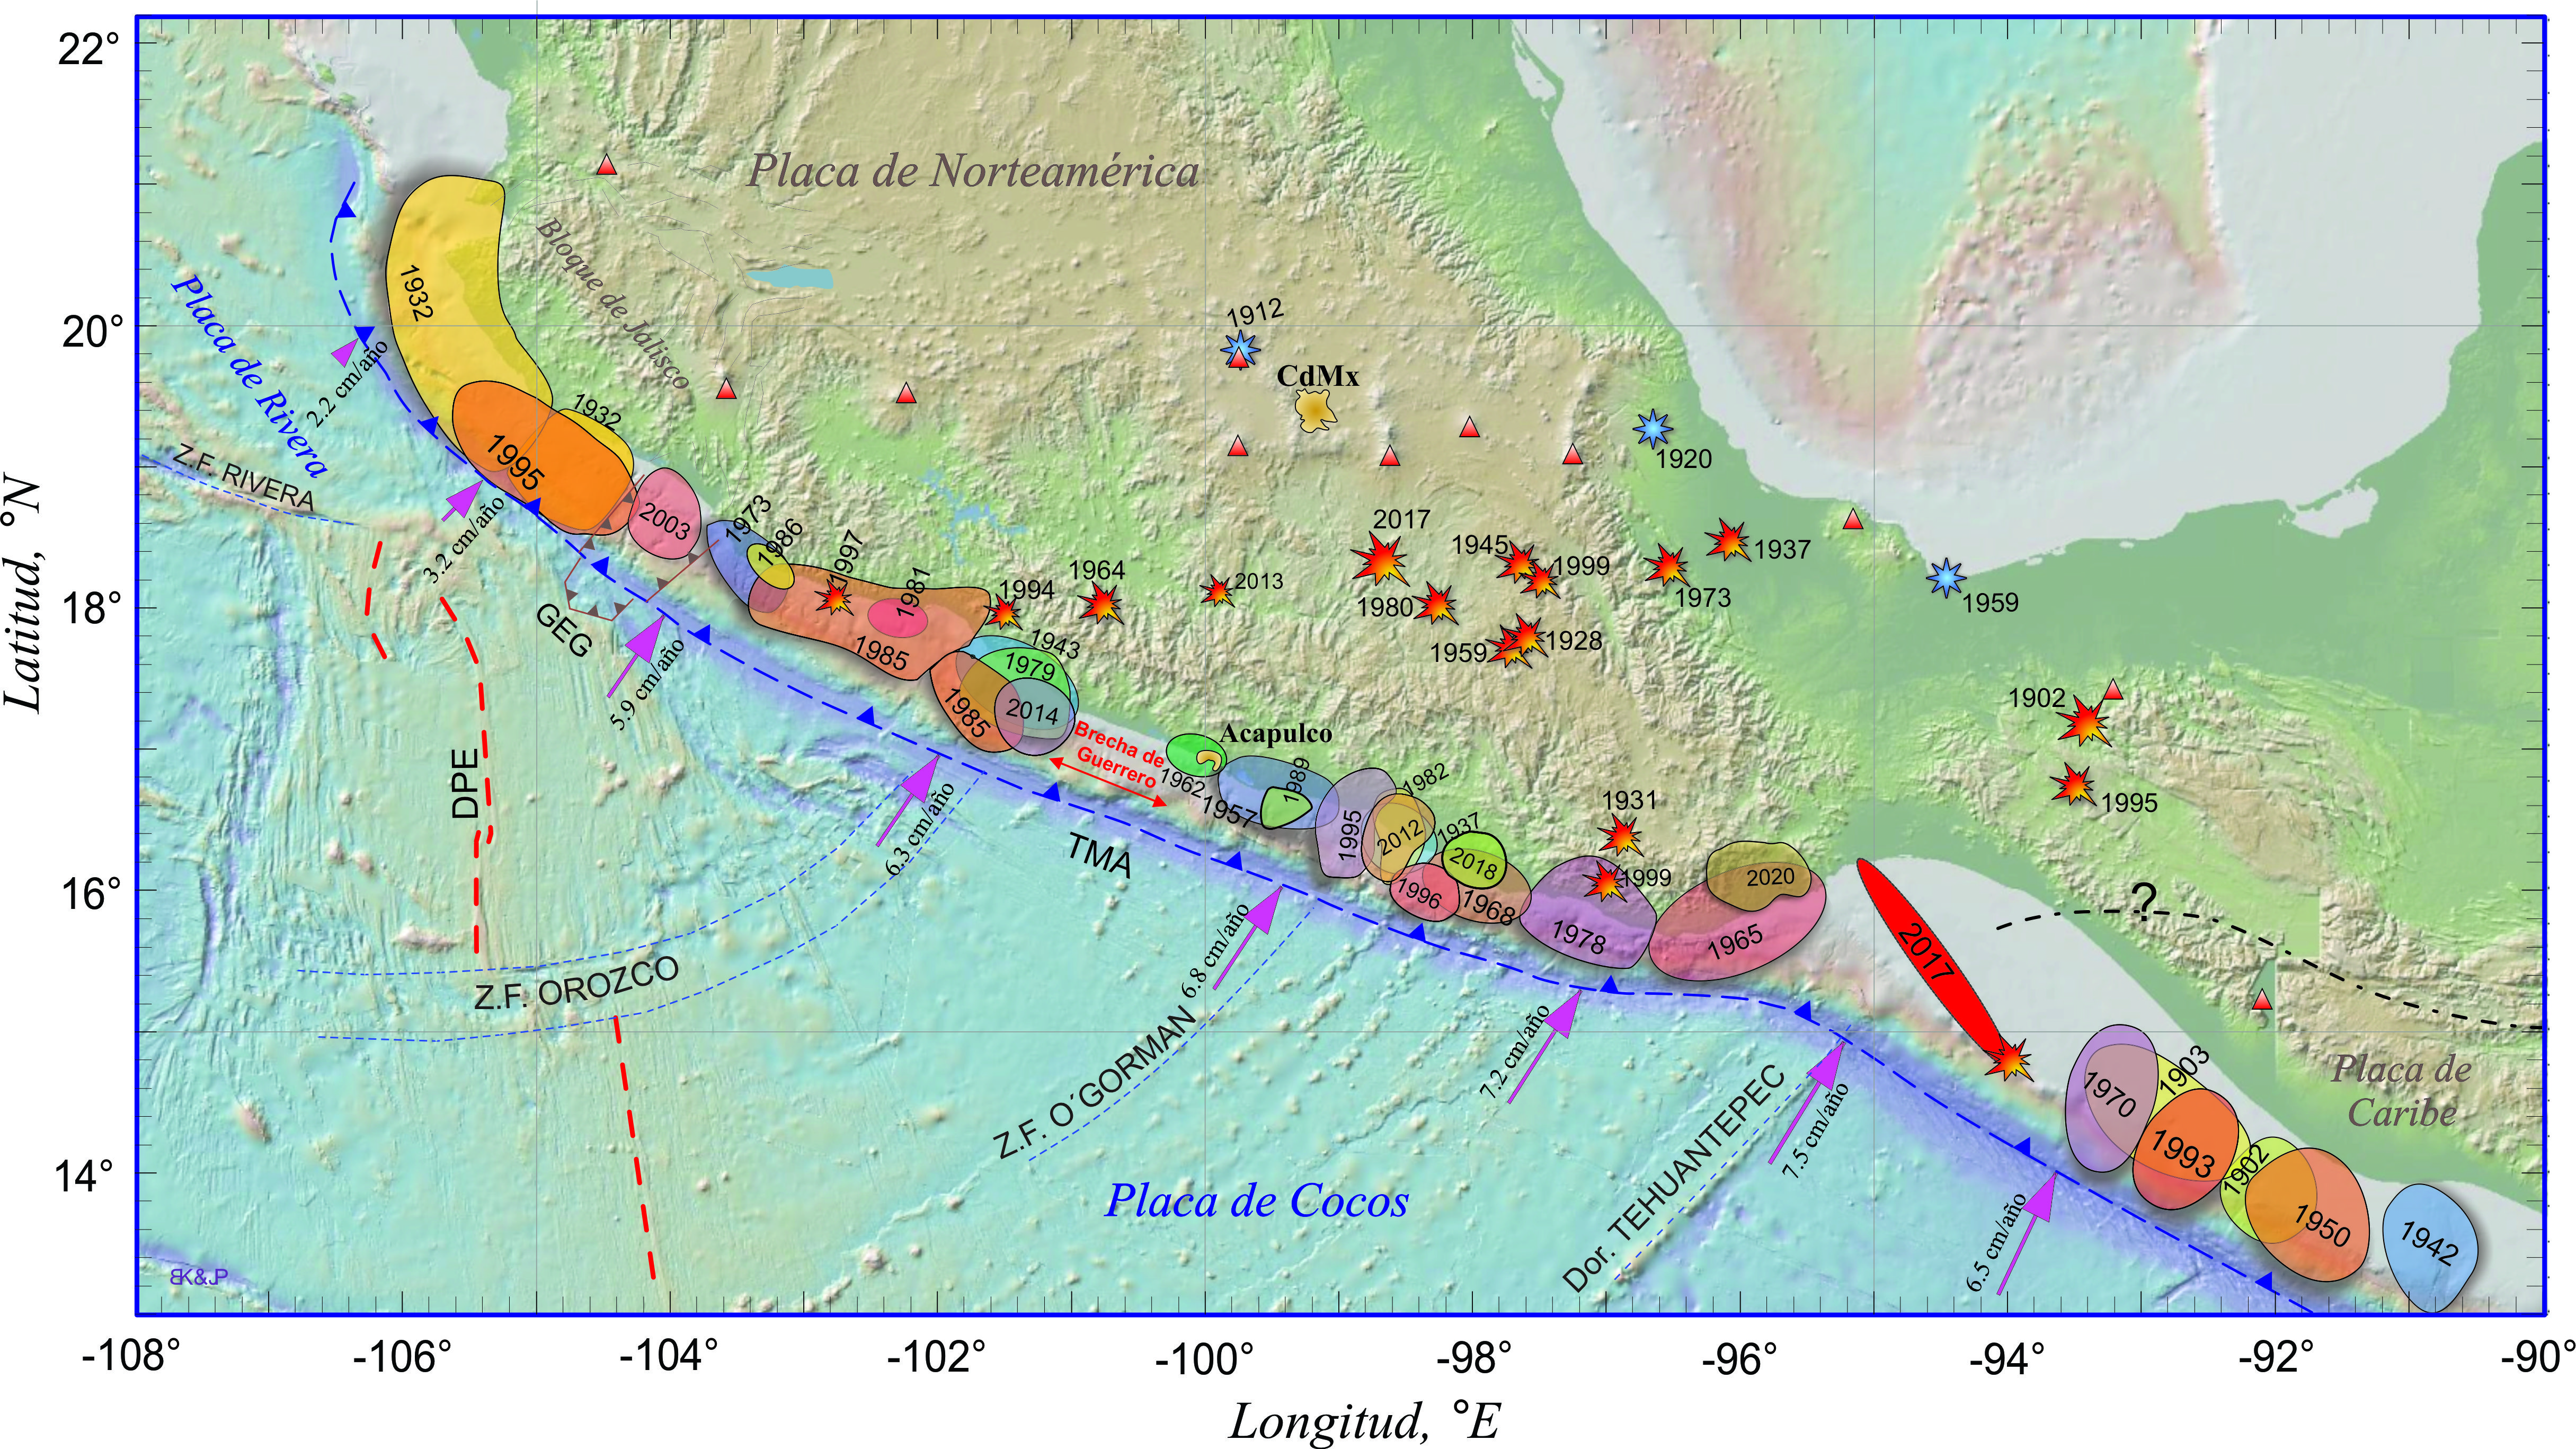
a Large earthquakes (M > 6.5) of the last century and rupture areas along the Mexican subduction zone, the image shows topographic roughness on the subducting Cocos plate, b Map shows surveyed sites 55 km alongshore the Guerrero seismic gap. Location of studied sites and two parallel transects of studied pits, c Detail of studied SSW-NNE transect of pits from pit 255 to pits A1 and A2 from the shoreline – inland on the Guerrero coast. Sources for Fig. 1 images and every element of these images come from: Base map - World Ocean Base provided by the Esri, Garmin, GEBCO, NOAA NGDC, and other contributors; for Fig. 1c, background aerial image - Google Earth and Maxar Technologies, 2023. Maps and every element of these maps were created by coauthors N. Corona and K. Gaidzik, using the software Adobe Illustrator and Corel; Fig. 1a. was built on ArcGis 10.8. Earthquake epicenters and historical rupture areas data source is available at https://usuarios.geofisica.unam.mx/vladimir/images/EQ_map_2013_es_clear.jpg.
Here, we present geologic evidence that reveals a ca. 2000-year history of large tsunamis and demonstrate that these tsunami events triggered by probable local earthquakes occurred in the past in the GSG, and modeling supports a Mw > 8 large tsunamigenic earthquake with a probable long and variable occurrence. Our data suggest a likelihood for their future occurrence.
Coastal and offshore morphology
The Guerrero seismic gap of the MSZ, between Acapulco and Petatlán (Fig. 1a), has been defined as a morphotectonic zone7 characterized onshore by a series of coastal lagoons, sand bars, beach ridges, alluvial plains, and rocky promontories8. The morphology offshore shows a narrow shelf, 7–12 km in width9, and a trench extending ~70 km from the coastline. Several morphologic features characterize the rough offshore topography, e.g., popped-up mountains, seamounts, ridges, and escarpments, which are associated in other regions with shallow megathrust earthquakes and tsunamis10,11. The coast near Acapulco is wave-dominated and microtidal, ranging from 0.6 m to −0.3 m12.
We focused on a low coastal alluvial plain in search for evidence of historical and prehistorical tsunamis and their triggering earthquakes (Fig. 1b, c). Previous studies infer late- and mid-Holocene earthquakes and associated tsunamis8,13. Here, we describe sites with excavations at a shoreline-normal transect (Fig. 1b, c), a total of 38 sites were examined (Fig. 2a and Supplementary Table S1), with a focus on the A1 and A2 sites. The A1 site is located on a lowland, covered by grasses, at the edge of an ancient estuary partially fringed by mangroves, and ~2 m above mean sea level (AMSL). Seaward, the landscape is represented by a series of beach ridges and swales, swamps, mangrove marshes, sand dunes up to 5 m, and a steep beach (Fig. 2a). Site A2 is located along the same transect as site A1 and in a similar geomorphic setting but with a slightly higher upslope (Fig. 2a).

a Topographic profile and Transect with sites 253 to A1 and A2 showing lab-based logged stratigraphy. Correlated sand units are marked with blue lines and dashed lines at the sites. Sand units 2, 3, 4, and 5 represent tsunami events of the last 2000 years (for dater refer to Supplementary Tables S2, S3, and S4). b Synoptic results of microfossil analyses for site A1. Colors indicate depositional environments. The relative abundance of diatoms is given as a percent of the total count. Yellow belts show inferred tsunami events correlated with A1 stratigraphic column corresponding to sand units 2, 3, 4, and 5. c Site A1 anisotropy of magnetic susceptibility (AMS), magnetic fabrics, and magnetic susceptibility plotted together with the stratigraphic column. Yellow belts show sand units 2, 3, 4, and 5 represent tsunami events. AMS Fabric I and III show flow direction and high energy flooding events – tsunamis.
Results and Discussion
Geologic evidence of large tsunamis and their probable local earthquakes
We discovered evidence for past large tsunamis and probable local earthquakes that provides a needed context to evaluate the potential for future equivalent events in this sector of the MSZ. The local geology and topography indicate that the study site is currently in an estuary at a distance of ∼800 m from the shoreline and 2 m above sea level (Fig. 2a), providing a higher preservation potential of tsunami deposits.
Three sand units are revealed by stratigraphic logs for sites 255, 248, 247, 246, 261, 256, 262, A1 and A2 and grain size analysis (Supplementary Fig. S1), and traces of them along the transect from the shoreline-inland at 9 sites (Fig. 1c), and at 25 sites alongshore ~55 km (Fig. 1b, c, Supplementary Table S1) that may be associated with past tsunami events. Sand unit 1 in log A2 (Fig. 2a) is apparently an artifact produced by landscape denudation from recent human activities and yields a near modern 14C age of 1989–1992 cal AD (Supplementary Tables S2–S4). Radiocarbon ages are inverted with depth and may reflect burrowing and bioturbation14. Sand unit 2 is observed at both the A1, A2, and all sites but site 253 (Fig. 2a), and contains unique taxa of marine diatoms that are absent in units above and below (Fig. 2b). These diatoms are not well preserved and are scarce, and laboratory procedures have been used to enhance diatom detection15. Furthermore, the elemental composition of this unit shows an increase in Na, Mg, Ca, Br, and Ba, indicating a marine influence (Supplementary Fig. S2). The clay unit below also shows abundant diatoms indicative of a brackish environment, while the clay with the sand unit above shows a significant decrease in brackish diatoms, from 60% to 10%, suggesting a land-level change, probably with coastal coseismic uplift (Fig. 2b).
The anisotropy of magnetic susceptibility (AMS) was used to characterize the sediment fabric, confirm the occurrence of a high-energy event, and reconstruct the flow characteristics of a suspected tsunami. AMS results show magnetic fabric (MF I) with a considerable degree of anisotropy P and anomalous orientation of K1 (not perpendicular to the shoreline) in sand unit 2 (Fig. 2c), suggesting deposition in a high-energy environment during a tsunami inundation event. River inundation is excluded by the presence of marine diatoms and geochemical salinity indicators. This interpretation is consistent with a considerable increase in magnetic susceptibility at the bottom of unit 2, reflecting swash processes sorting for the heavier magnetic grains, with a linear decrease upward, as depositional energy slackens, as normal grading of the unit (Fig. 2c). The different mechanical properties of sediments (particle size and shape) likely explain why K1 lacks reorientation perpendicular to the MF flow direction, despite exhibiting a higher degree of anisotropy. MF II from the clay unit below is typical of sedimentary MF of a low-energy depositional environment with mixed horizontal K1 and K2 components and a low degree of anisotropy P15. Radiocarbon ages from sand unit 2 at both A1 and A2 sites (Fig.2a) yielded similar ages of 1955–1956 cal AD and 1954–1955 cal AD (Supplementary Table S3), respectively. Instrumental records, seismic and tide gauge16, report three earthquakes and tsunamis in the late 1950s to early 1960s that may be related to this sand deposit. The M 7.8 earthquake produced a tsunami near Acapulco in 1957, although tide gauge data at the Acapulco port did not confirm a permanent uplift produced by this earthquake16. The 11 May 1962 (M 7.1) and 19 May 1962 (M 7.0) tsunamigenic earthquakes (Fig. 1a) produced permanent uplift of 15 ± 3 cm and 7 ± 3 cm during these events in the Acapulco region16. Sand unit 2 is likely associated with the 1957 earthquake and tsunami, even though we have not absolute certainty about which one of the three events caused the permanent coastal uplift, the 1957 event likely produced coastal uplift.
Sand Unit 3 is observed on both A1 and A2, and at 20 more sites (Fig. 2a, Supplementary Table S1) and shows a sharp basal contact and flame structures indicating syndepositional soft-sediment deformation. This unit also includes broken shells and fragmented and whole marine diatom valves (Fig. 2b), suggesting marine inundation by a tsunami. Anisotropy of magnetic susceptibility analysis (AMS) of this unit shows a slight reorientation tendency of K1 to the perpendicular position and a slightly higher degree of anisotropy P suggest that sand unit 3 was deposited in a higher-energy environment17,18,19,20 (Fig. 2c). Sediments above sand unit 3 are composed of clayish silt (Supplementary Fig. S1) with predominantly brackish diatoms ( > 40%), while sediments below are composed of fine sand with less fragmented diatom valves and few brackish diatoms ( < 5%) (Fig. 2b). This sudden change in the environment suggests land subsidence. Based on the analysis of diatoms in the current topography and coastal environments at the site (Fig. 2a, b and Supplementary Fig. S3), the drop in land level could be equivalent to a change from a beach ridge elevation to an estuary or a swale elevation, likely a subsidence in the range of ≥ 1 m. We suggest that a large earthquake, ~Mw > 8, produced the observed coseismic coastal subsidence and triggered a tsunami, flooding at least 800 m inland. We used both the geologic record of the earthquake (coastal deformation) and of the tsunami, together with earthquake rupture and tsunami modeling scenarios to estimate an approximate magnitude. The age of this event through OSL dating of quartz grains indicates that this tsunami, triggered by a local potential earthquake, occurred between 1240 and 1370 AD (Supplementary Table S4). The 15th century witnessed the occurrence of earthquakes, which are documented in the earliest historical texts written in Spanish21. Additionally, the oldest recorded historical event that caused a tsunami on the GSG dates to 1537 AD22. Thus, historical records do not, but our results using different proxies demonstrate that a large tsunamigenic earthquake occurred on the Guerrero coast between 1240 and 1370 AD.
Sand unit 4 is composed mainly of fine sand and shows a sharp basal contact with black sandy silt below. It contains shell fragments and brackish and marine diatoms, with some plant debris, suggesting a marine flooding event. The sediment layer above sand unit 4 consists of fine sand with a minor presence of brackish diatoms ( < 4%). Conversely, the sediments beneath sand unit 4 show an ascending prevalence of brackish to marine diatoms as one moves down into the core. This transition indicates a shift in the environment, likely attributed to a change in land level—potentially uplift. While the precise timing of this occurrence remains uncertain, it is estimated to predate the period of 1240–1370 AD (Fig. 2a, b and Supplementary Table S4).
Finally, the lowest deformed sand unit 5 with sharp basal contact, shell fragments, and marine diatoms (although diatoms are scarce) suggests probable marine inundation. Deformation of this unit indicates an apparent liquefaction event, most likely produced by an earthquake before 590–666 Cal AD and after 485–359 Cal BC (Fig. 2a, b and Supplementary Table S3).
Our interpretation considers various factors influencing the observed changes in the depositional environment and microorganism habitat. While we acknowledge the possibility of secondary processes playing a role, our focus on the tsunami as the primary driver is supported by multiple lines of evidence, including sedimentology, diatom analysis, and topographical comparisons. We recognize the dynamic nature of coastal settings and the potential for natural processes to influence them, but the combination of evidence supports our interpretation of a tsunami-induced shift in the coastal environment.
Coastal land-level changes and variable occurrence of large events
We maintain confidence in the robustness of our findings regarding the chronological sequence of events and their association with land-level changes. Herein, we provide additional elaboration. 1) Our detailed chronology related to sand unit 2 lends robust support to our interpretations. Radiocarbon dating of sand unit 2 from both the A1 and A2 sites yielded closely aligned dates of 1955–1956 cal AD and 1954–1955 cal AD. 2) We have expounded above upon the relationship between sand unit 2 and the adjacent units, namely the underlying clay unit containing abundant diatoms characteristic of a brackish environment, and the overlying clay-sand unit which displays a substantial decrease in brackish diatoms. This transition suggests a shift in land elevation, potentially indicative of coastal uplift. 3) Our proposition of sudden coastal uplift is not solely based on the diatom composition within the core, but also on our comprehensive analysis of topography and diatom content in various analogous modern environments along the same transect (Refer to Fig. S3). Comparison with modern analogs reveals a prevalence of brackish diatoms in low-lying regions such as ponds, swales, and estuaries. Contrasting with this, our core demonstrates a sharp reduction from 60% brackish diatoms in the unit below the sand layer to only 10% in the clay-silt layer above, implying a transition from a swale or estuarine condition to drier surroundings, indicative of coastal uplift. 4) Furthermore, we highlight instrumental data affirming a coastal uplift of 15 + / − 3 cm and 7 + / − 3 cm attributable to local events, specifically the tsunamigenic earthquakes of May 11, 1962 (M7.1) and May 19, 1962 (M7.0). Notably, a M7.8 tsunamigenic earthquake occurred in 1957, although there is no instrumental record indicating concurrent land-level change. We propose that both the earthquake and the resultant tsunami could plausibly be linked to the M7.8 event in 1957. In essence, while we lack absolute certainty about which of the three events triggered the permanent coastal uplift, we have integrated this understanding into our explanations above.
We have examined a total of 38 sites, to address the question of a broad representation of evidence for land-level change, employing various methods such as cores, geoslices, pits, and hang-auger surveys to gather a comprehensive dataset. It is all included in Fig. 2a and Supplementary Table S1. Figure 2a and Supplementary Table S1 present the stratigraphy at each individual site, providing valuable insights into the sedimentary layers and changes observed. Furthermore, we have included information about the transition from intertidal to subtidal conditions, which can serve as a compelling indicator of land-level change. Please refer to Supplementary Fig. S3.
In summary, our investigation has yielded evidence of four tsunamis and potential associated earthquakes. However, it is important to acknowledge that the age of one of these events (sand unit 4) remains inconclusive. Among the identified events, only the third event, characterized by the presence of sand unit 3, exhibits clear indications of permanent and notable deformation, specifically coastal subsidence. For the remaining three events, there appears to be evidence of minor uplift or modest, non-permanent deformation. The maximum inland extent of tsunami deposits and the calculation of the maximum tsunami flooding limit based on the distribution of associated deposits on the surface is a conservative estimate. Factors such as the sediment source and preservation of deposits over time affect this calculation23,24,25,26. Thus, the observed 800 m inland extent of tsunami deposits is a small estimate of the maximum inland tsunami inundation limit. The time frame of these events shows that occurrence has been highly variable for the past ca. 2000 years (Fig. 2a, b and Supplementary Tables S2–S4). However, this record is an estimate of tsunamigenic earthquake occurrence in the past. Nevertheless, the “1300 AD” event (unit 3) is likely a remarkable event that produced considerable coastal deformation ( ~ 1 m subsidence) and may reflect a rupture closer to the trench. Most instrumentally recorded events on the MSZ rupturing near the coast produced coastal uplift for earthquakes in 1962, 1985, and 202016,27,28. However, other large near-trench earthquake events (within 20 km) causing seismic slip in the shallow portion of the MSZ, such as Colima 1995 and Jalisco 1932, produced coseismic coastal subsidence29,30,31,32. Earthquake ruptures near the trench cause vertical coseismic displacement and uplift, generating tsunamis33. Near-trench events in the GSG are relatively common, such as the 2002 Mw6.7 near-trench tsunami earthquake, which produced a limited tsunami response ( < 10 cm)34.
Earthquake rupture modeling scenarios aided in to evaluate of coseismic deformation, using various models based on different factors such as fault plane distance from the coastline, magnitudes, and rupture areas. Results showed that fault planes near the coastline caused coastal uplift, while those farther away gradually shifted to subsidence beyond 20 km offshore (Supplementary Fig. S4). Earthquakes with magnitudes Mw > 8.2, located over 20 km from the coastline, led to subsidence. Models T4 and T5 were identified as suitable for generating coastal subsidence values between 1–2 m, and model T5 is a better fit (Fig. 3a, Supplementary Figs. S4 and S5), consistent with our geological records.

a Fault rupture and coseismic deformation model, and tsunami model of a hypothesized Mw 8.6 earthquake near the trench producing a tsunami with amplitudes over 10 m at the coast and inundation over 1 km inland at the studied area A1 (a–c); (b) Close-up to tsunami inundation depths at the studied area where sites preserved tsunami deposits from the 1300 AD tsunamigenic earthquake and other 3 events. c Model of maximum tsunami wave amplitudes generated by best fit modeled earthquake scenario of Mw 8.6 (See Supplementary Figs. S4 and S5). d Tsunami amplitudes along places on the Guerrero seismic gap of the Pacific coast of Mexico. Source: a and c composed on Surfer 16. The background shaded image was produced from the gridded bathymetric data set by GEBCO_2023 Grid available at: https://www.gebco.net/data_and_products/gridded_bathymetry_data/#global. c The background shaded relief model corresponds to the 5 m LIDAR grid model provided by INEGI and available at: https://www.inegi.org.mx/app/biblioteca/ficha.html?upc=889463542391. The software Surfer 16 was used to composite the flooding map.
Regarding maximum tsunami amplitudes, models with a magnitude around 8.6 directly in front of site A1 achieved amplitudes exceeding 10 m (Fig. 3c, d and Supplementary Fig. S5b, c). Shifting the fault plane to the southeast or northwest substantially reduced these amplitudes (Supplementary Fig. S5b). Scenario T5 mets the criteria for generating maximum tsunami amplitudes capable of inundating site A1, i.e., more than 1 km inland (Fig. 3b). Thus, tsunami modeling of a hypothesized near-trench Mw8.6 earthquake produces tsunami amplitudes over 10 m at the coast and inundation over 1 km inland in the study area. This model fits long-term evidence of a Mw > 8 earthquake and a tsunami that flooded > 1 km inland (Fig. 3).
Furthermore, based on the information provided, ruptures along neighboring segments are unlikely to produce similar tsunami deposits or inundation patterns near site A1. The proximity to the coastline, as suggested by the coseismic deformation models in Supplementary Fig. S4, indicates a higher likelihood of coastal uplift rather than subsidence. Additionally, as shown in Supplementary Fig. S5b, even earthquakes with magnitudes greater than 8.3, such as in T9 scenario, do not generate amplitudes capable of inundating A1. Furthermore, historical evidence from earthquakes like Jalisco 1932 (Mw8.2), Michoacan 1985 (Mw8.1), and Oaxaca 1785 (M8.6) does not suggest the occurrence of subsidence or flooding capable of causing the observed tsunami deposits at A1 in the Guerrero Seismic Gap. Therefore, it is unlikely that ruptures along neighboring segments would produce similar effects in this specific location.
Regarding the location of the newly discovered four large earthquakes, we base our certainty on a comprehensive assessment of the geologic evidence, particularly in relation to sand unit 3 and the surrounding units. These geological indicators point to an important change in land level, likely resulting from a large earthquake that ruptured near the trench and generated a sizable tsunami. This interpretation is further supported by the outcomes of our best-fit modeling. We have determined that the evidence within unit 3 strongly suggests a large-scale seismic event, one that is likely linked to the Guerrero seismic gap (GSG). Our preferred model involves a fault rupture length of 210 km and a width of 90 km, with a maximum slip of 20 m concentrated at shallow depths, at 20 km from the coast, 40 km from the trench, and at 20 km depth (scenario T5 in Table S5). In summary, our confidence in attributing the observed land-level changes to the Guerrero seismic gap (GSG) is primarily drawn from a thorough analysis of geological evidence and corroborated by our modeling outcomes.
Long-term record of earthquakes vs. short instrumental geophysical observations
Our results show geologic and historical evidence of past large earthquakes coupled with tsunamis in the last 2000 years. A potential large tsunamigenic earthquake (Mw > 8) in ~1300 AD, i.e., is substantially larger than that recorded instrumentally and observed during the past ca. 110 years. The ages for the four tsunami-indicative sand units are younger than the mid-Holocene sea-level highstand, and sea-level records for the past 2 ka show little to mild changes in sea level, < 1 mm/year, until the late mid-19th century when sea level increased35. Previous work on this segment of the MSZ also provided evidence for apparent older earthquakes, probably 3 tsunami events during the past 4600 BP years8,13. Evidence of another large earthquake that produced land subsidence accompanied by marine inundation, most likely a tsunami, by c. 3400 yr BP, was reported on the Guerrero coast8. The neighboring Oaxaca segment shows historical and geologic evidence of a Mw8.6 earthquake and tsunami in the 1787 flooding > 500 km alongshore and up to > 6 km inland36.
Recent geologic evidence provides new insights into extraordinary catastrophic events in the Mexican subduction zone. The occurrence of large events might be in the range of centuries. Our observations also indicate that indeed subduction zones might have variable rupture modes. The GSG and other segments on the MSZ and other subduction zones require combined long-term and instrumental observations to forewarn eventual catastrophes. Our findings offer evidence to prepare communities for earthquake and tsunami hazards.
Methods
Field survey
Field exploration and reconnaissance were performed during several seasons and years, looking for the potential environments that would preserve tsunami deposits. We worked on salt marshes, estuaries, swales between beach ridges, and swamps along 55 km of the coast of the Guerrero segment and used a hang huger, geoslicer, and pits at more than 35 sites (Fig. 1b, Supplementary Table S1). We found evidence of tsunami deposits near estuaries, dug, and collected geoslices as far as 800 m landward (Figs. 1b–c, 2a).
Stratigraphic and sediment analysis
We constructed stratigraphic cross sections using geoslices and pits (Fig. 2a). Focus was given to sites 9 sites, and at A1 and A2 for further sediment analysis, including grain size, diatoms, geochemistry, and different dating techniques37. Site A1 was used to study magnetic properties, including magnetic susceptibility and anisotropy of magnetic susceptibility (AMS).
Diatom analysis
Samples for microfossil (diatoms) analyses were collected from site A1. One gram of dry sediment was sampled from each horizon and dispersed in 10% hydrochloric acid to remove carbonates. Later, these samples were neutralized and dispersed in distilled water. Thin sections were made with 400 μl of liquid dispersion for each slide. Counts of valves were undertaken with a Carl Zeiss (series 470801–9097) microscope, and species composition is reported as total abundance recognized in the slides. Diatom fragments were counted on the same area in all samples under oil immersion with a magnification of 100x; however, diatom valves in some samples (sand layers and clay bed between 21 and 45 cm in A1) were investigated in various thin sections from the same horizons due to scarce diatoms in these horizons. A coarse fraction, larger than the diatom size, was extracted from sand beds before the preparation of thin sections to increase the number of possible findings. Each specimen counted no less than half a valve. We identified and counted 1420 diatom valves from site A1. The environmental preferences of the diatoms were determined based on the literature (Supplementary Information - Supplementary Notes 1). Microfossil diagrams were created using Tilia software38.
Anisotropy of magnetic susceptibility analysis
Samples for magnetic susceptibility measurements were collected along a continuous vertical profile from A1 every 2 cm into plastic boxes with a volume of 7 cm3. Some fabrics were verified in the field by taking natural samples from a pit wall at site A1 because of fabric deformation during coring. Only natural and original fabrics from 4 different units were preserved at site A1. All AMS measurements were conducted using the MFK1-FA Kappabridge device (applied field of 200 A/m) and using a 3D rotator39. Principal susceptibility directions K1, K2, and K3 correspond to maximum, intermediate, and minimum susceptibility directions, respectively. AMS parameters T (shape parameter) and P (degree of anisotropy) have been defined by Jelinek40,41.
210 Pb dating and elemental composition, OSL and C14 analysis
We used the same technique described by Ramirez-Herrera et al.36 for elemental composition analysis and 210Pb chronology. The top sediment sequence, from 1 to 25 cm, of which only the first 16 cm was measured for this purpose, the rest were beyond the range of datable material using the CFCS model. Thus, the dated sequence was very young, 40 years old (Supplementary Table S2). Fourteen samples for radiocarbon dating were measured and dated at the Beta Analytic Laboratory (Supplementary Table S3).
Optical stimulated luminescence (OSL) analysis was performed at the Geoluminiscence Research Dating Lab facility at Baylor University. The collection of samples was performed as described by the facility (https://www.baylor.edu/geosciences/index.php?id=955930). Three samples were measured for OSL dates (Supplementary Table S4).
It is important to note that various dating methods often complement each other, contributing to a more robust chronological framework. In similar studies, multiple dating techniques have been successfully addressed different aspects of sedimentary sequences. Pb210 dating is suitable for younger sediments, OSL is effective for tsunami deposits, and C14 is utilized when organic matter is present. When combined, these methods enhance the reliability and accuracy of the chronological interpretation. Therefore, integrating multiple techniques is a well-established practice in sedimentary research using Pb210, C14, and OSL methods to date tsunami deposits42,43,44.
Tsunami modeling
Tsunami modeling was computed using the Funwave code45. A hypothetical Mw = 8.6 earthquake was positioned in the middle of the Guerrero segment and defined with a rupture area of 210 × 90 km2 at a depth of 20 km (detailed input in Supplementary Table S5). The first step in the code, TOPICS, solves the initial coseismic deformation and transfers it to the free water surface. This step is driven by the elastic half-space formulation of Okada46. The propagation and inundation modeling were solved by a subroutine module based on a fully nonlinear Boussinesq model. The simulation time was established at 120 min at one-minute intervals. The input for the propagation and inundation tsunami model was the topo-bathymetric model version GEBCO_2022, provided for GEBCO Compilation Group, GEBCO_2022 Grid a Global grid47 of elevation values in meters on a 15 arc-second interval grid, equivalent to ca. 453 m, and land topographic data from a 5 m LIDAR Digital Terrain Model.
Data availability
All information and data that are necessary to interpret, verify, and extend the research in the article are provided in the form of Supplementary Information. The data sets supporting tsunami modeling, sedimentology, and geochemical data presented in Fig. 3d and Supplementary Figs. S1, S2, S4, and S5, are publicly available on the Zenodo repository, as part of this record with the identifier: https://doi.org/10.5281/zenodo.10732215.
Code availability
The FUNWAVE tsunami code can be fully accessed with no restrictions at https://fengyanshi.github.io/build/html/setup.html#download-source-code. No new computer code was written in preparing the paper.
References
Suarez, G., Montfret, T., Wittlinger, G. & David, C. Geometry of subduction and depth of the seismogenic zone in the Guerrero gap, Mexico. Nature 345, 336–338 (1990).
Husker, A., Ferrari, L., Arango-Galván, C., Corbo-Camargo, F. & Arzate-Flores, J. A geologic recipe for transient slip within the seismogenic zone: Insight from the Guerrero seismic gap, Mexico. Geology 46, 35–38 (2018).
Sawai, Y., Namegaya, Y., Okamura, Y., Satake, K. & Shishikura, M. Challenges of anticipating the 2011 Tohoku earthquake and tsunami using coastal geology. Geophys. Res. Lett. 39, L21309 (2012).
Cisternas, M. et al. Predecessors of the giant 1960 Chile earthquake. Nature 437, 404–407 (2005).
Monecke, K. et al. A 1000-year sediment record of tsunami recurrence in northern Sumatra. Nature 455, 1232–1234 (2008).
Atwater et al. Summary of coastal geologic evidence for past great earthquakes at the Cascadia subduction zone. Earthq. Spectra 11, 1–18 (1995).
Ramı́rez-Herrera, M. T. & Urrutia-Fucugauchi, J. Morphotectonic zones along the coast of the Pacific continental margin, southern Mexico. Geomorphology 28, 237–250 (1999).
Ramírez-Herrera, M. T. et al. Sedimentary record of late Holocene relative sea-level change and tectonic deformation from the Guerrero seismic gap, Mexican Pacific coast. Holocene 17, 1211–1220 (2007).
Černý, J., Ramírez-Herrera, M. T., Garcia, E., Ito, Y. Seafloor morphology along the active margin in Guerrero, Mexico: probable earthquake implications. J. South Am. Earth Sci. 102, 1–10 (2020).
Bell, R., Holden, C., Power, W., Wang, X. & Downes, G. Hikurangi margin tsunami earthquake generated by slow seismic rupture over a subducted seamount. Earth Planet. Sci. Lett. 397, 1–9 (2014).
Prada, M., Bartolomé, R., Gras, C., Bandy, W. & Dañobeitia, J. J. Trench-parallel ridge subduction controls upper-plate structure and shallow megathrust seismogenesis along the Jalisco-Colima margin, Mexico. Commun. Earth Environ. 4, 53 (2023).
Servicio Mareográfico Nacional: https://chalchiuhtlicue.geofisica.unam.mx/ (2024).
Ramírez-Herrera, M. T., Cundy, A. & Kostoglodov, V. Probables sismos y tsunamis prehistóricos durante los últimos 5000 años en la costa de la brecha sísmica de Guerrero, México. XV CNIS Sociedad Mexicana de Ingeniería Sísmica. I 07:1-17 (2005).
Dolman, A. M., Groeneveld, J., Mollenhauer, G., Ho, S. L. & Laepple, T. Estimating bioturbation from replicated small‐sample radiocarbon ages. Paleoceanography and Paleoclimatology 36, e2020PA004142 (2021).
Černý, J., Ramírez-Herrera, M. T. & Caballero, M. Procedures for diatom analyses and hydrodynamic separation of extreme wave paleo-deposits from tropical sediment environments. Mar. Geol. 455, 106970 (2023).
Ortiz, M., Singh, S. K., Kostoglodov, V. & Pacheco, J. Source areas of the Acapulco-San Marcos, Mexico earthquakes of 1962 (M 7.1; 7.0) and 1957 (M 7.7), as constrained by tsunami and uplift records. Geofís. Int. 39, 337–348 (2000).
Wassmer, P. et al. Use of anisotropy of magnetic susceptibility (AMS) in the study of tsunami deposits: application to the 2004 deposits on the eastern coast of Banda Aceh, North Sumatra, Indonesia. Mar. Geol. 275, 255–272 (2010).
Cuven, S. et al. High-resolution analysis of a tsunami deposit: case-study from the 1755 Lisbon tsunami in southwestern Spain. Mar. Geol. 337, 98–111 (2013).
Schneider, J. L. et al. Using magnetic fabric to reconstruct the dynamics of tsunami deposition on the Sendai Plain, Japan – The 2011 Tohoku-oki tsunami. Mar. Geol. 358, 89–106 (2014).
Černý, J., et al. Magnetic record of extreme marine inundation events at Las Salinas site, Jalisco, Mexican Pacific coast. Int. Geol. Rev. 58, 342–357 (2016).
Suárez, G. Catálogo de Sismos Históricos de México. http://www.sismoshistoricos.org/ (2021).
Ramírez-Herrera, M.-T., Corona, N. & Suárez, G. A Review of Great Magnitude Earthquakes and Associated Tsunamis along the Guerrero, Mexico Pacific Coast (eds M. Chavez, M. Ghil and J. Urrutia-Fucugauchi) 165–176, ch. 13 (AGU, 2015).
Abe, T., Goto, K. & Sugawara, D. Relationship between the maximum extent of tsunami sand and the inundation limit of the 2011 Tohoku-oki tsunami on the Sendai Plain, Japan. Sediment. Geol. 282, 142–150 (2012).
Abe, T., Goto, K. & Sugawara, D. Spatial distribution and sources of tsunami deposits in a narrow valley setting-insight from 2011 Tohoku-oki tsunami deposits in northeastern Japan. PEPS 7, 1–21 (2020).
Moreira, S. et al. High resolution geochemical and grain-size analysis of the AD 1755 tsunami deposit: insights into the inland extent and inundation phases. Mar. Geol. 390, 94–105 (2017).
Shinozaki, T. et al. Identifying tsunami traces beyond sandy tsunami deposits using terrigenous biomarkers: a case study of the 2011 Tohoku-oki tsunami in a coastal pine forest, northern Japan. PEPS 9, 1–10 (2022).
Bodin, P. & Klinger, T. Coastal uplift and mortality of intertidal organisms caused by the september 1985 Mexico earthquakes. Science 233, 1071–1073 (1986).
Ramírez-Herrera, M. T., Romero, D., Corona, N., Nava, H. The 23 June 2020 Mw 7.4 La Crucecita, Oaxaca, Mexico earthquake and tsunami: a rapid response field survey during COVID‐19. Crisis. Seismol. Res. Lett. 92, 26–37 (2020).
Cumming, J. L. Los terremotos de Junio de 1932 en los estados de Colima y Jalisco. Universidad de México 6, 68–104 (1933).
Hutton, W., DeMets, C., Sanchez, O., Suarez, G. & Stock, J. Slip kinematics and dynamics during and after the 1995 october 9 Mw= 8.0 Colima–Jalisco earthquake, Mexico, from GPS geodetic constraints. Geophys. J. Int. 146, 637–658 (2001).
Hjörleifsdóttir, V. et al. Was the 9 october 1995 Mw 8 Jalisco, Mexico, earthquake a near-trench event? J. Geophys. Res. Solid Earth 123, 8907–8925 (2018).
Pacheco, J. et al. The october 9, 1995 Colima-Jalisco, Mexico earthquake (Mw 8): an aftershock study and a comparison of this earthquake with those of 1932. Geophys. Res. Lett. 24, 2223–2226 (1997).
Kanamori, H. & Kikuchi, M. The 1992 nicaragua earthquake: a slow tsunami earthquake associated with subducted sediments. Nature 361, 714–716 (1993).
Flores, K., Hjorleifsdottir, V., Iglesias, A. & Singh, S. Did the Long Duration, April 18, 2002 (Mw 6.7), Mexico Earthquake Break the Guerrero Gap. AGU Fall Meeting Abstracts 2016, S53A–S52803; 2016AGUFM.S53A2803F https://agu.confex.com/agu/fm16/meetingapp.cgi/Paper/186208 (2016).
Kemp, AndrewC. et al. Climate related sea-level variations over the past two millennia. PNAS USA 108, 11017–11022 (2011).
Ramı́rez-Herrera, M.-T. et al. Sand deposits reveal great earthquakes and tsunamis at Mexican Pacific Coast. Sci. Rep. 10, 11452 (2020).
Ramirez-Herrera, M.-T. et al. Tsunami deposits in the Guerrero Seismic Gap, Mexico: insights from location analysis, earthquake and tsunami models, and proxy dataset. Zenodo. https://doi.org/10.5281/zenodo.10732215 (2024).
Grimm E. C., Tilia software, ver. 260 (2016).
Studỳnka, J., Chadima, M. & Suza, P. Fully automated measurement of anisotropy of magnetic susceptibility using 3D rotator. Tectonophysics 629, 6–13 (2014).
Jelinek, V. Characterization of the magnetic fabric of rocks. Tectonophysics 79, T63–T67 (1981).
Nagata, T. Rock magnetism, 350 p. (Maruzen Company Ltd., 1961).
Brill, D. et al. Local inundation distances and regional tsunami recurrence in the Indian Ocean inferred from luminescence dating of sandy deposits in Thailand. NHESS 12, 2177–2192 (2012).
Reinhardt, E. G. et al. The tsunami of 13 december AD 115 and the destruction of Herod the Great’s harbor at Caesarea Maritima, Israel. Geology 34, 1061–1064 (2006).
Goodman-Tchernov, B. N., Dey, H. W., Reinhardt, E. G., McCoy, F. & Mart, Y. Tsunami waves generated by the Santorini eruption reached Eastern Mediterranean shores. Geology 37, 943–946 (2009).
Watts, P., Grilli, S. T., Kirby, J. T., Fryer, G. J. & Tappin, D. R. Landslide tsunami case studies using a Boussinesq model and a fully nonlinear tsunami generation model. NHES 3, 391–402 (2003).
Okada, Y. Surface deformation due to shear and tensile faults in a half-space. BSSA 75, 1135–1154 (1985).
GEBCO_2022, GEBCO Compilation group, GEBCO_2022 Grid. https://doi.org/10.5285/e0f0bb80-ab44-2739-e053-6c86abc0289c (2022).
Acknowledgements
We thank Tina Dura for her feedback and valuable discussions. We are indebted to Alejandro Rodriguez R. for assisting with microfossil analysis and to Oswaldo Coca for uploading data into the Zenodo Database. AMS analysis were performed at Laboratorio Interinstitucional de Magnetismo Natural – UNAM, with assistance by Miguel Cervantes. This research project was funded by CONACYT-284365 and PAPIIT- IN107721 awarded to M.T.R-H.
Author information
Authors and Affiliations
Contributions
M.T.R-H. conceived and carried out the research, data acquisition, lab analyses, and wrote the manuscript. N.C. carried out tsunami and earthquake modeling, created all final figures, and helped with the manuscript revision. J.C. performed diatom and AMS analysis and contributed with the related sections of an early version of this manuscript. K.G. drafted a figure, aided in data interpretation and manuscript revision. D.S. aided in initial subsampling, helped with data interpretation in the field. All authors mentioned above participated in the fieldwork. S.L.F. carried out OSL analysis. M.L.M-C. assisted with microfossil identification. A.G. assisted with AMS analysis. All authors revised the manuscript.
Corresponding author
Ethics declarations
Competing interests
The authors declare no competing interests.
Peer review
Peer review information
Communications Earth and Environment thanks the anonymous reviewers for their contribution to the peer review of this work. Primary Handling Editor: Joe Aslin. A peer review file is available.
Additional information
Publisher’s note Springer Nature remains neutral with regard to jurisdictional claims in published maps and institutional affiliations.
Supplementary information
Rights and permissions
Open Access This article is licensed under a Creative Commons Attribution 4.0 International License, which permits use, sharing, adaptation, distribution and reproduction in any medium or format, as long as you give appropriate credit to the original author(s) and the source, provide a link to the Creative Commons licence, and indicate if changes were made. The images or other third party material in this article are included in the article’s Creative Commons licence, unless indicated otherwise in a credit line to the material. If material is not included in the article’s Creative Commons licence and your intended use is not permitted by statutory regulation or exceeds the permitted use, you will need to obtain permission directly from the copyright holder. To view a copy of this licence, visit http://creativecommons.org/licenses/by/4.0/.
About this article

Cite this article
Ramírez-Herrera, M.T., Corona, N., Černý, J. et al. Tsunami deposits highlight high-magnitude earthquake potential in the Guerrero seismic gap Mexico. Commun Earth Environ 5, 198 (2024). https://doi.org/10.1038/s43247-024-01364-0
Received:
Accepted:
Published:
DOI: https://doi.org/10.1038/s43247-024-01364-0
Comments
By submitting a comment you agree to abide by our Terms and Community Guidelines. If you find something abusive or that does not comply with our terms or guidelines please flag it as inappropriate.
