
Abstract
Precipitation in clouds can form by either warm-rain or ice crystal processes, referred to as warm and cold formation pathways, respectively. Here, we investigate the warm and cold pathway contributions to surface precipitation in simulated continental convective storms. We analyze three contrasting convective storms that are cold-based, slightly warm-based and very warm-based. We apply tracer-tagging techniques in our aerosol-cloud model to determine simulated microphysical pathways that lead to precipitation. We find cold components of graupel and rain mass were higher than warm components in cold- and slightly warm-based clouds. By contrast, in very warm-based clouds nearly 80% of surface precipitation was formed via warm-rain processes. Lowering of cloud base altitude to levels about 10–20 K warmer switched surface precipitation to being mostly warm, due to enhanced moisture content in the planetary boundary layer and larger cloud droplets aloft intensifying raindrop freezing. Our simulations indicate that warm and cold processes co-exist in any storm and the balance between them is determined by cloud base temperature and solute aerosol conditions.
Introduction
Precipitation is fundamental to the hydrological cycle and is a major sink for condensate mass in clouds, controlling the cloud lifetime and the cloud-radiation feedback in climate change1. As expected in a warming climate, increased rates of heavy convective precipitation, with uneven distributions over land and ocean, have already been observed in the extratropics2,3. These patterns are influenced by various microphysical pathways, such as raindrop freezing, aggregation of ice and its melting. There is a lack of detail in the representation of these microphysical pathways for precipitation in global climate models, partly because they generally do not resolve the in-cloud distribution of vertical air motions that force microphysical processes, which affects climate change projections2. In fact, most global climate models are not equipped to track precipitation components associated with the warm-rain and ice crystal processes rigorously2. So, their precise balance globally is uncertain.
Both cloud microphysical and macrophysical processes, along with the environmental conditions, regulate the intensity, scales, and timing of precipitation4,5,6,7,8,9,10,11. There are two essential sets of microphysical processes to form precipitation:
-
1.
Warm-rain process: cloud droplets collide and coalesce to form (“warm”) raindrops that then grow by more coalescence and may freeze to form (“warm”) graupel, which may then melt during the fallout.
-
2.
Ice crystal process: ice crystals can be formed by heterogeneous ice nucleation, and their growth can create snow (e.g., aggregates), which may rime to form (“cold”) graupel or hail. Again, this ice precipitation may melt to form (“cold”) rain.
In nature, both the warm-rain and ice-crystal processes of precipitation can co-exist in any given cloud, being interlinked, making their evolution a complex process. For example, in point 1, raindrop-freezing occurs in raindrop-ice collisions12,13,14,15,16, forming graupel or hail. For the same initial mass, a graupel particle is more efficient at accretion of cloud mass for precipitation growth relative to a liquid drop17.
Misconceptions can easily arise from the fact that the ice phase of clouds can be forced by either the warm-rain process or the ice crystal process or both. The mere existence of ice precipitation does not necessarily imply that most of its mass is from the ice crystal process. In reality, most of the mass of ice precipitation in a given warm-based cloud may sometimes be from the warm-rain process including raindrop freezing15,16,17,18. Therefore, the assumption that surface precipitation must be cold merely due to the presence of ice somewhere aloft in the cloudy column is not always valid. Such an assumption was adopted in some satellite-based and global modeling studies19,20, which might have affected their inference of warm-rain occurrence over the globe. It is still an open question as to what are the circumstances by which warm precipitation prevails when clouds are deep.
Numerical modeling offers a way to analyze causation in clouds from field observations, elucidating the relative strengths of such microphysical pathways (see Methods) of precipitation10,21,22,23,24,25,26,27. Although this approach is subject to modeling limitations, sufficient acuity and extent of validation of predictions of many cloud-related quantities against coincident observations establishes confidence in model results. Thus, the present study follows a modeling approach and uses the aerosol-cloud (AC) model27,28,29,30,31,32,33,34. AC has a hybrid bin/bulk microphysics treatment, and the known microphysical processes are represented, especially in relation to initiation of ice particles and growth of precipitation with dependencies on the loading, size, chemistry27,28,29,30,31,32,33,34 of aerosol particles in the environment. The ice crystal and collision-coalescence processes are treated in detail with five microphysical species (cloud-ice crystals, snow, graupel/hail, cloud-droplets and rain) and many chemical species of aerosol particles. Phillips27 described the relative roles of nucleation processes (homogenous vs. heterogenous processes) in the initiation of cloud particles in the cloud ensemble. In AC, secondary ice production (SIP) is represented via four types of fragmentation including breakup in ice–ice collisions30, rime splintering6, fragmentation of freezing rain/drizzle by two modes16 1 and 2, and sublimation breakup35. Thus, AC enables the investigation of cloud properties and precipitation processes and the effects from different environmental conditions on both warm-rain and ice crystal processes (see Supplementary Note 1). More details of AC, which utilizes an in-house developed advanced cloud microphysics scheme, semi-prognostic aerosol scheme, and the Geophysical Fluid Dynamics Laboratory (GFDL) radiation scheme36 within the framework of the Weather Research and Forecasting (WRF37) model, are provided in the “Methods.”
Figure 1 illustrates qualitatively how these inter-related microphysical processes control the warm-rain (red line) and ice crystal (blue line) processes of precipitation. Contributions from warm and cold precipitation to the total surface precipitation in nature are determined by several interactions between hydrometeors by processes, such as coalescence and riming. Some of these are temperature dependent. For instance, the melting of snow and cold graupel from the growth of ice crystals (Fig. 1) causes cold rain. Snow can only form by the “ice-crystal process”, which involves vapor growth of crystals and coagulation, such as aggregation, and therefore all snow is “cold”. The terms “warm” and “cold” do not refer to the ambient temperature and denote only whether the warm-rain or ice-crystal process caused the precipitation.

The red color of lines and arrows in the schematic diagram denotes the warm-rain process, and their blue color highlights the ice crystal process. The black color denotes the conversions that could be part of either process.
Three contrasting storms, observed by ground-based and aircraft-based instruments during the Severe Thunderstorms Electrification and Precipitation Study (STEPS38; cloud base is at ~1 °C; see Supplementary Fig. 1 and Supplementary Data 1), the Midlatitude Continental Convective Clouds Experiment (MC3E39; cloud base is at ~17 °C; Supplementary Fig. 2 and Supplementary Data 2) and the Green Ocean Amazon Experiment (GoAmazon40; cloud base is at ~28 °C; Supplementary Fig. 3 and Supplementary Data 3), were selected for simulations to track contributions from the warm-rain and ice crystal processes to the precipitation aloft and to the total surface precipitation. Sensitivity tests were also conducted to assess the influence from various cloud-related environmental conditions, such as aerosol loadings and lower tropospheric moisture governing cloud base, on both processes of precipitation production. The experimental setup for AC of all three cases and validation of MC3E and GoAmazon are described in the “Methods” (including Supplementary Figs. 4–6 and Supplementary Data 4–6, Supplementary Table 1, Figs. 5–9 by Waman41 and Figs. 3–6 by Phillips31).
The present study discovers that both the warm-rain and ice crystal processes of precipitation co-exist in three simulated storms, and the balance between both is determined by cloud base temperature and solute aerosol conditions.
Results
STEPS—cold-based clouds (control simulation)
Figure 2 displays the five microphysical species and the warm (red curve) and cold (blue curve) components of rain and graupel for STEPS. In this simulated storm, most graupel is from the ice crystal process with riming of snow (Fig. 2a, e). The abundance of continental aerosol particles (~2500 cm−3 at a supersaturation of 1% at ~1 km mean sea level (MSL)31) in conjunction with the cold cloud base makes droplets too small for coalescence (<20 μm mean diameter) aloft. Both the high CCN concentration and cold cloud base suppress the warm-rain process (red curves in Fig. 2a–d).

Temperature-resolved conditionally averaged over cloudy regions of: a mass mixing ratio (MMR) and b number mixing ratio (NMR) of graupel with corresponding warm (red line) and cold (blue line) components; c mass and d number mixing ratios of rain plotted similarly; e ice (orange) and snow (brown) mass mixing ratio; f ice (light blue) and snow (magenta) number mixing ratio; and g cloud water number mixing ratio (purple) for the STEPS case (cold-based convective clouds at ~1 °C) control simulation using AC during 2345 UTC 19 June–0215 UTC 20 June 2000 (except without first hour of simulation). Also shown is the STEPS case control simulation of the accumulated precipitation (mm) for h the entire domain (total mesoscale region) with all clouds and corresponding components from i convective (and adjacent clear sky) and j stratiform cloudy regions during 2345 UTC 19 Jun–0215 UTC 20 Jun 2000. Note that the yellow and gray shading boxes in (a–g) display the peak values of different hydrometeor profiles. The lightest yellow represents the peak value in mass mixing ratios of a graupel and c rain. The medium and darkest yellow shaded boxes show the peak value in mass mixing ratio of cold and warm components of a graupel and c rain, respectively. Similarly, the lightest gray color indicates the peak value in the number mixing ratio of b graupel and d rain (and their cold components), while the darkest gray color is for their warm components. e The peak value of ice and snow mass mixing ratios is highlighted by medium yellow. f The peak value of ice and snow number mixing ratios is indicated by medium and darkest gray shaded boxes, respectively. g The peak in water number mixing ratio is also indicated by medium gray shaded box.
The mass and number mixing ratios of cold graupel (blue curves in Fig. 2a, b) are higher than the corresponding warm components by almost one order of magnitude above the freezing level. The simulated ice concentration is highest ( ~ 105 m−3) at about −40 °C (Fig. 2f) in the upper troposphere, due to homogenous freezing. The conditionally averaged number concentration of cloud droplets is just over half an order of magnitude higher near cloud base ( ~ 0 °C) than at about −30 °C (Fig. 2g) due to riming during convective ascent and evaporation in subzero conditions in weak ascent.
Figure 2h (blue line) shows that by the end of the simulation about 90% of surface precipitation is from the ice crystal process. At temperatures colder than about −10 °C, any trace amounts of supercooled “warm-rain” from coalescence can freeze to form “warm-graupel”, followed by melting as it falls out (Fig. 2h and Supplementary Data 7). The cold surface precipitation is dominantly from the melting of snow and cold graupel (purple and light pink bars of Supplementary Fig. 7a and Supplementary Data 8). Accumulated stratiform precipitation (Fig. 2j) in this simulated “downburst event”38 on 19 June is smaller by ~95% compared to convective precipitation (Fig. 2i), because its precipitation particles are generally too small to survive evaporation in the dry deep sub-cloud layer (RH < 90% or even less). Overall, cold precipitation is predicted to dominate both the convective and stratiform components of surface precipitation.
MC3E—slightly warm-based clouds (control simulation)
Above the freezing level, the mass and number mixing ratios of cold-graupel are higher and lower by an order of magnitude, respectively, than the corresponding warm components (Fig. 3a, b). Numerous small supercooled drops of rain/drizzle freeze aloft. This contrasts with the cold-based clouds noted above (Fig. 2b). Below the freezing level, cold components of mass and number of rain dominate, and similarly for graupel, but the warm components cannot be neglected (Fig. 3a–d).

Temperature-resolved conditionally averaged over cloudy regions of: a mass mixing ratio (MMR) and b number mixing ratio (NMR) of graupel with corresponding warm (red line) and cold (blue line) components; c mass and d number mixing ratios of rain plotted similarly; e ice (orange) and snow (brown) mass mixing ratio; f ice (light blue) and snow (magenta) number mixing ratio; and g cloud water number mixing ratio (purple) for the MC3E case (slightly warm-based convective clouds at ~17 °C) control simulation using AC during 0000–2300 UTC on 11 May 2011. Also shown is the MC3E case control simulation of the accumulated precipitation (mm) for h the entire domain with all clouds and corresponding components from i convective and j stratiform cloudy (and adjacent clear sky) regions for 72 h (10–13 May 2011). The yellow and gray shading boxes in (a–g) are similar to those in Fig. 2, with differences in (b) and (e). b The darkest gray shaded box represents cold rain mass mixing ratio, while medium gray is for warm. e The darkest yellow displays the peak value of ice mass mixing ratio, while medium yellow is for snow.
Figure 3h shows that the warm and cold components of total precipitation accumulated at the ground are comparable throughout this case. The same is true for the convective and stratiform regions. Nearly 60% of the total surface precipitation is from cold precipitation, and the remainder is from the warm-rain process. Overall surface precipitation over the entire domain is mostly from stratiform clouds (>~80%). As compared to STEPS (Fig. 2h–j), the warm-rain process is more influential due to a warmer cloud base and larger cloud droplets aloft in MC3E (Fig. 3h–j and Supplementary Data 9).
GoAmazon—very warm-based clouds (control simulation)
The mass mixing ratio of warm-graupel is remarkably higher than for cold-graupel for GoAmazon (Fig. 4a and Supplementary Data 10), which contrasts with corresponding profiles for STEPS and MC3E. This is due to: (1) lower CCN concentrations in the environment, and (2) much warmer bases with more cloud depth, than in STEPS and MC3E. This very warm-based tropical deep, convection with scarce CCN and few cloud-droplets, yet similar LWC, promotes rapid growth of cloud droplets aloft to form rain. The extra raindrops and their freezing act to boost the warm-graupel mass aloft in GoAmazon (light pink bar in Supplementary Fig. 8b and Supplementary Data 11). The ice mass mixing ratio in GoAmazon (Fig. 4e) has also increased by nearly one order of magnitude relative to STEPS and MC3E.

Temperature-resolved conditionally averaged over cloudy regions of: a mass mixing ratio (MMR) and b number mixing ratio (NMR) of graupel with corresponding warm (red line) and cold (blue line) components; c mass and d number mixing ratios of rain plotted similarly; e ice (orange) and snow (brown) mass mixing ratio; f ice (light blue) and snow (magenta) number mixing ratio; and g cloud water number mixing ratio (purple) for the GoAmazon case (very warm-based convective clouds at ~28 °C control simulation using AC during 0500–1800 UTC on 19 March 2014. Also shown is the GoAmazon case control simulation of the accumulated precipitation (mm) for h the entire domain with all clouds and corresponding components from i convective (and adjacent clear sky) and j stratiform cloudy regions during 14 h of simulations. The shading yellow and gray boxes in (a–g) are similar to those in Fig. 3, but with some differences in (a) and (c). The darkest yellow shading represents the cold components of the (a) graupel and (c) rain mass mixing ratios, while the medium yellow shading is for their warm components.
Unlike STEPS and MC3E, the warm-rain process in this tropical case (GoAmazon) contributes dominantly to the surface precipitation relative to the ice-crystal process throughout the simulation. Nearly 80% of surface precipitation is from the warm-rain process in total and over convective and stratiform regions (Fig. 4h–j). This is related to the strong dependencies of surface precipitation on CCN/IN aerosol conditions and on cloud base temperature in this case as noted below.
Design of sensitivity experiments for all three contrasting storms
To assess the impact from cloud base temperature and environmental aerosol loadings on the warm-rain and ice-crystal processes, a sequence of sensitivity tests is done for STEPS and MC3E (see below for the design of sensitivity tests for GoAmazon case). For each of the two cases (STEPS, MC3E), the following perturbation simulations are compared with the corresponding control run:
-
1.
cloud base (CB) is lowered to a warmer level (“Low CB simulation”),
-
2.
only CCN concentrations are reduced (“Low CCN simulation”),
-
3.
both CB height and CCN concentrations are reduced (“Low CB/CCN simulation”),
-
4.
solid aerosol (dust, black carbon, primary biological aerosol particle, non-biological insoluble organics) concentration are reduced (“Low dust simulation”), and
-
5.
all SIP is prohibited (“no-SIP simulation”).
The low CB simulation involved lowering cloud base without altering the in-cloud ascent statistics (see Methods below and Supplementary Methods).
In the low CCN and low dust simulations, the loadings of soluble and insoluble solid aerosol species respectively were altered by another height-dependent factor of 0.1 at the ground. This factor was linearly interpolated over height to unity at an altitude of 12 km MSL. This reflects the land-ocean contrast in aerosol loadings42. Note that the solid aerosol particles can act as both CCN and IN.
For GoAmazon, in addition to the tropical cloud base being much warmer ( ~ 28 °C) than the other two cases, also the active CCN concentration was low at nearly 500 cm−3 at 1% supersaturation and there was an average active IN concentration of only ~2 × 10⁻¹ L−1 at a level of −20 °C. The sensitivity of surface precipitation components from warm-rain and ice-crystal processes is evaluated for CCN (“High CCN”) and IN (“High Dust”) loadings increased by a factor of 10 relative to the control run.
All four simulated types of SIP were prohibited in the no-SIP simulation. The no-SIP simulation is conducted for all three contrasting storms (see Methods and Supplementary Methods).
Sensitivity simulations for STEPS
In the low CB sensitivity simulation of STEPS, the mass and number mixing ratios of warm-graupel are higher by almost one order of magnitude above the freezing level relative to the control simulation (Fig. 5a, b), whereas amounts of other hydrometeor species, such as snow and cloud-ice mass, slightly increased (Fig. 5e and Supplementary Data 12). Moreover, this warming of cloud base from ~1 °C in the control run to 18 °C, augmented the cloud droplet size aloft and adiabatic LWC in the planetary boundary layer (PBL) (Fig. 5h, j).

a–g The hydrometeor profiles for the control simulations were shown using solid lines with dots, similar to Fig. 2a–g. The colored dashed line with asterisk in (a–g) shows the sensitivity of different hydrometeor profiles when cloud base (Low CB) is lowered. Sensitivity of conditionally-averaged h mean cloud droplets diameter under lowered cloud base (CB), lowered cloud condensation nuclei (Low CCN), both lowered CB and CCN (Low CBCCN), lowered solid aerosols (Low Dust) and under no secondary ice productions (no-SIP) for the STEPS case from 23:45 UTC on 19 June to 02:15 UTC on 20 June 2000 (except without first hour of simulation). i Same as (h) but for mean ice crystal diameter in microns (μm). j Same as (h) but for mean liquid water content (LWC; gm−3). k Same as (h) but for mean ice water content (IWC; gm−3). The shading of yellow and gray boxes in (a–g) are similar to those in Fig. 2, but shaded boxes highlight the peak value of mass and number mixing ratios of hydrometeor profiles for the Low CB run.
Pie charts depict the fractional contributions from the warm and cold components to the total accumulated surface precipitation at the end of this cold-based control simulation and low CB sensitivity simulation (Fig. 6 and Supplementary Data 13). This lowering of CB boosted both the absolute (Supplementary Fig. 9 and Supplementary Data 14) and fractional warm and cold components of surface precipitation over the entire simulation and over convective and stratiform regions. Figure 6a, b shows that the fractional contribution of the warm-rain process to the total surface precipitation is increased to 54% by boosted coalescence in the low CB run as compared to 20% in the control simulation. This remarkable change in the balance between both processes of precipitation reflects the paramount importance of cloud base temperature for the microphysical regime of condensate generation and coagulation.

The pie chart shows the fractional contribution of the warm (red) and cold (blue) components to the total surface precipitation. a When simulation is run under control, b when cloud base (CB) is lowered (Low CB), c when CCN loading is reduced (Low CCN), d when both CB and CCN are lowered together (Low CBCCN), e when solid aerosol loading is lowered (Low Dust), and f when SIP is switched off (no-SIP).
Such a high enhancement of warm surface precipitation is due to the faster coalescence of larger cloud droplets aloft, which is minimal in the control, when the adiabatic LWC is boosted by more moisture in the PBL, warming the cloud-base (Fig. 5j). Raindrop freezing aloft produces more warm-graupel, enhancing warm precipitation at the surface. The lower cloud base, though warmer, also slightly promotes cold surface precipitation–yet less so than its strong boost of warm surface precipitation–from the ice crystal process. This is because more supercooled cloud liquid (Fig. 5j) aloft intensifies the riming of snow and graupel. Similarly, over convective (Supplementary Fig. 10a, b and Supplementary Data 15) and stratiform (Supplementary Fig. 11a, b and Supplementary Data 16) regions, the fractional changes in the warm/cold components of surface precipitation from lowering CB are almost comparable to those of total domain-wide surface precipitation.
In the low CCN simulation, Fig. 6a, c shows that the fractional contribution of warm components to the total surface precipitation is only slightly increased to 23% at most in-cloud levels compared to 20% in control. Such changes in the warm and cold components of surface precipitation are minimal because the STEPS control simulation involves little activity of the CCN-sensitive warm-rain process as cloud droplets were generally too small to coalesce31,43.
In the low CB/CCN simulation, Fig. 6a, d shows that the fractional contribution of the warm-rain process to the total surface precipitation is increased to 65% compared to 20% in the control. The average diameter of cloud droplets was doubled (an increase by ~8–10 μm) from the control value (Fig. 5h). These larger cloud droplets coalesce more efficiently to form rain44, which may freeze if supercooled, strongly augmenting the warm components of total surface precipitation. The strengthening of raindrop freezing in the mixed-phase region (0 °C to −36 °C) and the melting and freezing of warm graupel could also increase the warm component of surface precipitation. This alters ice multiplication by warm graupel (Fig. 5f). These results explain why the low CB/CCN simulation produces stronger warm components of the total surface precipitation. Out of all tests performed for STEPS, this sensitivity test yielded the greatest increase in fractional contributions from warm components to the surface precipitation, namely by 53% (from about 20% in control to ~73% in low CB/CCN run) over stratiform regions (Supplementary Fig. 11a, d).
In the low dust simulation, the fractional contribution of warm components to the total surface precipitation is almost unchanged, at 19.9% from the control value of 19.5% (Fig. 6a, e).
In the no-SIP simulation, the fractional contribution of the warm component to total surface precipitation is increased to 25% from 20% in the control run (Fig. 6a, f). In the no-SIP simulation, the higher average size of cloud ice crystals, which are less numerous, intensify the overall cold precipitation and thereby total surface precipitation compared to the control run (Fig. 5i). Larger crystals grow by aggregation and vapor deposition to form snow more rapidly. Overall, the no-SIP simulation showed little effect on the average size and number concentrations of cloud droplets (Fig. 5h, j). Thus, the increase in warm surface precipitation in the no-SIP simulation is chiefly associated with the strengthening of the collisional raindrop freezing from the larger ice crystals and more formation of warm-graupel.
Sensitivity simulations for MC3E
In the low CB simulation, lowering cloud base by warming it by ~11 K (from ~17 °C in the control) affects the warm components of total surface precipitation more strongly than the cold components. The fractional contribution of the warm-rain process to the total surface precipitation is increased to 42% from 24% in the control simulation (Fig. 7a, b and Supplementary Data 17). This is because lowering cloud base involves moistening the lower troposphere, which yields a greater mass of condensate from condensation for coalescence to form precipitation. In this low CB simulation, the mass mixing ratio of rain (particularly the warm component) intensifies below the freezing level, yielding more warm precipitation at the surface (Supplementary Fig. 12c and Supplementary Data 18). As stated above, the moistened PBL intensifies raindrop freezing aloft and increases the warm-graupel mass. This in turn also contributes to enhancement of the warm precipitation at the surface. Qualitatively, the manner of this response to lowering cloud base is similar to that noted above for STEPS (see Supplementary Figs. 13a–c, 14a, b, and 15a, b for its response over stratiform/convective region and also Supplementary Data 19–21).

The pie chart shows the fractional contribution of the warm (red) and cold (blue) components to the total surface precipitation. a When simulation is run under control; b when cloud base (CB) is lowered (Low CB); c when CCN loading is reduced (Low CCN); d when both CB and CCN are lowered together (Low CBCCN); e when solid aerosol loading is lowered (Low dust); f when SIP is switched off (no-SIP).
In the low CCN simulation, Fig. 7a, c shows that the fractional contribution of the warm component to the total surface precipitation is increased to 29% at most in-cloud levels compared to 24% in control run. In this low CCN simulation, the increase in cloud droplet size by more than 30% throughout the vertical column relative to the control run causes an enhancement in the warm component of total surface precipitation (Supplementary Fig. 16a). However, the mean size of ice crystals is slightly reduced in the mixed-phase region (Supplementary Fig. 16b and Supplementary Data 22), curbing the cold contribution to total surface precipitation.
In the low CB/CCN simulation, there is almost the strongest response out of all the sensitivity tests presented here because now the lowering of both cloud base and CCN concentrations act in concert in the same direction, enhancing coalescence. The fractional contribution of the warm-rain process to the total surface precipitation is increased to 49%, due to a strengthening of coalescence at most in-cloud levels, compared to 24% in control (Fig. 7a, d). The absolute amount of total surface precipitation increased by nearly a factor of 2 beyond the control run (solid and dashed black lines in Supplementary Fig. 13g). Intriguingly, over convective regions, the fractional contribution of warm components to the surface precipitation is doubled to 82% from 41% (Supplementary Fig. 14a, d). The average diameter of cloud droplets was increased by ~33% in the lower to middle troposphere relative to the control run (Supplementary Fig. 16a). As compared to the control run, the larger cloud droplets, from fewer CCN aerosols and a boosted adiabatic LWC (by almost 66%; near cloud base), act to enhance the coalescence efficiency and hence the warm components of total surface precipitation. The partial increase in the cold components of total surface precipitation relative to control run is due to enhanced growth of ice crystals with a greater mean diameter and to a reduced ice water content (IWC) below the −30 °C level (Supplementary Fig. 16d).
In the low dust simulation, Fig. 7a, e shows that the fractional contributions from the warm and cold components to total surface precipitation are similar to those in the control run. This lack of response resembles that found with the STEPS case noted above.
In the no-SIP simulation, at the end of the simulation, the fractional contribution of warm components to total surface precipitation rises to 52% from 24% in the control run (Fig. 7a, f). Removing SIP caused a strong effect on the cloud droplet size and cloud droplet number concentrations. The increase in the warm components of total surface precipitation in the no-SIP simulation is associated with strengthening of both cloud droplet size and LWC above the −25 °C level (Supplementary Fig. 16a, b). In the no-SIP simulation, a near doubling of the cloud fraction above the melting layer relative to the control run suggests an increase in the life-time of ice-clouds (mixed-phase and ice-only) from less cold precipitation (Supplementary Fig. 17b and Supplementary Data 23).
In summary, among all the MC3E sensitivity tests, the greatest increase in fractional contribution from warm components to the total precipitation is in the low CB/CCN and no-SIP simulations relative to the control run. This reflects the strong sensitivity of warm components of liquid and ice precipitation with respect to the cloud base temperature and multiple mechanisms of ice multiplication.
Sensitivity simulations for GoAmazon
In the “high CCN” simulation, Fig. 8a, b shows that the fractional contribution of the warm-rain process to the total surface precipitation is reduced to 43% at most in-cloud levels from 74% in the control run (see also Supplementary Data 24). This results from both decreasing cloud droplet size (less warm precipitation) and increasing cloud LWC (more cold precipitation) at most vertical levels (Supplementary Fig. 18a, c and Supplementary Data 25) relative to the control run. Moreover, the slightly increased mean size of ice crystals above the −10 °C level (Supplementary Fig. 18b) promotes an increase in the fractional contribution of the cold component to the total surface precipitation. Similarly, over convective (Supplementary Fig. 19a, b and Supplementary Data 26) and stratiform (Supplementary Fig. 20a, b and Supplementary Data 27) regions, the high CCN simulation shows a reduction in the fractional contribution (and in the absolute contribution; see Supplementary Fig. 21a–c and Supplementary Data 28) of the warm rain to the total surface precipitation.

The pie chart shows the fractional contribution of the warm (red) and cold (blue) components to the total surface precipitation during GoAmazon case. a When simulation is run under control; b when CCN loading is increased (High CCN); c when solid aerosol loading is increased (High Dust); d when SIP is switched off (no-SIP).
In the “high dust” simulation, the fractional contribution of warm components to the total surface precipitation decreased to 56% from 74% in the control run (Fig. 8a, c). This moderate decrease is attributed similarly to the reduced cloud droplet size and increased cloud LWC.
Curiously, in the no-SIP simulation, the fractional contribution of the warm-rain process to the total surface precipitation in this tropical case is boosted to 94% from 74% in the control run. This increase in the warm-rain process is due to fewer ice crystals allowing more supercooled liquid aloft for riming growth of the warm-graupel and hence warm-rain when it melts. Evidently, SIP aloft influences surface rainfall in the tropics.
Discussion and conclusions
The present study assesses how the warm-rain and ice crystal (cold-rain) processes drive surface precipitation for three different observed convective storms—STEPS (cold-based convective clouds), MC3E (slightly warm-based convective clouds), and GoAmazon (very warm-based convective clouds) using AC. The simulations of each case were validated against aircraft, satellite and ground-based observations (see Supplementary information and other studies31,41) for diverse cloud-microphysical (e.g., ice particle number concentrations, LWC, droplet concentrations) and cloud-dynamical (e.g., vertical velocity statistics) properties, aerosol conditions (e.g., CCN and IN activity) and domain-wide thermodynamical properties.
The conclusions are as follows:
-
1.
The ice crystal process prevails for the cloud properties aloft in control simulations of two of the cases (STEPS and MC3E) of deep convection, even though one of them is slightly warm-based (MC3E), whereas the warm-rain process dominates cloud properties for the tropical control simulation (GoAmazon):
-
a.
In STEPS and MC3E, the cold components of precipitation aloft are more prominent by almost one and two orders of magnitude, respectively, relative to the corresponding warm components, for both mass and number mixing ratios of graupel and rain. By contrast, in the tropical GoAmazon case, the warm components of precipitation at most cloudy levels, for graupel and rain, are increased by one or two orders of magnitude relative to corresponding cold components.
-
b.
With STEPS and MC3E, the cloud base (about 1 °C & 17 °C, respectively) is not warm enough to allow the mean droplet diameter (\(\ll\) ~ 15 μm) to approach the threshold size (~20–25 μm) for coalescence given the continental aerosol conditions. The ice crystal process is strengthened by the long-lived stratiform clouds from convective outflows, especially in MC3E.
-
c.
In GoAmazon, the warm-rain process is strengthened by the very warm cloud base (~28 °C) and by maritime CCN conditions (~500 cm−3 at a supersaturation of 1% near MSL), which boosts the mean cloud droplet size to around 27 μm at most cloudy levels aloft.
-
a.
-
2.
For the STEPS and MC3E control simulations, about 80% of accumulated surface precipitation over the entire mesoscale domain is from the ice crystal process. Only 20% is from the warm-rain process. The same happens in each of the convective and stratiform regions. By contrast, in the GoAmazon case, the warm-rain process (~70%) dominates the accumulated surface precipitation over the entire mesoscale domain, and also over the convective and stratiform regions individually.
-
3.
All sensitivity tests reveal a tendency for both types of precipitation to compete (within a given mesoscale cloud ensemble), such that one increases at the expense of the other, in absolute and fractional amounts of surface precipitation (Fig. 9, highlighting findings related to the STEPS control & low CB/CCN simulations):
-
a.
Lowering of cloud base, by about 18 K in STEPS and 11 K in MC3E, towards warmer levels near the ground increases the fractional and absolute contributions from warm components of surface precipitation. A moister lower troposphere promotes condensational growth of cloud droplets aloft and coalescence. This change causes warm components to comprise about half of the total surface precipitation in STEPS and MC3E. The mean cloud droplet size, ice crystal size, LWC, IWC, and cloud cover are all perturbed by about ±10–30% at subzero levels.
-
b.
In STEPS and MC3E, the reduction in CCN and IN concentrations towards maritime aerosol conditions only weakly enhances (<10%) the fractional and absolute contributions of warm components to the surface precipitation. This lack of response is due to the dominance of the ice crystal process and the role of SIP.
-
c.
In STEPS and MC3E cases, when both cloud base height and CCN concentrations are reduced together, there was the greatest increase in fractional contributions from warm components to the surface precipitation, namely by 53% (from about 20% in control to ~73%) over stratiform regions in STEPS and similarly over convective regions in MC3E, out of all the sensitivity tests performed.
-
d.
When all four mechanisms of SIP are switched off, the total surface precipitation is boosted by ~110% in STEPS, ~25% in MC3E, and ~35% in GoAmazon at the end of the simulation. The fractional contribution from warm components to the surface precipitation over the entire mesoscale domain is enhanced by almost 30% (from about 24% in control to 54%) in MC3E, 6% (from about 19% in control to 25%) in STEPS, and 20% in GoAmazon relative to control runs. When the warm-rain process is active, its activity is reduced by inclusion of ice multiplication, depleting supercooled cloud-liquid and weakening the warm components of rain and graupel/hail, whereas the ice crystal process is strengthened. (Note that in the real atmosphere, secondary ice production is always present in deep cold precipitating clouds. The purpose of this idealized test was merely to analyze causation.)
-
e.
In the tropical GoAmazon case, enhancement of CCN and solid aerosol concentrations towards polluted aerosol conditions reduced the fractional and absolute contributions of warm-rain to the total surface precipitation, both domain-wide and over convective and stratiform regions. This occurs due to smaller cloud droplets and a weaker LWC aloft.
Fig. 9: Schematic highlighting various cloud microphysical and precipitation processes in a cold-based convective storm. 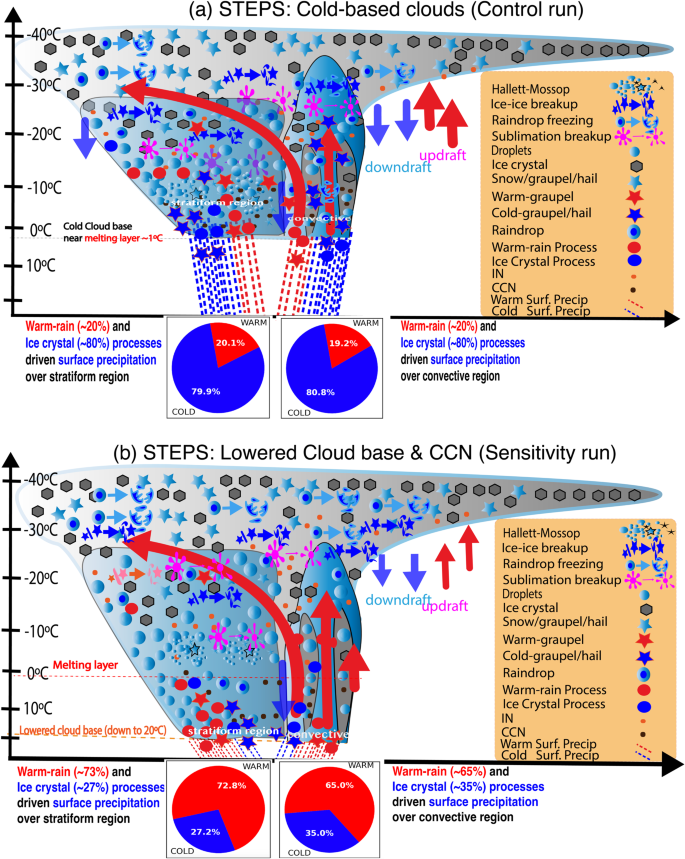
a The schematic describes the control simulation of cold-based mesoscale system as in STEPS case (cloud base at ~1 °C). Two pie charts at the bottom are shown for warm-rain and ice-crystal processes governing surface precipitation over stratiform and convective regions. In the control run, ice crystal process primarily contributes to the ground precipitation over both these regions. b Same as (a) but for lowered cloud base and CCN (Low CB/CCN) sensitivity simulations for STEPS. In this sensitivity simulation, the schematic shows that the majority of the ground precipitation has now been switched to the warm-rain process. The warm-rain process (e.g., melting of warm-graupel) is indicated by solid red dot. Similarly, the ice crystal process (e.g., melting of cold-graupel and snow) is depicted by solid blue dot.
-
a.

Even though the treatment of the cloud microphysical processes such as warm-rain and ice crystal microphysical processes are advanced in the AC model, our results are subject to a few important limitations. First, use of periodic lateral boundary conditions and a 1-D sounding to initialize the model together prevent the prediction of exact locations, dimensions and other magnitudes of specific clouds. Therefore, our simulations are idealized, and results are limited to domain-wide statistics of cloud properties and the relative roles of the warm-rain versus ice crystal processes.
Second, many diverse microphysical, dynamical, and macrophysical properties of the cloud system simulated by AC were validated against coincident field campaign observations (Supplementary Table 1). This was done by considering the measurement and sampling uncertainties of the observations. It revealed adequate agreement between simulated and observed quantities. For instance, for testing the microphysical pathways associated with precipitation processes in a natural atmosphere45,46, we validated the microphysical quantities such as total graupel (“warm-graupel” + “cold-graupel”) and total rain (“warm-rain” + “cold-rain”) from our AC model. The essential precipitation type from the ice crystal process was snow, which was validated in terms of the number concentration of ice particles > 0.2 mm in all three cases and the particle size distribution of snow observed by aircraft in STEPS31. However, inevitably it was not possible to validate the tagged warm and cold components of the rain and graupel associated with the warm-rain and ice crystal processes as there are no observations of such properties, which is a limitation of our study.
Third, one area of observational uncertainty is related to the vertical velocity statistics from aircraft measurements. They are biased by sampling uncertainty due to factors such as particular flight strategies, with preferential sampling of stratiform outflow from convection in GoAmazon (Supplementary Fig. 6c) and errors can arise from flight maneuvers. We have tried to account for sampling uncertainty and other errors of ascent measurements with error bars (±30%) on the observational points in the validation plots (Supplementary Fig. 6a–c). Consequently, validation of vertical velocity statistics has limitations due to this uncertainty, and it is possible for the simulation to produce convection that is either slightly too vigorous or slightly too weak. If so, this might conceivably then create similarly limited biases in the microphysical species of the simulated precipitation and cloud contents.
Fourth, the idealized simulation at 1–2 km horizontal resolution could artificially dilate clouds that that are finer than this in nature. But the statistical properties of clouds, which are studied in the present study, are largely insensitive to changes in such resolution47. Furthermore, a 15% change in mean updraft strength when resolution is altered from 2 to 0.25 km48, has minimal impact on cloud-related statistics (Supplementary Fig. 22 and Supplementary Data 29). So our choice of resolution is not an issue.
Nonetheless, given all of the above limitations, our main conclusion of the predicted dominance of the warm- versus cold-precipitation in the three contrasting storms remains valid.
Some of our detailed simulations, such as those with a low cloud base and maritime CCN concentrations, show that surface precipitation and graupel/hail aloft can be dominated by the warm-rain process, even though there is plenty of ice aloft. This happens due to raindrop freezing (from the warm-rain process) almost instantly generating graupel, circumventing the lengthy vapor growth of crystals to snow followed by riming to graupel (ice crystal process). This is consistent with earlier modeling15. Also, coalescence occurs earlier and closer to the ground during deep cloudy ascent while crystals only appear later at subzero levels.
The assumption is made in some satellite-based and global modeling studies that surface precipitation is cold merely because ice is present somewhere aloft in the cloudy column19,20. Both the validated GoAmazon control simulation, and sensitivity experiments in STEPS and MC3E cases with lowering of the cloud base, all indicate that such an assumption is not universally valid because in these cases ice is always present somewhere aloft in deep convection even when warm-rain accounts for a considerable fraction of precipitation at the surface. Arguably, such an assumption is tantamount to assuming that deep convection worldwide can never produce surface precipitation dominated by warm-rain, since typically deep convection will always have ice somewhere aloft, such as in the cirriform anvil outflows from convective cores.
Identification of warm and cold components of surface precipitation, and the role of various physical processes in influencing them, is important for reducing the uncertainties in global climate models. Our simulations presented here indicate a central role of raindrop freezing as a source of precipitation associated with the warm-rain process, namely warm-graupel: graupel is uniquely efficient at accreting liquid as it falls fast and has a wide cross-sectional area from a low bulk density17.
This study pioneers the use of passive tagging tracer techniques to elucidate the competition between warm-rain and ice crystal processes in the formation of surface precipitation. Passive tagging tracers techniques could be useful for global climate models and NWP models, in predicting these warm and cold types of surface precipitation.
Methods
Passive tagging tracers techniques for identifying the components from warm-rain and ice crystal processes
In the AC model, all the hydrometeors’ species are characterized by gamma size distributions, and also the advection and diffusion are treated with a double moment bulk approach, while microphysical processes are treated with a bin-microphysics approach27,28,29,30,31,32,33,34.
Warm-rain process tendencies
In nature, the conversion of cloud liquid to rain occurs by coalescence and depends on the mean droplet size implied by the predicted droplet number and on the dispersion of droplet size distribution49,50,51,52,53,–54. According to Kogan51, the updated parametrization of autoconversion suitable for deep convection, is given as:
Here, \(\frac{d{q}_{r}}{dt}({{{{{\rm{kg}}}}}}\,{{{{{{\rm{kg}}}}}}}^{-1}{{{{{{\rm{s}}}}}}}^{-1})\) is the conversion tendencies for the cloud liquid mixing ratio; \({q}_{w}({{{{{\rm{kg}}}}}}\,{{{{{{\rm{kg}}}}}}}^{-1})\) is the cloud liquid mixing ratio; \({N}_{w}({{{{{{\rm{cm}}}}}}}^{-3})\) is the cloud drop concentration. Terminology of \({A}_{u}({q}_{r};{q}_{w}|{q}_{w})\) and other related terms are described in Table 1 below.
Components from the warm-rain process (denoted by subscript “warm”) and ice crystal process (denoted by subscript “cold”) of precipitation production are evaluated using passive tagging tracers for rain and graupel.
In a slightly warm-based cloud, the conversion of cloud water to rain and melting of graupel can contribute to the warm-rain process of precipitation55,56,57. Identification of the warm-rain components of graupel and rain prognostic variables are tracked as follows:
The positive signs in Eqs. (2) and (3) represent the source terms, whereas the negative signs indicate the sink terms. Table 1 describes the above symbols used for different microphysical conversion terms. AC uses passive tagging tracer techniques, enabling to estimate the precipitation types. The\(\,{\varUpsilon }_{r\_warm}\) and \({\varUpsilon }_{g\_warm}\) are defined as:
Here, \({\varUpsilon }_{g\_warm}\) is the warm fraction of the graupel component and \({\varUpsilon }_{r\_warm}\) is the warm fraction of the rain component.
The details of these microphysical conversion terms can be found below in Table 1, and some of these terms are also described in Phillips27,32.
Ice crystal process tendencies
The ice crystal process drives precipitation production if the cloud base is not too warm, depending on the aerosol conditions. The various microphysical processes associated with the growth of ice crystals to snow (through aggregation and vapor growth) and to graupel (“cold-graupel”) by riming contribute to the production of “cold” precipitation. For instance, the melting associated with snow and cold graupel which originate from ice crystals (Fig. 1) contributes to cold rain production32,47. These processes are also highlighted in Fig. 1.
Similar to the rain and graupel diagnostic variables in the warm-rain process, we have characterized tendencies equations related to the cold components of mass mixing ratio. These are:
Similar to Eqs. (2) and (3), the positive signs in Eqs. (6) and (7) represent the source terms, whereas the negative signs indicate the sink terms. The \(\,{\varUpsilon }_{r\_cold}\) and \({\varUpsilon }_{g\_cold}\) are defined as:
Here, \({\varUpsilon }_{g\_cold}\) is the cold fraction of the graupel component and \({\varUpsilon }_{r\_cold}\) is the cold fraction of the rain component. The equations relating to number mixing ratios associated with cold components of rain and graupel described are described below.
Similarly, there are tendency equations for the evolution of number mixing ratios (in kg−1 s−1) of warm and cold components of rain and graupel in AC.
Overview of aerosol-cloud (AC) model
The aerosol-cloud (AC) model is developed by coupling the representations of cloud microphysics (hybrid bin/bulk; two-moment) together with interactive radiation and semi-prognostic aerosol schemes by Phillips and his team16,27,28,29,30,31,32,33,34,35 within the framework of the Weather Research and Forecasting (WRF37) Model. AC entirely utilizes this in-house developed cloud microphysics scheme, a prognostic aerosol scheme, and GFDL radiation scheme36. Other schemes, such as dynamics, subgrid-scale mixing, the planetary boundary layer, and the surface layer, are employed in AC from WRF37.
In AC, hydrometeor species represented are cloud droplets, rain, cloud ice crystals, graupel/hail and snow, and aerosol species are sulfate, sea salt, black carbon, mineral dust, primary biological particles, soluble organics and non-biological insoluble organics32. This model can predict the droplet initiation from aerosol conditions both at the cloud base and in-cloud. Both primary ice initiation, through heterogeneous nucleation by IN activity of solid aerosols or by spontaneous homogeneous freezing of cloud-liquid (colder than about -36 °C) and aerosols, and four types of secondary ice initiation (rime-splintering, sublimational breakup, breakup in ice-ice collisions and two modes of raindrop-freezing fragmentation) are represented in the convective storm29,30,31,35. Numerous advanced modifications within cloud and aerosol microphysical processes (Phillips27,28,29,30,31,32,33,34,35) are implemented.
Various field observations, such as KWAJEX, CEPEX, TOGA COARE, STEPS, and MC3E have been used to validate AC during model development30,31,35. For instance, the sticking efficiency scheme of Phillips29 found that coagulation in ice-ice collisions is governed by the energy conservation principle. In recent years, emphasis has been on the innovation of new schemes for secondary ice productions30,31,35. Phillips30 discussed the physical formulation of the breakup of colliding ice particles in a convective storm (observed for the STEPS case) based on an energy conservation approach.
Description and experimental setup: STEPS—cold-based convective storm
Major downburst events during the STEPS campaign were reported on 19 June 200031,38. The sounding profile for the STEPS on 19 June 2000 at 23:45 UTC is shown in Supplementary Fig. 1. This event on 19 June forms the first case study, where convective clouds with a cloud base near 1 °C (~4–5 km altitude above MSL, with the terrain height at ~1.3 km above MSL; Supplementary Fig. 1) were observed over the Kansas–Colorado border38.
Three-dimensional simulations are performed for a convective line spanning a horizontal area of 80 km by 80 km wide, with the convective core moving along a track through Goodland. We simulated the STEPS case for two and half hours (23:45 UTC 19 June–02:15 UTC 20 June 2000), with a time step of 10 seconds. The horizontal grid spacing is 1 km, and the vertical resolution is 0.5 km. In the model, the x-axis points in the direction of 70° north with the convective line parallel to the y-axis. Initialization of convection in AC was achieved using eight cold, dry air bubbles (each separated horizontally by 10 km and put 10 km apart) with maximum perturbations of moisture and temperature of 2 kg−1 and 3 K. Many smaller warmer bubbles with random horizontal radii were introduced, which were superimposed on the cold bubbles. Phillips31,32 describe more about the STEPS model set up and validation (therein Figs. 1–3 in Phillips31).
MC3E: slightly warm-based convective storm
The MC3E field campaign took place during April-June 2011 in Northern Oklahoma and surrounding regions for the study of convective life cycle and precipitation processes (Jensen39). An extensive warm-season mesoscale convective system (MCS) was observed during 10–13 May 2011 with the use of ground-based (e.g., RADAR) and aircraft-based instruments (e.g., 2D cloud imaging probe, high-volume precipitation spectrometer). The MCS during this period was ~150 km wide, extending from Eastern Colorado to Western Texas. The availability of low-level moisture along with the high CAPE (>4000 J kg−1; Supplementary Fig. 2) on 11 May (~16–22 UTC) helped in developing a MCS (Supplementary Fig. 2). This storm on 11 May 2011 brought intense convective precipitation augmented by widespread rain from stratiform clouds58.
The comprehensive observation of the MCS event is simulated for the domain covering an area of 80 km x 80 km with a horizontal grid spacing of 2 km and a vertical resolution of about 0.5 km. The moisture perturbations are applied in the lowest 2 km during initialization. The time step was 10 s. The boundary conditions were doubly periodic in the horizontal plane. The large-scale advective forcings of heat and moisture were applied from MC3E observations. We use hourly data for the large-scale forcing and surface fluxes of heat and moisture interpolated to the model levels to maintain convection in the MC3E simulation. The duration of the simulation was 72 h (10 May–13 May 2011). The simulation of the convective event during 10–13 May 2011 was initialized from the observed sounding of temperature, humidity, and wind39.
The thermodynamic structure of the sounding and the aerosol conditions contrasted between both STEPS and MC3E cases, such that the dryness of the lower troposphere in STEPS created a cold cloud base. This would be expected to favor the ice crystal process. The normalized CCN concentration (supersaturation of 1%) was observed to be about 1000–2000 cm−3 at 1–3 km MSL in STEPS, and 2000–2500 cm−3 in MC3E near the ground. The warm-rain process is controlled by average cloud droplet size and is promoted by the cloud base implied by the sounding being ~17 °C in MC3E (Supplementary Fig. 2), but the more numerous CCN solute aerosol slightly counteracts this by reducing the tendency towards larger cloud droplets, relative to STEPS (cloud base of ~1 °C).
GoAmazon: very warm-based convective storm
In the third case study, we simulated a convective line of very warm-based convective clouds observed during the GoAmazon campaign on 19 March 2014. This simulation lasted for 14 h starting at 05:00 UTC. Balloon-borne sounding observations at the T3 site (3.2133°S, 60.5987°W) and S-band radar observations at the T1p site (3.1461°S, 59.9864°W) show that the convective line occurred near the eastern part of the Amazon basin with a north-easterly wind propagating from the South Atlantic into the basin40.
The sounding profile of GoAmazon case at 05:00 UTC on 19 March 2014 is shown in Supplementary Fig. 3. The CAPE (~5000 J kg−1; Supplementary Fig. 3) was high and similar to the MC3E, which supported the development of convective line. The cloud base was at ~28 °C and with 500 CCN cm−3 at 1% supersaturation.
The simulation of the GoAmazon is carried out for the wide 3D domain of 320 km (zonal) × 80 km (meridional) × 40 km (vertical) with the zonal/meridional grid spacing of 2 km and a vertical resolution of about 0.5 km. The simulation time step was 10 s with the doubly periodic boundary conditions in the horizontal plane. The initialization of convection for GoAmazon case in AC was realized using cold, dry air bubbles (each separated horizontally by 10 km and put 10 km apart) with the maximum perturbations of moisture and temperature similar to that of in STEPS.
Description of sensitivity experiments for STEPS and MC3E
The low CB simulation was conducted by lowering cloud base without altering the in-cloud ascent statistics (Supplementary Methods). This isolates the microphysical effects from the warmer temperature of cloud base (e.g., higher adiabatic LWC aloft) in the analysis. Note that in nature, cloud-bases can be lower due to the lower troposphere being either cooler (higher relative humidity) or moister (higher absolute humidity), causing slower or faster in-cloud ascent aloft respectively. There is no simple correspondence between cloud-base height and in-cloud ascent aloft in reality.
For no-SIP sensitivity simulations, the four secondary ice formation mechanisms were prohibited. These include breakup in ice–ice collisions (mechanical breakup27,30), rime splintering6, fragmentation of freezing rain/drizzle by Modes 1 and 2 (raindrop freezing fragmentation16), and sublimation breakup35.
Data availability
The STEPS sounding datasets are freely available from https://data.eol.ucar.edu/project/STEPS. The MC3E ground-based (and aircraft-based) dataset are also freely available and can be obtained using https://ghrc.nsstc.nasa.gov/hydro/details/gpmcmmc3e. The field observational datasets for the GoAmazon can be obtained from https://www.arm.gov/research/campaigns/amf2014goamazon. Underlying data (Supplementary Data 1–29) related to the manuscript and supplementary information generated using AC are publicly available at Gupta59.
Code availability
The primary AC model is based on WRF436 (https://github.com/wrf-model/WRF/releases) with various modifications in microphysics scheme developed over many years by Phillips27,28,29,30,31,32,33,34,35. All the figures (including Supplementary Figures) are originally produced and plotted using various open-source python libraries (e.g., https://matplotlib.org/stable/). The AC model based processed data (Supplementary Data 1–29) are also publicly available at Gupta59.
References
Sherwood, S. C. et al. An assessment of Earth’s climate sensitivity using multiple lines of evidence. Rev. Geophys. 58, e2019RG000678 (2020).
O’Gorman, P. A. Precipitation extremes under climate change. Curr. Clim. Chang. Rep. 1, 49–59 (2015).
Zhang, Y. & Fueglistaler, S. Mechanism for increasing tropical rainfall unevenness with global warming. Geophys. Res. Lett. 46, 14836–14843 (2019).
Warner, J. A reduction in rainfall associated with smoke from sugar-cane fires—an inadvertent weather modification? J. Appl. Meteorol. Climatol. 7, 247–251 (1968).
Liu, J. Y. & Orville, H. D. Numerical modeling of precipitation and cloud shadow effects on mountain-induced cumuli. J. Atmos. Sci. 26, 1283–1298 (1969).
Hallett, J. & Mossop, S. C. Production of secondary ice particles during the riming process. Nature 249, 26–28 (1974).
Twomey, S. The nuclei of natural cloud formation. Part I: The chemical diffusion method and its application to atmospheric nuclei. Geofis. Pura Appl. 43, 227–242 (1959).
Albrecht, B. A. Aerosols, cloud microphysics, and fractional cloudiness. Science. 245, 1227–1230 (1989).
Williams, E. & Stanfill, S. The physical origin of the land–ocean contrast in lightning activity. Comptes Rendus Phys. 3, 1277–1292 (2002).
Khain, A., Pokrovsky, M. P., Seifert, A. & Phillips, V. T. J. Simulation of effects of atmospheric aerosols on deep turbulent convective clouds using a spectral microphysics mixed-phase cumulus cloud model. Part I: Model description and possible applications. J. Atmos. Sci. 61, 2963–2982 (2004).
Williams, E. et al. The drought of the century in the Amazon Basin: an analysis of the regional variation of rainfall in South America in 1926. Acta Amazonica 35, 231–238 (2005).
Bringi, V. N. et al. Evolution of a Florida thunderstorm during the Convection and Precipitation/Electrification Experiment: the case of 9 August 1991. Mon. Weather Rev. 125, 2131–2160 (1997).
Hallett, J., Sax, R. I., Lamb, D. & Murty, A. S. R. Aircraft measurements of ice in Florida cumuli. Q. J. R. Meteorol. Soc. 104, 631–651 (1978).
Phillips, V. T. J. et al. The glaciation of a cumulus cloud over New Mexico. Q. J. R. Meteor. Soc. 127, 1513–1534 (2001).
Phillips, V. T. J., Choularton, T. W., Blyth, A. M. & Latham, J. The influence of aerosol concentrations on the glaciation and precipitation production of a cumulus cloud. Q. J. R. Meteor. Soc. 128, 951–971 (2002).
Phillips, V. T. J., Patade, S., Gutierrez, J. & Bansemer, A. Secondary ice production by fragmentation of freezing drops: formulation and theory. J. Atmos. Sci. 75, 3031–3070 (2018).
Johnson, D. B. On the relative efficiency of coalescence and riming. J. Atmos. Sci 44, 1671–1680 (1987).
Phillips, V. T. J. et al. Anvil glaciation in a deep cumulus updraught over Florida simulated with the explicit microphysics model. I: Impact of various nucleation processes. Q. J. R. Meteorol. Soc. 131, 2019–2046 (2005).
Mülmenstädt, J., Sourdeval, O., Delanoë, J. & Quaas, J. Frequency of occurrence of rain from liquid‐, mixed‐, and ice‐phase clouds derived from A‐Train satellite retrievals. Geophys. Res. Lett. 42, 6502–6509 (2015).
Field, P. R. & Heymsfield, A. J. Importance of snow to global precipitation. Geophys. Res. Lett. 42, 9512–9520 (2015).
Morrison, H. C., Curry, J. A. & Khvorostyanov, V. I. A new double-moment microphysics parameterization for application in cloud and climate models. Part I: Description. J. Atmos. Sci. 62, 1665–1677 (2005).
Morrison, H., Thompson, G. & Tatarskii, V. Impact of cloud microphysics on the development of trailing stratiform precipitation in a simulated squall line: comparison of one-and two-moment schemes. Mon. Weather Rev. 137, 991–1007 (2009).
Lin, Y. & Colle, B. A. The 4–5 December 2001 IMPROVE-2 event: observed microphysics and comparisons with the Weather Research and Forecasting model. Mon. Weather Rev. 137, 1372–1392 (2009).
Khain, A. P., Phillips, V. T. J., Benmoshe, N. & Pokrovsky, A. The role of small soluble aerosols in the microphysics of deep maritime clouds. J. Atmos. Sci. 69, 2787–2807 (2012).
Milbrandt, J. A. & Yau, M. K. A multimoment bulk microphysics parameterization. Part I: Analysis of the role of the spectral shape parameter. J. Atmos. Sci. 62, 3051–3064 (2005a).
Milbrandt, J. A. & Yau, M. K. A multimoment bulk microphysics parameterization. Part II: A proposed three-moment closure and scheme description. J. Atmos. Sci. 62, 3065–3081 (2005b).
Phillips, V. T. J., Donner, L. J. & Garner, S. T. Nucleation processes in deep convection simulated by a cloud-system-resolving model with double-moment bulk microphysics. J. Atmos. Sci. 64, 738–761 (2007).
Phillips, V. T. J., Khain, A., Benmoshe, N. & Ilotoviz, E. Theory of time-dependent freezing. Part I: Description of scheme for wet growth of hail. J. Atmos. Sci. 71, 4527–4557 (2014).
Phillips, V. T. J., Khain, A., Benmoshe, N., Ilotoviz, E. & Ryzhkov, A. Theory of time-dependent freezing. Part II: Scheme for freezing raindrops and simulations by a cloud model with spectral bin microphysics. J. Atmos. Sci. 72, 262–286 (2015).
Phillips, V. T. J., Yano, J. I. & Khain, A. Ice multiplication by breakup in ice–ice collisions. Part I: Theoretical formulation. J. Atmos. Sci. 74, 1705–1719 (2017a).
Phillips, V. T. J. et al. Ice multiplication by breakup in ice–ice collisions. Part II: Numerical simulations. J. Atmos. Sci. 74, 2789–2811 (2017b).
Phillips, V. T. J. et al. Multiple environmental influences on the lightning of cold-based continental cumulonimbus clouds. Part I: Description and validation of model. J. Atmos. Sci. 77, 3999–4024 (2020).
Phillips, V. T. J. et al. Potential impacts from biological aerosols on ensembles of continental clouds simulated numerically. Biogeosciences 6, 987–1014 (2009).
Patade, S. et al. The influence of multiple groups of biological ice nucleating particles on microphysical properties of mixed-phase clouds observed during MC3E. Atmos. Chem. Phys. 22, 12055–12075 (2022).
Deshmukh, A., Phillips, V. T. J., Bansemer, A., Patade, S. & Waman, D. New empirical formulation for the sublimational breakup of graupel and dendritic snow. J. Atmos. Sci. 79, 317–336 (2022).
Freidenreich, S. M. & Ramaswamy, V. A new multiple-band solar radiative parameterization for general circulation models. J. Geophys. Res. 104, 31389–31410 (1999).
Skamarock, W. C. et al. A description of the advanced research WRF model version 4. NCAR Rep. 145, 145–500 (2019).
Lang, T. J. et al. The severe thunderstorm electrification and precipitation study. Bull. Am. Meteorol. Soc. 85, 1107–1126 (2004).
Jensen, M. P. et al. The Midlatitude Continental Convective Clouds Experiment (MC3E). Bull. Am. Meteorol. Soc. 97, 1667–1686 (2016).
Martin, S. T. et al. Introduction: observations and modeling of the Green Ocean Amazon (GoAmazon2014/5). Atmos. Chem. Phys. 16, 4785–4797 (2016).
Waman, D. et al. Dependencies of four mechanisms of secondary ice production on cloud top temperature in a continental convective storm. J. Atmos. Sci. 79, 3375–3404 (2022).
Pruppacher, H. R. & Klett, J. D. Microphysics of Clouds and Precipitation 2nd edn (Oxford Press, 1997).
Li, G., Wang, Y., Lee, K. H., Diao, Y. & Zhang, R. Impacts of aerosols on the development and precipitation of a mesoscale squall line. J. Geophys. Res. Atmos. 114, D17 (2009).
Rogers, R. R. & M. K. Yau. A Short Course of Cloud Physics 2nd edn (Elsevier, 1989).
Song, H. J., Sohn, B. J., Hong, S. Y. & Hashino, T. Idealized numerical experiments on the microphysical evolution of warm‐type heavy rainfall. J. Geophys. Res. Atmos. 122, 1685–1699 (2017).
Gao, W. et al. A study of the fraction of warm rain in a pre-summer rainfall event over South China. Atmos. Res. 262, 105792 (2021).
Pauluis, O. & Garner, S. Sensitivity of radiative–convective equilibrium simulations to horizontal resolution. J. Atmos. Sci. 63, 1910–1923 (2006).
Prein, A. F., Rasmussen, R. M., Wang, D. & Giangrande, S. E. Sensitivity of organized convective storms to model grid spacing in current and future climates. Philos. Trans. R. Soc. A 379, 2195–20190546 (2021).
Chisnell, R. F. & Latham, J. Multiplication of ice particles in slightly supercooled cumulus. J. Atmos. Sci. 32, 863–866 (1975).
Khairoutdinov, M. & Kogan, Y. A new cloud physics parameterization in a large-eddy simulation model of marine stratocumulus. Mon. Weather Rev. 128, 229–243 (2000).
Kogan, Y. A cumulus cloud microphysics parameterization for cloud-resolving models. J. Atmos. Sci. 70, 1423–1436 (2013).
Tripoli, G. J. & Cotton, W. R. A numerical investigation of several factors contributing to the observed variable intensity of deep convection over south Florida. J. Appl. Meteorol. Climatol. 19, 1037–1063 (1980).
Pawlowska, H. & Brenguier, J. L. An observational study of drizzle formation in stratocumulus clouds for general circulation model (GCM) parameterizations. J. Geophys. Res. Atmos. 108, D15 (2003).
Seifert, A. & Beheng, K. D. A two-moment cloud microphysics parameterization for mixed-phase clouds. Part 1: Model description. Meteorol. Atmos. Phys. 92, 45–66 (2005).
Blyth, A. M. & Latham, J. Development of ice and precipitation in New Mexican summertime cumulus clouds. Q. J. R. Meteorol. Soc. 119, 91–120 (1993).
Koenig, L. R. The glaciating behavior of small cumulonimbus clouds. J. Atmos. Sci. 20, 29–47 (1963).
Blyth, A. M., Benestad, R. E. & Krehbiel, P. R. Observations of supercooled raindrops in new Mexico Summertime Cumuli. J. Atmos. Sci. 54, 569–575 (1997).
Tian, J., Dong, X., Xi, B., Williams, C. R. & Wu, P. Estimation of liquid water path below the melting layer in stratiform precipitation systems using radar measurements during MC3E. Atmos. Meas. Tech. 12, 3743–3759 (2019).
Gupta, A. K. et al. The microphysics of the warm-rain and ice crystal processes of precipitation in simulated continental convective storms. zenodo. https://doi.org/10.5281/zenodo.8063415 (2023).
Acknowledgements
V.T.J.P., J.A.M., and F.L.T.G. obtained the funding from the Crafoord Foundation (award number: 20180783) to support first author during his postdoctoral tenure at Lund University. The work was directed and planned by VTJP at Lund University. Other authors were supported by awards to V.T.J.P. from the Swedish Research Council for Sustainable Development (“FORMAS” Award 2018-01795), Sweden’s Innovation Agency (Vinnova; grant no. 2020-03406), and the U.S. Department of Energy Atmospheric Sciences Research Program (Award DE-SC0018932). The topics of these awards concern mechanisms for ice production in clouds. We thank STEPS, MC3E, and GoAmazon campaign group and ARM for providing the public access to these campaign datasets. We also thank Editor Clare Davis and three reviewers (two anonymous reviewers and Wenhua Gao) for their constructive comments and feedback.
Funding
Open access funding provided by Lund University.
Author information
Authors and Affiliations
Contributions
A.K.G. developed the passive tagging tracers codes with V.T.J.P. for tracking the warm-rain and ice crystal processes originating the precipitation aloft and at the ground. V.T.J.P. and A.K.G. contributed to conceptual development of this work. A.K.G. drafted the original manuscript. The manuscript was edited by A.K.G. and V.T.J.P. and reviewed by all co-authors. V.T.J.P., A.K.G., A.D., D.W., S.P., and A.J. participated in setting up the STEPS, MC3E, and GoAmazon simulations. A.B., J.A.M., and F.L.T.G. participated in science discussion and reviewed the manuscript and provided the field campaign data.
Corresponding author
Ethics declarations
Competing interests
The authors declare no competing interests.
Peer review
Peer review information
Communications Earth & Environment thanks Wenhua Gao and the other, anonymous, reviewer(s) for their contribution to the peer review of this work. Primary handling editor: Clare Davis.
Additional information
Publisher’s note Springer Nature remains neutral with regard to jurisdictional claims in published maps and institutional affiliations.
Supplementary information
Rights and permissions
Open Access This article is licensed under a Creative Commons Attribution 4.0 International License, which permits use, sharing, adaptation, distribution and reproduction in any medium or format, as long as you give appropriate credit to the original author(s) and the source, provide a link to the Creative Commons license, and indicate if changes were made. The images or other third party material in this article are included in the article’s Creative Commons license, unless indicated otherwise in a credit line to the material. If material is not included in the article’s Creative Commons license and your intended use is not permitted by statutory regulation or exceeds the permitted use, you will need to obtain permission directly from the copyright holder. To view a copy of this license, visit http://creativecommons.org/licenses/by/4.0/.
About this article

Cite this article
Gupta, A.K., Deshmukh, A., Waman, D. et al. The microphysics of the warm-rain and ice crystal processes of precipitation in simulated continental convective storms. Commun Earth Environ 4, 226 (2023). https://doi.org/10.1038/s43247-023-00884-5
Received:
Accepted:
Published:
DOI: https://doi.org/10.1038/s43247-023-00884-5
Comments
By submitting a comment you agree to abide by our Terms and Community Guidelines. If you find something abusive or that does not comply with our terms or guidelines please flag it as inappropriate.
