
Abstract
Scrutinizing the evolving exposure and possible consequent forthcoming seismic losses in rapidly urbanizing megacities is essential for decision-makers. Here we present a framework for the evaluation of spatio-temporal seismic loss dynamics where we propose a probabilistic macro-level loss estimation approach that is based on socioeconomic exposure indicators. We follow this framework to model the urban growth, disaggregate population to urban cells, and estimate grid-level wealth in three Asian megacities, namely Jakarta, Metro Manila, and Istanbul. Then, we calculate present and future probabilistic risk metrics based on the combination of evolving exposure, probabilistic seismic hazard analysis and vulnerability curves. The results reveal that our approach can produce present loss estimates that are in the same order of magnitude as the conventional approaches. The predictions suggest that present average annual loss could increase almost twofold in Jakarta and in Metro Manila, and by almost 57% in Istanbul by 2030. Our framework can be used to trigger discussions between scientific community and decision-makers for better long-term risk reduction and risk awareness strategies.
Introduction
In 2015, the United Nations Office for Disaster Risk Reduction (UNDRR) defined one of the main targets of Sendai Framework for Disaster Risk Reduction (SFDRR) as reducing the direct disaster economic loss in relation to Gross Domestic Product (GDP) by 20301. Yet, after the evaluation of 80 open-access disaster risk assessment tools by World Bank’s Global Facility for Disaster Reduction and Recovery (GFDRR), it was reported that none of them could make future projections2. Current risk assessment approaches generally consider quantitative risk assessments as static analyses which are performed at a certain time. However, data related to urban environment of fast-developing regions such as megacities quickly become outdated as a result of the rapid urban growth. Therefore, employing dynamic estimations of risk which reflect the pace of changes in cities can provide a more objective understanding of the path towards urban resilience3,4,5,6.
Assessment of seismic risk involves integration of seismological, engineering, and socioeconomic data7; thus, quantifying evolving risk is a complex task. Due to the nature of earthquakes, hazard component of seismic risk is less predictable when compared with weather-related hazards8. As a result of this, future predictions about vulnerability and exposure components are particularly substantial for dynamic seismic risk assessments. While previous studies have generally focused on weather-related hazards2,9,10,11,12,13,14, studies that focus on the evaluation of forthcoming seismic risk are rare2,5,6,8,15,16,17. To our knowledge, only a few of these studies5,6,16 have incorporated probabilistic seismic loss assessment. Moreover, although megacities have higher risk due to concentration of assets, people, and infrastructure, future risk assessment studies in the literature are generally national or regional level with lower spatial resolutions. In addition, some studies make purely temporal projections and ignore the spatial component of urban expansion which is an important driver of the forthcoming risk.
The conventional seismic loss estimation approaches that have been employed by most of the studies in the literature generally require a detailed inventory of exposed structures, which is usually not publicly available, especially in data-scarce developing countries. Therefore, the economic value of all physical assets exposed to hazards can be extremely difficult to compile18. Due to these limitations, several researchers18,19,20,21 have attempted to simplify these conventional approaches by developing macro-level approaches, which rely less on detailed inventories of structures, and more on readily available socioeconomic data (e.g., GDP, wealth, etc.) that can be used as a proxy for potential damage.
Since total values of the buildings and infrastructure, as well as deprivation in revenues due to interruption of business, are closely related to the economic productivity of a region, macro-level loss estimation methods use a holistic approach, with the assumption that potential losses caused by physical damage and business interruption could be attributed to the state of a region’s economy18,19. These approaches bypass the requirement of detailed building inventories in conventional methods, which may not be available for certain regions of the world, and instead they use macroscopic indices such as GDP and wealth to represent exposure. Macro-level methods generally combine seismic hazard, the relation between GDP and published historical earthquake loss data, population grids, and GDP per capita to estimate grid-level expected loss. GDP mainly measures the total output of goods and services for final use that is produced by residents and non-residents22. It is one of the socioeconomic indicators regularly compiled by various agencies and institutions, such as the World Bank, the World Resources Institute, and the United Nations; therefore, it has been considered as a suitable metric to be used as a measure of the economic condition of a community20,23.
The potential benefits of macro-level approaches which make them accessible and attractive are primarily their transparency, flexibility, and rapidity. They have been applied ex ante in risk assessment and disaster planning, and ex post for rapid estimation of losses to allocate resources in the aftermath of destructive earthquakes. Conventional methods can be considered as analytical approaches since they generally consider the vulnerability as defined by structural characteristics of the built environment. On the other hand, macro-level methods use empirical vulnerability functions that depend on historical earthquake loss data. In this study, we propose a probabilistic macro-level loss estimation approach building on previous research18,19,24 for which the details are given in the “Methods” section along with information on conventional methods. It is worth noting that macro-level approaches are simplistic and indicative, and they are not intended to replace the conventional loss estimation methods that are likely to have greater reliability. Instead, they can be considered as complementary instruments for decision-making processes to open discussions with authorities.
Thanks to the developments on open-source high-resolution data, macro-level approaches can be effectively used for the estimation of future seismic loss as well as the evaluation of spatio-temporal loss trends from present to future. However, to our knowledge, they have not yet been utilized for such an objective so far, while they are generally employed for the estimation of present loss. In addition, these approaches have not been used to estimate primary probabilistic risk metrics, such as average annual loss (AAL) and probable maximum loss (PML) which are widely used for communication of loss figures by government-level authorities and finance industry in resource allocation decisions.
Here we address these gaps and contribute to literature by:
-
Proposing a probabilistic macro-level seismic loss estimation approach by leveraging on the methods in the literature, utilizing wealth as a proxy of economic condition of a region,
-
Developing a systematic multi-step framework (Fig. 1) to evaluate the dynamics in probabilistic risk metrics (i.e., AAL and PML) from present to future using the proposed approach.
Fig. 1: Proposed framework for the estimation of present and future probabilistic seismic loss metrics using a macro-level approach. 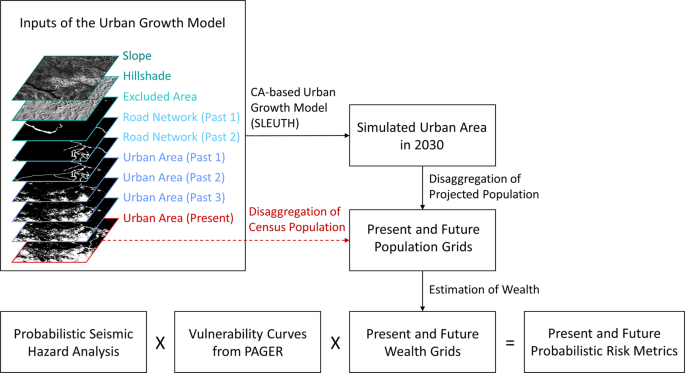
Inputs of the cellular automata (CA)-based urban growth model called SLEUTH are used to simulate the urban area in 2030. Present and future population are disaggregated to the present urban cells and future urban cells, respectively. Based on population grids, present and future wealth grids are obtained, and they are used in the estimation of present and future probabilistic risk metrics along with probabilistic seismic hazard analysis and vulnerability curves from Prompt Assessment of Global Earthquakes for Response (PAGER).

To achieve these aims, we selected three earthquake-prone megacities from developing countries in Asia, namely Jakarta, Metro Manila, and Istanbul, for the case studies due to their rapid urbanization and population growth. Building on previous research8,25, here we employ a spatio-temporal approach to scrutinize how exposure dynamics contribute to changes in seismic loss indicators in megacities. Therefore, we take urban expansion into account with the help of a cellular automata-based urban growth model called SLEUTH26. The details of SLEUTH model are given in the Methods section. It is worth noting here that the focus of previous research8,25 is around the estimation of seismic exposure dynamics by overlaying hazard and exposure maps while this study aims to move beyond dynamics of exposure to quantify the consequences of urbanization on future risk.
Based on the current and future population density maps in ref. 25, we obtained grid-level present and future wealth. Then, we overlaid seismic hazard maps given in ref. 8 with the wealth grids to evaluate changes in wealth exposed to different Modified Mercalli Intensity (MMI) levels to have an understanding about the exposure dynamics in selected megacities. Finally, we estimated grid-level, Admin Level 2, and megacity-level AAL, as well as the grid-level PML by considering the present and future exposure of the selected megacities. The results reveal that our proposed macro-level loss estimation approach could be a promising complementary tool since it can produce present loss estimates that are in the same order of magnitude as the conventional approaches. Our predictions show that present AAL will increase almost twofold in Jakarta and in Metro Manila, and by almost 57% in Istanbul by 2030. We believe that our proposed framework can trigger discussions between scientific community and policymakers, for more effective and well-designed long-term seismic risk reduction and risk awareness strategies as well as allocation of resources.
Results
Spatio-temporal dynamics in wealth exposed to seismic hazard
The present and future grid-level wealth maps are given in Supplementary Figs. 1–3 for Jakarta, Metro Manila, and Istanbul, respectively. It is worth noting that 2018 is used to represent present in Jakarta and Istanbul, while 2016 is used for Metro Manila due to data availability. Seismic hazard maps for 10 and 2% probabilities of exceedance in 50 years that are provided in ref. 8 were used to overlay the present and future wealth maps. The details of the classical probabilistic seismic hazard analysis (PSHA) are provided in the Methods section. In Fig. 2a–c, dynamics in wealth (in 2016 prices for Metro Manila and in 2018 prices for Jakarta and Istanbul) exposed to different MMI levels are illustrated. The absolute change in wealth for each city are given in Supplementary Table 1 along with the annual growth rates.

a Jakarta, b Metro Manila, and c Istanbul.
For 10% probability of exceedance in 50 years, the wealth subjected to MMI VII level is predicted to increase by 12 billion USD (i.e., 1.1 times) from 11 billion USD to 23 billion USD in Jakarta, and by 162 billion USD (i.e., 77%) from 210 billion USD to 372 billion USD in Istanbul. Considering MMI VIII and MMI IX levels (combined), an almost twofold increase is predicted from 694 billion USD to 1332 billion USD in Jakarta, and from 762 billion USD to 1567 billion USD in Metro Manila. In Istanbul, the wealth subjected to MMI VIII level is predicted to increase from 1473 billion USD to 2327 billion USD, with an increment of around 58% (i.e., 854 billion USD) which is larger than the present total wealth of either Jakarta or Metro Manila.
For 2% probability of exceedance in 50 years, the wealth subjected to MMI VIII and MMI IX levels (combined) is predicted to increase from 705 billion USD to 1355 billion USD in Jakarta, and from 1683 billion USD to 2699 billion USD in Istanbul. For Metro Manila, the whole city is exposed to MMI IX level; therefore, wealth exposed to this level is predicted to increase from 762 billion USD to 1567 billion USD by 2030. For Jakarta and Metro Manila, these translate to an almost twofold increase of wealth exposed to MMI IX level from present to future.
In absolute terms, the highest increase in MMI VIII and MMI IX levels (combined) for 10% probability of exceedance in 50 years is observed in Istanbul (854 billion USD), followed by Metro Manila (805 billion USD) and Jakarta (685 billion USD). For 2% probability of exceedance in 50 years, the highest increase in wealth exposed to MMI VIII and MMI IX levels (combined) is also observed in Istanbul (1,016 billion USD), followed by Metro Manila (805 billion USD) and Jakarta (650 billion USD). The annual growth rates of wealth exposed to different MMI levels are different for each MMI level within the same city as expected from the employment of spatio-temporal analysis. These findings confirm the necessity of using spatio-temporal approaches for the quantification of evolving seismic exposure.
Spatio-temporal dynamics in probabilistic loss metrics AAL and PML
Average annual loss (AAL)
The present and future megacity-level AAL and the AAL normalized with respect to megacity-level GDP for the corresponding years are summarized in Table 1. The results reveal that AAL increases by around 91% from 67.5 million USD to 129.1 million USD in Jakarta (in 2018 prices), and by around 1.05 times from 162.6 million USD to 333.1 million USD in Metro Manila (in 2016 prices) by 2030. The present AAL in Istanbul shows a high absolute increase of around 57% from 899.7 million USD to 1416.7 million USD (in 2018 prices). The normalized AAL values are, in descending order, 0.63% for Istanbul, 0.42% for Metro Manila, and 0.16% for Jakarta. It is worth noting that the city-level normalized AAL values do not show a difference from present to future since the proposed macro-level approach utilizes GDP as a representation of evolving economic exposure.
In Table 2, our loss estimates corresponding to present megacity-level AAL and the AAL that is reported by Global Earthquake Model (GEM) Foundation27 are compared for benchmarking. It must be noted that GEM uses a conventional loss estimation approach to calculate losses, as opposed to the macro-level approach used in this study. Thus, more detailed building stock and replacement cost information are used in GEM’s models for residential, commercial, and industrial assets while our wealth-based exposure represents other types of assets as well. Furthermore, instead of using empirical vulnerability curves, GEM employs analytical vulnerability curves, which depends on the structural characteristics of buildings. In addition, instead of using classical PSHA as we did, GEM uses an event-based approach, which computes stochastic event sets to obtain loss curves. The ratio of the AAL estimates obtained by our macro-level approach to those obtained by GEM’s conventional approach are 0.73, 0.75, and 1.35 for Jakarta, Metro Manila, and Istanbul, respectively. Considering very different methodologies employed for every component of risk, results obtained by our macroscopic model are still in the same order of magnitude as compared with GEM’s results.
The changes in Admin Level 2 AAL from present to future are shown in Fig. 3a–f along with the maps of normalized AAL with respect to GDP for the regions in Jakarta (in 2018 prices), cities in Metro Manila (in 2016 prices), and districts in Istanbul (in 2018 prices). It is worth noting here that the larger regions with higher populations may show higher AAL values on similar hazard levels, which must be taken into consideration while assessing absolute losses at Admin Level 2. We observed that the maximum region-level AAL values in Jakarta increase from approximately 10–15 million USD to 25–30 million USD in northwestern and southeastern regions from 2018 to 2030, while the central region stays in the same range of 5–10 million USD. In Metro Manila, the maximum city-level AAL increases from approximately 20–30 million USD to 50–60 million USD in the northeastern region, and to 30–40 million USD range in the central region. Finally, the maximum district-level AAL value of Istanbul increases from approximately 50–60 million USD to 80–90 million USD around the city center in the European side. In addition to this, AAL in the southeastern region reaches 70–80 million USD range by 2030. Since GDP is directly used in the macro-level loss estimation process, the normalized AAL maps show similar patterns with the seismic hazard maps which are presented in ref. 8. Therefore, the northern regions in Jakarta (Fig. 3b), central western and central eastern cities in Metro Manila (Fig. 3d), and southern districts in Istanbul (Fig. 3f) have higher normalized AAL values. Accordingly, the range of normalized AAL values is wider in Istanbul (0.08–1.42%), followed by Metro Manila (0.28–0.43%) and Jakarta (0.12–0.15%).

a Change in AAL in regions of Jakarta from present to future in 2018 prices, b normalized AAL with respect to GDP in regions of Jakarta, c change in AAL in cities of Metro Manila from present to future in 2016 prices, d normalized AAL with respect to GDP in cities of Metro Manila, e change in AAL in districts of Istanbul from present to future in 2018 prices, f normalized AAL with respect to GDP in districts of Istanbul.
Grid-level present and future AAL maps for Jakarta (in 2018 prices), Metro Manila (in 2016 prices) and Istanbul (in 2018 prices) are presented in Fig. 4a–c, respectively (they are also provided in GeoTIFF format in ref. 28). In these figures, certain areas where high exposure is coupled with high hazard have higher AAL levels. The loss ranges shown with different colors were selected according to the loss patterns in each city. It was observed that each grid shows a different loss growth from present to future. The grid-level maximum AAL values increase from approximately 20 thousand USD to 25 thousand USD in central and northwestern Jakarta, from approximately 100 thousand USD to 180 thousand USD in central Metro Manila, and from approximately 350 thousand USD to 500 thousand USD in central Istanbul (the European side) from present to future.

a Change in AAL in Jakarta from present to future in 2018 prices, b change in AAL in Metro Manila from present to future in 2016 prices, c change in AAL in Istanbul from present to future in 2018 prices.
Probable maximum loss (PML)
We obtained present and future grid-level PML maps of Jakarta, Metro Manila, and Istanbul for 475-year and 2475-year return periods. Here, the maps corresponding to the 475-year return period are given in Fig. 5 as an example (the maps corresponding to the 2475-year return period are given in Supplementary Fig. 4, and all PML maps are provided in GeoTIFF format in ref. 28). The same scale is used to represent loss values for all selected cities. For the 475-year return period, maximum present grid-level PML value is predicted to increase from around 2 million USD to 3 million USD in Jakarta (in 2018 prices), from around 16 million USD to 18 million USD in Metro Manila (in 2016 prices), and from around 52 million USD to 78 million USD in Istanbul (in 2018 prices) by 2030. For the 2475-year return period, the changes in maximum grid-level PML are observed to be more prominent. An increase is predicted from around 15 million USD to 25 million USD in Jakarta, from around 28 million USD to 50 million USD in Metro Manila, and from around 122 million USD to 294 million USD in Istanbul.

a Change in PML in Jakarta from present to future in 2018 prices, b change in PML in Metro Manila from present to future in 2016 prices, c change in PML in Istanbul from present to future in 2018 prices.
Discussion
In this study, we develop a framework for the evaluation of present and future seismic losses by taking spatio-temporal dynamics of exposure into account. We propose a probabilistic macro-level approach to estimate the evolving probabilistic loss metrics, namely AAL and PML. Following this approach, we obtained AAL in grid-level, Admin Level 2, and megacity-level, as well as the grid-level PML for 475-year and 2475-year return periods in selected Asian megacities.
Our approach suffers from several limitations which should be noted. The developed seismic loss estimate framework is subject to inaccuracies and uncertainties within the input data. For example, the use of a constant exposure correction factor α over time and space (e.g., for highly industrialized areas), as well as a uniform GDP per capita in a given year throughout the country cause uncertainties. Using a single country-level vulnerability curve over the whole city adds more to these uncertainties. For example, in more developed modern regions of a city a design regulation might have been enforced while it was not in older regions. It is also worth noting that the site amplification using the slope-based shear-wave velocities from USGS that has 1 km spatial resolution could be replaced with local data that have higher granularity in line with the spatial resolution of loss grids to avoid potential bias.
The findings of our research shed light on future exposure and loss by making comparisons among present and future which can aid decision-makers and finance industry for better mitigation and reduction of forthcoming seismic risk. Since the results that we obtained are in terms of grid-level maps for wealth and seismic loss, our study demonstrates the growth of each grid over time. We observed that in regions where high levels of exposure and hazard are coupled, high potential of losses is predicted, while there are different trends in each megacity due to their varying historical urbanization patterns. Controlling or reducing the exposure with a risk-sensitive growth strategy, the impacts of earthquakes could be moderated in these cities. In line with the targets of Sendai framework by United Nations1, collaborations with other stakeholders such as World Bank in Indonesia29, the Philippines30, and Turkey31 can benefit from the results of our study for proactive risk management strategies. The law enforcement can be strengthened, and new urban development can be limited by building restrictions in earthquake-prone areas that are too costly to protect. In addition, the AAL maps for Admin Level 2 can aid local authorities in allocation of resources, and megacity-level AAL and PML can provide information to governmental institutions and decision-makers to open discussions with them about risk awareness for reducing forthcoming risks.
After comparing our results with those obtained from the conventional seismic loss estimation methodologies, we observed that our proposed macro-level loss estimation methodology is promising. Therefore, we suggest that it can be incorporated into the probabilistic seismic risk assessment framework as an effective and efficient complementary approach, especially to provide a preliminary view of risk that can trigger discussions between the scientific community and policymakers. Besides, finance sector could use our approach for benchmarking to develop more comprehensive insurance coverage. Since we leverage on open-source data, our framework can be employed in any region in the world, and for other types of natural hazards. In conclusion, our proposed framework can address and formulate an exposure-informed risk management strategy in megacities for a more resilient future.
Methods
The grid-level present and future wealth maps that represent economic exposure for the loss calculations are based on present and future population grids from ref. 25 which were obtained by dasymetric mapping using the urban area maps in ref. 8. A cellular automata-based urban growth model called SLEUTH26 was used in ref. 8 to predict the urban area (30 m grids for Jakarta and Metro Manila, and 90 m grids for Istanbul due to size of the administrative area) in 2030. SLEUTH model leverages on the mapped urban area extracted from satellite images and several other predictors of change (i.e., slope, transportation, and excluded area) which affect urbanization trends. It uses brute force calibration to generate a set of best-fit growth coefficients, namely slope, breed, diffusion, spread and road gravity. The growth coefficients define four growth rules in SLEUTH which are namely the spontaneous growth, new spreading center growth, edge growth, and road-influenced growth. During the calibration, a shape index called Lee-Sallee index is utilized for the selection of best-fit coefficients. Lee-Sallee index shows the spatial match, and it is defined as the ratio of intersection to the union of the ground truth urban area and simulated urban area8.
In each urban growth model, four urban area inputs and two road network inputs were used as suggested by SLEUTH, and only business-as-usual scenario was considered for the prediction of future urban area in ref. 8. The water bodies were used to define the excluded area. After obtaining the set of best-fit growth coefficients in ref. 8, it was observed that the dominant growth type is Edge Growth in Jakarta and Metro Manila while it is a combination of Edge Growth and New Spreading Center Growth in Istanbul. The predicted urbanization probabilities in 2030 were used in ref. 25 to disaggregate the extrapolated population of each megacity by following several assumptions. The details of these assumptions can be found in ref. 25 along with the present and future population density maps.
We obtained the grid-level wealth maps (Supplementary Figs. 1–3) following the economic exposure definition proposed by Jaiswal and Wald18 as given in Eq. 1:
Therefore, present and future economic exposure grids were derived by multiplying present (i.e., 2016 for Metro Manila and 2018 for Jakarta and Istanbul due to data availability) and future (i.e., 2030) GDP per capita with the corresponding population grids and the exposure correction factor α (i.e., wealth per capita/GDP per capita) proposed in ref. 18. This correction factor accounts for the disparity between national wealth and economic value of assets that are exposed. Present country-level nominal GDP per capita values were obtained from World Bank Data (available at https://data.worldbank.org/), and the real GDP per capita predictions in 2030 (in 2010 prices) were collected from the United States Department of Agriculture (USDA), International Macroeconomic Data Sets (available at www.ers.usda.gov). Then, the real GDP per capita in 2030 was converted from 2010 prices to 2016/2018 prices leveraging the price index (i.e., current GDP/real GDP) using 2010 as the base year from World Bank Data. Supplementary Table 2 summarizes the present and future GDP per capita values and exposure correction factors from ref. 18 for the selected countries in our study, namely Indonesia, the Philippines, and Turkey.
To assess the dynamics of spatio-temporal change in wealth exposed to seismic hazard, we overlaid present and future wealth maps with the 10 and 2% probability of exceedance seismic hazard maps in ref. 8. We used classical PSHA to generate grid-based hazard maps and hazard curves by utilizing the OpenQuake Engine (available at www.globalquakemodel.org)32,33 along with the Earthquake Model of Continental Southeast Asia (2018)34 for Jakarta and Metro Manila, and the Earthquake Model of the Middle East (EMME14)35 for Istanbul. The main reason of selecting the classical PSHA-based risk assessment instead of a probabilistic event-based approach in this study is to have a grid-based comparison between present and future urban grids following the urban expansion analysis rather than evaluating a portfolio of assets36,37. It is also worth noting that the classical PSHA-based risk assessment is computationally more efficient36. Therefore, the loss exceedance curves were calculated site by site based on the hazard curves, and the spatial correlation in the ground motion residuals were not considered. The slope-based shear wave velocities, Vs30, by USGS were also taken into consideration for soil amplification during the analysis38. The Peak Ground Acceleration (PGA) values were then converted to Modified Mercalli Intensities (MMIs) using Ground Motion to Intensity Conversion Equations (GMICEs) proposed by Worden et al.39. It is worth noting here that the spatial resolution of the seismic hazard maps is same with the spatial resolution of the wealth maps (i.e., 30 m for Jakarta and Metro Manila, and 90 m for Istanbul). For the grid-level hazard curves and loss estimation, we aggregated smaller grids to 270 m grids to decrease computation time.
The set of guidelines and recommendations for conventional loss estimation methodologies are primarily based on the method suggested by the Applied Technology Council (1985), which is designated as ATC-1340. The ATC-13 method contains two main components, namely, a seismic hazard analysis and a structural vulnerability function. Seismic hazard analysis takes the frequency distribution of earthquakes, intensity attenuation, and soil conditions into account, while the vulnerability analysis requires a detailed inventory of buildings and facilities in the region. The expected loss at a site is then determined by ATC-13 as shown in Eq. 2 below:
where \({B}_{k}\) is the building type k, \({I}_{i}\) is the intensity level i, \({{dr}}_{j}\) is the expected damage ratio j, and \({V}_{{B}_{k}}\)is the value of all buildings of type \({B}_{k}\).
To our knowledge, the first macro-level seismic loss estimation approach was proposed by Chen et al.19 as presented in Eq. 3:
where \(P\left({I}_{j}\right)\) is the probability of intensity level j, \({{{{{\rm{MDF}}}}}}({I}_{j})\) is the Mean Damage Factor to represent hazard-exposure-loss relation given intensity \({I}_{j}\), and \(g({{{{{\rm{GDP}}}}}})\) is a function to correlate the total social wealth with the macroscopic indicator GDP. The summation over \({I}_{j}\) represents the expected loss at each grid considering different probabilities of shaking intensities. \(g({{{{{\rm{GDP}}}}}})\) is assumed to be 4 for low- and middle-income economies, 5 for high-income economies, and 3 for China, India and Japan. Due to the limitation of the earthquake data, ref. 19 assumed that the \({{{{{\rm{MDF}}}}}}({I}_{j})\) is defined globally by the relation between intensity and loss ratio.
Jaiswal and Wald18 pointed out several limitations about previous macro-level forms such as the broad economic categories of vulnerability curves, and the use of GDP which is an indicator of economic activity (i.e., flow) rather than the existing investment (i.e., stock). Therefore, through the U.S. Geological Survey’s (USGS) Prompt Assessment of Global Earthquakes for Response (PAGER) system, they proposed using country-level vulnerability parameters and an exposure correction factor α (i.e., wealth per capita/GDP per capita) to adjust GDP as represented in Eq. 1. PAGER system rapidly estimates the population exposed to different levels of shaking intensities along with the range of economic losses in the aftermath of a large earthquake by means of a deterministic approach. Total expected economic loss is estimated as described in Eq. 4 by summing the product of loss ratio \(r(s)\), and total economic exposure at each shaking intensity level, \(s\):
The loss ratio \(r(s)\) is defined in ref. 18 as given below in Eq. 5:
where \(\phi\) is the standard normal cumulative distribution function, \(\theta\) is the mean, and \(\beta\) is the standard deviation of natural logarithm of shaking intensity \(s\).
By integrating the probabilistic approach of Chen et al.19 and the deterministic approach of Jaiswal and Wald18, here we propose a probabilistic wealth-based macro-level loss estimation approach. The main difference of our proposed approach from other approaches is the integration of the exposure correction factor α and the loss ratio definition given in ref. 18 into the probabilistic GDP-based framework of Chen at al.19 to calculate the present and future probabilistic risk metrics AAL and PML. The AAL results represent the amount that a country or a municipality would have to set aside each year to cover the cost of future disasters in the absence of insurance or other disaster risk financing mechanisms. They also provide a basis to calculate the premium of an insurance program. PML results are relevant to the maximum loss that could be expected within a given period of time. They represent the size of the reserves that insurance companies or the government should have available to buffer potential future losses. We then propose the following form shown in Eq. 6 to calculate AAL and PML based on economic exposure given in Eq. 1:
where \(s\) is the shaking intensity, \(P\left(s\right)\) is probability of occurrence of shaking intensity \(s\), and \(r(s)\) is the loss ratio corresponding to shaking intensity \(s\).
We obtained the country-level MMI-based vulnerability parameters (i.e., \(\theta\) and \(\beta\)) corresponding to Indonesia, the Philippines, and Turkey from Jaiswal and Wald18 as summarized in Supplementary Table 3, and the vulnerability curves obtained by using these parameters are shown in Supplementary Fig. 5. Based on the wealth maps, hazard curves, and vulnerability curves, we obtained the grid-level AAL, and 475-year and 2475-year PML maps following our proposed approach. Subsequently, we aggregated the AAL values to obtain Admin Level 2, and then megacity-level AAL values for Jakarta, Metro Manila, and Istanbul.
Data availability
The data that support the findings of this study are openly available at the following URL https://doi.org/10.6084/m9.figshare.19310621. Further supplementary data and information are available as Supplementary Information in the online version of the article.
Code availability
We have used OpenQuake Engine 3.11 (available at www.globalquakemodel.org) for seismic hazard and risk calculations.
References
UNDRR, United Nations Office for Disaster Risk Reduction. Chart of the Sendai Framework for Disaster Risk Reduction, 2015–2030, https://www.undrr.org/publication/chart-sendai-framework-disaster-risk-reduction-2015-2030 (2015).
GFDRR, Global Facility for Disaster Reduction and Recovery. The making of a riskier future: How our decisions are shaping future disaster risk, https://www.gfdrr.org/sites/default/files/publication/Riskier%20Future.pdf (2016).
Wenzel, F., Bendimerad, F. & Sinha, R. Megacities - megarisks. Nat Hazards 42, 481–491 (2007).
Freire, S. & Aubrecht, C. Integrating population dynamics into mapping human exposure to seismic hazard. Nat. Hazards Earth Syst. Sci. 12, 3533–3543 (2012).
Lallemant, D. Modeling the Future Disaster Risk of Cities to Envision Paths towards their Future Resilience. Doctoral thesis, Stanford University, Department of Civil and Environmental Engineering (2015).
Calderon, A. Earthquake Loss Assessment Models and Forecast of Forthcoming Risk within the Context of the Sendai Framework: Study Cases in Central America and the Caribbean. Doctoral thesis, Scuola Universitaria Superiore IUSS (2019).
Corban, C., Hancilar, U., Silva, V., Ehrlich, D. & Groeve, T. D. Pan-European Seismic Risk Assessment A proof of concept using the Earthquake Loss Estimation Routine (ELER). EUR 27896 JRC Technical Report, Luxembourg: Publications Office of the European Union; https://doi.org/10.2788/326095 (2016).
Mestav Sarica, G., Zhu, T. & Pan, T.-C. Spatio-temporal dynamics in seismic exposure of Asian megacities: Past, present, and future. Environ. Res. Lett. 15, 094092 (2020).
Winsemius, H. C., Van Beek, L. P., Jongman, B., Ward, P. & Bouwman, A. A framework for global river flood risk assessments. Hydrol. Earth Syst. Sci. 17, 1871–1892 (2013).
Hallegatte, S., Green, C., Nichollls, R. & Corfee-Morlot, J. Future flood losses in major coastal cities. Nat. Clim. Change 3, 802–806 (2013).
Hinkel, J. et al. Coastal flood damage and adaptation costs under 21st century sea-level rise. Proce. Natl Acad. Sci. USA 111, 3292–3297 (2014).
Ligtvoet, W. & Hilderink, H. Towards a world of cities in 2050 An outlook on water-related challenges, https://www.pbl.nl/en/publications/towards-a-world-of-cities-in-2050-an-outlook-on-water-related-challenges (2014).
Muis, S., Güneralp, B., Jongman, B., Aerts, J. & Ward, P. J. Flood risk and adaptation strategies under climate change and urban expansion: A probabilistic analysis using global data. Sci. Total Environ. 538, 445–457 (2015).
Mestav Sarica, G., Zhu, T., Jian, W., Lo, E. Y. M. & Pan, T.-C. Spatio-temporal dynamics of flood exposure in Shenzhen from present to future. Environ. Planning B 48, 1011–1024 (2021).
Calderon, A. & Silva, V. Exposure forecasting for seismic risk estimation: Application to Costa Rica. Earthquake Spectra 37, 1806–1826 (2021).
Murnane, R. J. et al. Future scenarios for earthquake and flood risk in Eastern Europe and Central Asia. Earth’s Future 5, 693–714 (2017).
Lallemant, D., Wong, S. & Kiremidjian, A. A. Framework for Modelling Future Urban Disaster Risk in Understanding Risk in an Evolving World: Emerging Best Practices in Natural Disaster Risk Assessment (ed. Global Facility for Disaster Reduction and Recovery) 191–96 (World Bank, 2014).
Jaiswal, K. S. & Wald, D. J. Rapid estimation of the economic consequences of global earthquakes, https://pubs.usgs.gov/of/2011/1116/ (2011).
Chen, Q., Chen, Y., Liu, J. & Chen, L. Quick and approximate estimation of earthquake loss based on macroscopic index of exposure and population distribution. Nat. Hazards 15, 217–229 (1997).
Chan, L. S. et al. Assessment of global seismic loss based on macroeconomic indicators. Nat. Hazards 17, 269–283 (1998).
Markhvida, M., Walsh, B., Hallegatte, S. & Baker, J. Quantification of disaster impacts through household well-being losses. Nat. Sustain. 3, 538–547 (2020).
World Bank. World Development Report 1994: Infrastructure for Development, https://openknowledge.worldbank.org/handle/10986/5977 (1994).
Jaiswal, K. & Wald, D. J. Estimating economic losses from earthquakes using an empirical approach. Earthquake Spectra 29, 309–324 (2013).
Mestav Sarica, G. Macro-Level Estimation of Present and Future Seismic Loss by Modelling Spatio-Temporal Dynamics of Exposure. Doctoral thesis, Nanyang Technological University, Singapore (2020).
Mestav Sarica, G., Zhu, T. & Pan, T.-C. Estimation of future population exposure to seismic hazard: A case study of Asian megacities. Proceedings of the 17th World Conference on Earthquake Engineering 17WCEE, (Japan Association for Earthquake Engineering, Tokyo, 2020).
Silva, E. A. & Clarke, K. C. Calibration of the SLEUTH urban growth model for Lisbon and Porto, Portugal. Comp., Environ. Urban Syst. 26, 525–552 (2002).
Global Earthquake Model (GEM) Foundation. Global Mosaic of Risk Models, Country Profiles, https://www.globalquakemodel.org/country-risk-profiles (2022).
Mestav Sarica, G. & Pan, T.-C. Seismic loss dynamics in three Asian megacities using a macro-level approach based on socioeconomic exposure indicators data sets. figshare https://doi.org/10.6084/m9.figshare.19310621 (2022).
World Bank. Strengthening the disaster resilience of Indonesian cities - a policy note, Urbanization Flagship Report, https://openknowledge.worldbank.org/handle/10986/32459 (2019).
World Bank. Philippines Seismic Risk Reduction and Resilience Project (P171419), https://documents1.worldbank.org/curated/en/150861613466936773/pdf/Project-Information-Document-Philippines-Seismic-Risk-Reduction-and-Resilience-Project-P171419.pdf (2019).
World Bank. Turkey - Istanbul Seismic Risk Mitigation and Emergency Preparedness Project, https://ieg.worldbankgroup.org/sites/default/files/Data/reports/ppar_turkeyseismic.pdf (2018).
Pagani, M. et al. OpenQuake Engine: An open hazard (and risk) software for the Global Earthquake Model. Seismol. Res. Lett. 85, 692–702, https://doi.org/10.1785/0220130087 (2014).
Silva, V., Crowley, H., Pagani, M., Monelli, D. & Pinho, R. Development of the OpenQuake engine, the Global Earthquake Model’s open-source software for seismic risk assessment. Nat. Hazards 72, 1409–1427 (2014).
Chan, C.-H. et al. Toward uniform probabilistic seismic hazard assessments for Southeast Asia, https://ui.adsabs.harvard.edu/abs/2017AGUFMNH23B.01C/abstract (2017).
Giardini, D. et al. Seismic hazard map of the Middle East. Bull. Earthquake Eng. 16, 3567–3570 (2018).
Silva, V. Critical issues on probabilistic earthquake loss assessment. J. Earthquake Eng. 22, 1683–1709 (2018).
Global Earthquake Model (GEM) Foundation. The OpenQuake-engine User Manual. Global Earthquake Model (GEM) Open-Quake Manual for Engine version 3.11.4.; https://doi.org/10.13117/GEM.OPENQUAKE.MAN.ENGINE.3.11.4 (2021).
Wald, D. J. & Allen, T. I. Topographic slope as a proxy for seismic site conditions and amplification. Bull. Seismol. Soc. Am. 97, 1379–95 (2007).
Worden, C. B., Gerstenberger, M. C., Rhoades, D. A. & Wald, D. J. Probabilistic relationships between ground-motion parameters and modified mercalli intensity in california. Bull. Seismol. Soc. Am. 102, 204–221 (2012).
Applied Technology Council (ATC). ATC Earthquake Damage Evaluation Data for California (ATC-13), https://www.atcouncil.org/pdfs/atc13.pdf (1985).
Acknowledgements
The authors would like to acknowledge the partial financial support for this work provided by the Institute of Catastrophe Risk Management, Nanyang Technological University, Singapore and the Monetary Authority of Singapore (MAS).
Author information
Authors and Affiliations
Contributions
G.M.S. designed the study, analyzed the results, and prepared the manuscript. T.-C.P. provided the initial project direction, helped with the discussions, and contributed to editing.
Corresponding author
Ethics declarations
Competing interests
The authors declare no competing interests.
Peer review
Peer review information
Communications Earth & Environment thanks Vitor Silva and the other, anonymous, reviewer(s) for their contribution to the peer review of this work. Primary Handling Editor: Heike Langenberg.
Additional information
Publisher’s note Springer Nature remains neutral with regard to jurisdictional claims in published maps and institutional affiliations.
Supplementary information
Rights and permissions
Open Access This article is licensed under a Creative Commons Attribution 4.0 International License, which permits use, sharing, adaptation, distribution and reproduction in any medium or format, as long as you give appropriate credit to the original author(s) and the source, provide a link to the Creative Commons license, and indicate if changes were made. The images or other third party material in this article are included in the article’s Creative Commons license, unless indicated otherwise in a credit line to the material. If material is not included in the article’s Creative Commons license and your intended use is not permitted by statutory regulation or exceeds the permitted use, you will need to obtain permission directly from the copyright holder. To view a copy of this license, visit http://creativecommons.org/licenses/by/4.0/.
About this article

Cite this article
Mestav Sarica, G., Pan, TC. Seismic loss dynamics in three Asian megacities using a macro-level approach based on socioeconomic exposure indicators. Commun Earth Environ 3, 101 (2022). https://doi.org/10.1038/s43247-022-00430-9
Received:
Accepted:
Published:
DOI: https://doi.org/10.1038/s43247-022-00430-9
Comments
By submitting a comment you agree to abide by our Terms and Community Guidelines. If you find something abusive or that does not comply with our terms or guidelines please flag it as inappropriate.
