
Abstract
Metacaspases are caspase-like homologs which undergo a complex maturation process involving multiple intra-chain cleavages resulting in a composite enzyme made of a p10 and a p20 domain. Their proteolytic activity involving a cysteine-histidine catalytic dyad, show peptide bond cleavage specificity in the C-terminal to lysine and arginine, with both maturation- and catalytic processes being calcium-dependent. Here, we present the structure of a metacaspase from the yeast Candida glabrata, CgMCA-I, in complex with a unique calcium along with a structure in which three magnesium ions are bound. We show that the Ca2+ ion interacts with a loop in the vicinity of the catalytic site. The reorganization of this cation binding loop, by bringing together the two catalytic residues, could be one of the main structural determinants triggering metacaspase activation. Enzymatic exploration of CgMCA-I confirmed that the maturation process implies a trans mechanism with sequential cleavages.
Introduction
Regulated cell death (RCD) is a physiological phenomenon essential for survival and maintenance of cell homeostasis in multicellular organisms. This is a highly regulated process in animals, that depends on a cellular machinery and notably caspases (cysteine-containing aspartate-specific proteases)1. The identification of RCD in non-metazoan organisms2 was followed by the discovery of caspase-like structural homologs termed metacaspases. Unlike caspases, which are found in animals and in some viruses, metacaspases are present in plants, protozoa, and yeast, but are absent in animals3. They are involved in yeast pro-cell death in response to oxidative stress4, ageing5 or viral toxins6 and also non-death functions as cell cycle regulation7 and in protein quality control (PQC) for clearance of protein aggregates8.
Caspases and metacaspases are both classified into the C14 protein family within the CD clan of cysteine proteases9, are synthesized as inactive zymogens, and share a structural hemoglobinase fold composed of the p10 and p20 domains, containing the catalytic His/Cys dyad. While metazoan executioner caspases are activated through their processing by initiator caspases and their dimerization, metacaspases do not undergo dimerization and are active as monomers3. They are moreover specific to Arg and Lys residues in the P1 position10. Metacaspases are further sub-classified in three types according to the architecture of the p10 and p20 domains with type I containing an additional N-terminal domain10. Also, the presence of calcium is required for their activity and further autocatalytic processing10,11,12. As in animals, yeast cell-death has been linked to an increase of the intra-cellular and intra-mitochondrial Ca2+ concentration, where the latter plays a role in death signal transduction and typical morphological changes13. Previously, the three-dimensional structure of Trypanosoma brucei metacaspase type I has been solved in complex with Sm3+ suggesting the presence of a Ca2+ binding site in the p20 domain inducing structural changes of a loop near the active site14. In addition, the study of Arabidopsis thaliana type II metacaspases, resulted in the identification of a Ca2+-dependent multi-cleavage process where metacaspases are thought to transduce Ca2+ signals and activate cell death pathways15. However, the enzymatic and structural basis for Ca2+ activation of metacaspases remains to be elucidated.
In this work, we report the determination of the second crystal structure of a yeast metacaspase namely that from Candida glabrata, CgMCA-I. We observed electron density corresponding to a calcium ion, thereby allowing the identification of a calcium-binding site, in the vicinity of a previously observed samarium ion binding site14. Through a functional, enzymatic and structural study, the Ca2+ dependent mechanism of maturation and activation of type I metacaspases has been investigated. Throughout, the term maturation is used to describe the different proteolytic cleavages that the metacaspase will undergo and, by extension, the different intermediates of maturation termed E0 to E3. The term activation corresponds to the increased catalytic activity of the metacaspase which harbors either low activity during the new step of maturation “Elow”, or high activity at the last step of maturation “Ehigh”.
Results
Cation-dependent maturation of CgMCA-I
To decipher the molecular determinants of the maturation process of CgMCA-I, the full-length (residues 1–392) wild-type enzyme was overexpressed in E. coli and purified by affinity chromatography and gel filtration. Size exclusion chromatography indicates that, the elution volume of CgMCA-I corresponds to an apparent mass of 38 kDa with an additional peak at 10 kDa suggesting that the protein could be submitted to a maturation process as observed for other metacaspases14,15,16 (Supplementary Figs. 1, 2). It has been shown that calcium may facilitate and, in some cases, is mandatory12,14,16,17 for maturation of the enzyme. In order to gain a better understanding of CgMCA-I maturation, we purified by affinity chromatography using Biosprint 96 (see Maturation Assay, SI) and analysed by gel electrophoresis the wild-type protein after 0, 4 and 8 days, respectively, in the presence or the absence of calcium or EGTA to observe the maturation process over time and the impact of Ca2+ ions on this process (Fig. 1).

a Structural representation of maturation intermediate forms of CgMCA-I starting from the non-matured form (E0), after the first and second cleavage (E1 and E2 respectively), and the mature form (E3). b SDS-PAGE of CgMCA-I aliquots at maturation day 0 (D0), 4 (D4) or 8 (D8) in the presence or absence of Ca2+ (10 mM) or EGTA (1 mM). The band at 48 kDa corresponds to CgMCA-I full length (CgMCA-I FL). Schematic representation of the maturation process of CgMCA-I with the N-terminal part, the p20 domain, the linker, and the p10 domain, respectively colored in blue, yellow, purple, and green. The proteolytic cleavage after residues R307, K263 and R54 results in the progressive appearance of maturation intermediate forms which correspond to different bands identified by their residues on the right as determined by mass spectrometry. c SDS-PAGE of CgMCA-I aliquots at D0, D4, and D8 in the presence or the absence of Mn2+ (10 mM), Mg2+ (10 mM), and Zn2+ (10 mM).
In the absence of calcium or EGTA, CgMCA-I undergoes cleavage and starts to maturate at day 0, continuing until day 8 without reaching a complete mature form namely the E3 form (vide infra). Different intermediary bands appear over time with sizes from 10 kDa to 38 kDa. The maturation in the presence of Ca2+ is clearly accelerated and at day 8, a thin band at 23 kDa is visible which could be attributed to the p20 domain. In the presence of EGTA, the process is stopped at day 0, confirming the need for a divalent cation in the maturation process. In addition to the full-length metacaspase at 48 kDa, a thinner band is observed at 38 kDa indicating that maturation could start during expression and purification prior to EGTA addition (Fig. 1b).
The fact that maturation is visible in the absence of additional Ca2+ after purification could indicate that calcium partially binds to the protein during expression or that another divalent cation could be present, even at low concentration, and could be bound prior to purification. To confirm the role of calcium and/or other divalent cations as activators, we tested three additional divalent metal ions: Mn2+, Mg2+, and Zn2+ (Fig. 1c). In the presence of Mn2+, the enzyme shows a behavior similar to that observed for maturation in the absence of divalent cations. More surprisingly, in the presence of Mg2+ or Zn2+, the maturation process seems to be blocked at the very first cleavage event such as in the presence of EGTA suggesting that these two divalent cations could play an inhibiting role on the maturation (Fig. 1c).
Analysis of amino-acid residues involved in CgMCA-I maturation
Analysis of metacaspase fragments by nano-reversed phase liquid chromatography coupled to high-resolution mass spectrometry (nanoLC-HRMS) with an Orbitrap analyzer was used to determine the cleavage sites with higher accuracy. The high resolution of the orbitrap mass spectrometer allows determining, after deconvolution of the multicharged MS spectrum, the molecular weight of the different cleaved fragments of CgMCA-I with high accuracy (Supplementary Fig. 3). We identified residues Arg307, Lys263, and Arg54, as the first, second and third cleavage sites, respectively (Fig. 1b).
In order to decipher the molecular determinants of the maturation process, a series of cloning and maturation experiments were performed, and subsequently the time-course maturation without additives or in the presence of calcium or EGTA was explored. The first aim was to determine the initial cleavage site. For this purpose, CgMCA-I was cloned in a pET52 vector to introduce a His-Tag at the C-terminal (CgMCA-IHis) and then observed following 0, 4, and 8 maturation days without additives by gel electrophoresis and (Fig. 2a) by western blotting (Fig. 2b). A band around 10 kDa appears at day 0 for CgMCA-IHis but only at day 4 for HisCgMCA-I, indicating that the first cleavage occurs at the C-terminal part of the protein. In addition, the lack of band at 49.7 kDa at day 4 for CgMCA-IHis indicates that the release of the C-terminal occurs in the very first steps of maturation. On the other hand, the presence of a band at 48 kDa in the western blot until day 8 suggests that the cleavage of the N-terminal part of the protein occurs at the very end of the process (Fig. 2a–c). To confirm this observation, the R54A mutant was expressed and its maturation analyzed (Supplementary Fig. 4a). It appears that in the presence of calcium the process is delayed, leading only to intermediate forms of maturation without reaching a fully mature form of CgMCA-I after eight days, and confirming that cleavage at position R54 is most likely the last one to occur.

SDS-PAGE (a) and Western-blot (b) analysis of aliquots of HisCgMCA-I and CgMCA-IHis constructs at D0, D4, and D8 in the absence of Ca2+. (c) Schematic representation of HisCgMCA-I and CgMCA-IHis constructs.
In order to characterize the second and first cleavage sites which should be at positions 263 and 307, respectively, Lys263 and Arg307 were mutated to an alanine (K263A and R307A) and the maturation process followed (Supplementary Fig. 4b, c). Surprisingly, both mutants seem to undergo cleavages with a maturation process mimicking the wild-type enzyme, hence Lys263 was mutated to an aspartate and to a phenylalanine, respectively, to induce more drastic effects (Supplementary Fig. 4d, e). In both cases, and in the lack of calcium, the first cleavage event was observed at day 0 with the appearance of a band at 38 kDa. However, in the course of maturation in the days following, an aberrant process seems to occur with a number of secondary cleavage sites resulting in the disappearance of the protein from day 4. In the presence of calcium, only a thin band with a size which could correspond to the mature form was observed. This suggests that the mutants most probably underwent aberrant maturation, possibly partially causing their degradation (Supplementary Fig. 4d, e). Altogether, this points to the presence of basic residues not being mandatory at these positions, provided that the residue replacing the lysine does not drastically change the function held by the side chain.
Overall structural features of CgMCA-I
To elucidate the molecular determinants for cation-dependent metacaspase activation, CgMCA-I was expressed in E. coli and purified to homogeneity without additives or in the presence of 10 mM Ca2+ or of 1 mM EGTA in order to obtain non-maturated, partially or fully maturated enzyme for crystallization. Alternatively, we used a purified C238A catalytic mutant in order to obtain a non-maturated protein.
Crystallization assays were carried using enzymes at day 0 and day 4 following purification. Depending on the time of maturation, crystals grew either from a solution containing 0.2 M (NH4)2SO4, 30% (w/v) PEG 4000 (day 0 protein) or a solution containing 0.2 M magnesium acetate, 20% (w/v) PEG 3350 (day 4 protein).
Structures from these two crystal forms were determined by the molecular replacement method using the structure of the homologue from Saccharomyces cerevisiae, ScMCA-I (PDB code: 4F6O16), as search model. The crystal structures displayed clear electron density for Ca2+ and Mg2+ ions, and were named according to this issue, CgMCA-ICa (PDB code: 7QP1) or CgMCA-IMg (PDB code: 7QP0), respectively (Fig. 3).

Three-dimensional structures of CgMCA-ICa and CgMCA-IMg monomers, respectively, in complex with (a) Ca2+ (yellow sphere) or (b) Mg2+ (purple spheres). α-Helices (blue) and β-strands (red), with the numbering of the secondary structure elements shown in white and black, respectively (a). The three Mg2+ ions present in CgMCA-IMg are named Mg2+A, Mg2+B, and Mg2+C (b). Catalytic residues are highlighted as stick presentations by H (His182) and C (Cys238) and colored in cyan. Topological representation of CgMCA-ICa (c) and CgMCA-IMg (f). Disordered parts of the proteins are shown in black dotted lines and missing parts of the protein due to the maturation process are shown in red dotted lines (c, f). Cleavage sites are indicated by black arrow heads and the p10 subunits are framed by an orange dotted line (c, f). Loops numbering (L1 to L7/L7α) are indicated (c, f). Catalytic site organization of CgMCA-ICa (d) and CgMCA-IMg (e), showing the position of the two catalytic residues (His182 and Cys238) respective to the cations binding sites and the disordered L7 loop, for which the disordered part is indicated by gray dotted lines.
CgMCA-ICa crystallized in the trigonal space group P32 with two molecules in the asymmetric unit (Table 1, Supplementary Fig. 5a), whereas CgMCA-IMg crystallized in the monoclinic space group C2 with two molecules in the asymmetric unit (Table 1, Supplementary Fig. 5b). The structures were solved to respectively 3.0 Å and 1.6 Å resolution and share common features. The monomers CgMCA-ICa and CgMCA-IMg both contain a p20 and a p10 domain forming a caspase-like core in which a two-stranded anti-parallel β-sheet from the p10 domain completes a six stranded parallel β-sheet in the p20 domain (Fig. 3a–c, f). This central β-sheet is surrounded by three helices on one side (α1, α4, and α5) and two α-helices on the other side (α2 and α3) (Fig. 3a–c, f). In addition, a β-hairpin (βc and βd) between β3 and β4 complete the p20 domain (Fig. 3c, f). Cys238 and His182 are located on loops CgL4 and CgL3, respectively, from the catalytic dyad (Fig. 3a–c, f).
Regarding the specificities of CgMCA-ICa, three short helices (αa, αb and αc) complete the p20 domain (Fig. 3a, c). In addition, as observed in the crystal structure of ScMCA-I16, loop CgL7 (named L3 in ScMCA-I), which may cap the substrate-binding groove, is disordered from Asp324 to Gly335 (Fig. 3c, d, Supplementary Fig. 6). As opposed to ScMCA-I, a short loop formed by residues Gly84 to Gln87, displays no electron density (Fig. 3c). Surprisingly, the two monomers of the CgMCA-ICa dimer observed in the asymmetric unit interact via a β-sheet complementation between the β6 and β5’ strands (Supplementary Fig. 5a). This unexpected organization being similar to that of the dimer usually observed for caspases, SAXS experiments were performed to determine the oligomeric state of CgMCA-I in the presence of calcium and confirmed that this enzyme is monomeric in solution (Supplementary Fig. 7).
Regarding the maturation process, the N-terminal and the linker located between p20 and p10 domains and which corresponds to the CgL6 loop, are both cleaved and residues Met1 to Gly68 and Asn260 to Ile309 show no electron density in the 2Fo-Fc map (Fig. 3c, Supplementary Fig. 8a, b). Due to the flexibility at the cleaved ends, we were not able to determine with accuracy the residues after which the cleavage occurred only based on the structure, however, the boundaries of the missing part are in perfect accordance with the cleavage site identified by mass spectrometry (Supplementary Fig. 3).
Regarding the specificities CgMCA-IMg, and as opposed to CgMCA-ICa, no β-strand complementation was present to stabilize the dimer which instead shows contacts between helix 1 and loop CgL2 (Supplementary Fig. 5b). The overall structure is highly similar to that of CgMCA-ICa with a RMSD of 0.823 Å calculated on all Cα atoms. As for CgMCA-ICa, a fully maturated protein was observed, but with the N-terminal (Met1 to Ser72) and linker (Asn260 to Ile309—a part of CgL6) missing (Fig. 3f, Supplementary Fig. 8c, d). As opposed to CgMCA-ICa, residues Gly84 to Gln87 show clear electron density and form a hairpin stabilized by two short β-strands (βa and βb) (Fig. 3b, f, Supplementary Fig. 8e, f). A disordered CgL7 loop is still observed, but the segment from Asp330 to Gly335 could be constructed. Interestingly, this longer structured segment forms a one-turn helix (Gly335-Asn337, αcap) and caps the substrate-binding groove limiting, under this conformation, the access to the catalytic site (Fig. 3e).
Structural basis for CgMCA-I Ca2+ dependent maturation and activation
Several studies have shown that the maturation process of metacaspases (AtMCA-IIb17, AtMCA-IId12, TbMCA-Ib14, ScMCA-I16) is calcium-dependent. To solve the structure of TbMCA-Ib14, the authors used samarium, a calcium-mimicking lanthanide. They reported that the presence of Ca2+ always hindered crystal formation and that Ca2+ could not be detected after the soaking experiment. More recently, a three-dimensional structure of a plant metacaspase15 was solved and a soaking experiment carried out in the presence of Ca2+. Here, again and despite clear conformational reorganization of some parts of the protein, no electron density was observed for Ca2+.
To determine the structure of CgMCA-ICa, we purified the wild-type metacaspase in the presence of 10 mM CaCl2 and performed crystallization assays at day 0 using a non-fully maturated protein. Crystals were observed only after three months, and the crystal structure reveals that the maturation process occurred in the course of the crystallization. We observed a clear electron density for Ca2+ (Figs. 3a, d, 4, Supplementary Fig. 9). Interestingly, the Ca2+ ion is in the vicinity of the Sm3+ binding site as observed in TbMCA-Ib. In CgMCA-ICa (Fig. 5a), Ca2+ is hepta-coordinated by a water molecule and residues Gly196, Asp198 (Asp173 in TbMCA-Ib), Asp214 (Asp189 in TbMCA-Ib), Thr242 and Asp245 (Asp220 in TbMCA-Ib) (Supplementary Fig. 5a, b). Similarly, Sm3+ in TbMCA-Ib is hepta-coordinated but shows a different binding mode14. Indeed, except for the three conserved aspartates (Asp173, Asp189 and Asp220), the rest of the coordination is ensured by two water molecules and Asp190 (Fig. 5b). In addition, Arg171 and Ser217 in TbMCA-Ib which correspond to Gly196 and Thr242 in CgMCA-ICa, respectively, are not involved in the cation binding (Fig. 5b). Altogether, this original Ca2+ coordination results in a complete reorganization of segment Gly183-Ile201 and its associated loop Gln185-Asp199 (Fig. 5a).

The distance between the thiol group of the catalytic cysteine Cys238 and the imidazole nitrogen of the catalytic histidine His182 in the two crystal structures, with that of CgMCA-ICa shown in green and CgMCA-IMg in orange. Ca2+ and Mg2+ ions are shown as yellow and purple spheres, respectively.

a, c. Positions of Ca2+ in yellow and the coordinating water molecule in red (CgMCA-ICa) respective to Sm3+ in green (TbMCA-Ib, PDB code: 4AFP) (a) and Mg2+A in purple (CgMCA-IMg) (b). Loop Gln185-Asp199 surrounding the Ca2+ (CgMCA-ICa) is shown in green (a, c), the disordered loop Cys162-Asp173 in TbMCA-Ib is shown in cyan (a) and loop Asp188-Gly196 in CgMCA-IMg is shown in gray (c). Schematic representation of the coordinated Sm3+ (b) and Mg2+A (d) as observed in the structures of TbMCA-Ib and CgMCA-IMg, respectively.
First, Ca2+ is slightly displaced (3.4 Å) compared to Sm3+ (Fig. 5a). Second, a TbMCA-Ib disordered loop (Cys162-Asp173) is stabilized in CgMCA-ICa (loop Gln185-Asp199) due to the coordination by Gly196 and Asp198 (Supplementary Fig. 10a, b). This loop conformation shows clear electron density in which the calcium is capped. Importantly, this loop is part of a small domain made of two small antiparallel β-strands and one short helix, a domain which immediately succeeds the loop CgL3 bearing the catalytic histidine (Fig. 3c). Third, the segment Asp236-Asp245 (Asp211-Asp220 in TbMCA-Ib) which holds the catalytic cysteine is stabilized by Thr242 and Asp245 (Fig. 4, Supplementary Fig. 10b). Interestingly, the “cation binding loop” observed in ScMCA-I (Gln223-Asp237) and in TbMCA-Ib (Cys162-Asp173) is ordered in CgMCA-ICa which suggests that the calcium has probably a role of stabilization not only for loop Asn185-Asp199 but also for segment Asp236- Asp245, the whole contributing to bringing together the two catalytic residues (Fig. 4).
To solve the structure of CgMCA-IMg, we performed experiments similar to those described above. Nevertheless, after purification, the enzyme maturated during 4 days prior to crystallization assays. For the crystals used for structure determination, the crystallization condition included 200 mM magnesium. The electron density map revealed the presence of three magnesium ions being hexa-coordinated (Fig. 5c, d, Supplementary Fig. 10c–e). One of the Mg2+ ions is positioned at the very same place as the samarium ion observed in the crystal structure of TbMCA-Ib but instead of being coordinated by four amino-acid residues and a water molecule as observed for this latter, in CgMCA-IMg it is coordinated by five water molecules and Asp214 (Asp189 in TbMCA-Ib) (Fig. 5d). Interestingly, most of the aspartates coordinating samarium in TbMCA-Ib are conserved in CgMCA-IMg and interact with three of the water molecules coordinating magnesium, namely Asp198 (Asp173 in TbMCA-Ib), Asp215 (Asp190 in TbMCA-Ib) and Asp245 (Asp220 in TbMCA-Ib). In addition, Asp199 and the main chains of Thr242 and Met197 interact with the two last water molecules (Fig. 5b, d). Altogether, it appears that Sm3+ most probably mimics Mg2+ rather than Ca2+. The fact that samarium is observed in non-maturated TbMCA-Ib could explain the different orientations observed for the cation binding loops of the two enzymes (Fig. 5a, c). In CgMCA-IMg, the enzyme is fully maturated but in parallel, we have shown that Mg2+ seems to impair the maturation of the metacaspase. Interestingly, in the presence of Mg2+ the distance between the two catalytic residues is 10.6 Å, against 8.3 Å when in presence of Ca2+, suggesting that the presence of calcium forces the catalytic site to adopt a proper organization for its autolysis activity (Fig. 4). A second magnesium ion coordinated by two acidic residues (namely Asp188 and Asp190) and three water molecules is present in the “calcium capping loop” contributing to its stabilization and reorientation (Supplementary Fig. 10c, e).
Enzymatic analysis of CgMCA-I maturation
In preliminary experiments, apparent kinetic constants of CgMCA-I were determined in the presence of 10 mM calcium at days 0 and day 8 of maturation using Z-GGR-AMC as substrate (concentration range of 0–50 µM) (Supplementary Fig. 11). A kinetic model based on the enzymatic steady-state hydrolysis of Z-GGR-AMC including chemical hydrolysis was used to determine kinetic parameters (Supplementary Table 5).
The first-order kinetic constant for the non-catalyzed (kchem) reaction is comprised between 0.1183+/− 0.0092 min−1 and 0.107+/− 0.012 min−1. As expected, the enzymatic reaction follows Michaelis-Menten behaviour in the substrate concentration range assayed. At day 0, the kcat value is 2.8+/− 0.7 min−1 and reaches 15.8+/− 0.6 min−1 at day 8 indicating that the matured metacaspase is 5 to 6 times more active than the non-matured form. Interestingly, the Km value for Z-GGR-AMC (18 µM) does not change during maturation, which could explain why the substrate binding site is only slightly affected. This suggests that the change in kcat is rather due to the local spatial reorganisation of the catalytic site residues. These observations are supported by the afore mentioned crystal structures of CgMCA-ICa and CgMCA-IMg which highlighted that the presence of calcium narrows the distance between the two catalytic residues stabilizing in the same time this conformation (Fig. 4).
In order to follow the maturation process, purified enzyme was stored at 22 °C in the absence of calcium and activity was determined daily in the presence of 10 mM Ca2+ over 10 days (Fig. 6). The activity curve is a sigmoid that can be interpreted as follows.
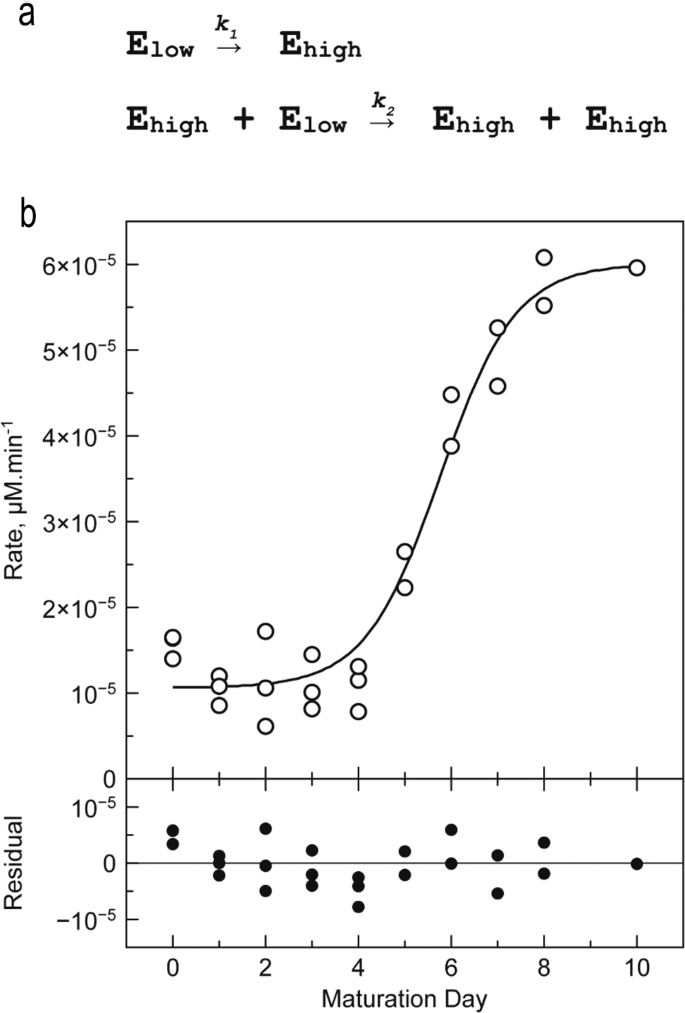
a Two-step model describing the transition of enzymes of the Elow population into enzymes of the Ehigh population. b Hydrolytic activity determined during a 10-days maturation experiment. CgMCA-I (16.5 µM) is stored at 22 °C in 10 mM HEPES buffer pH 7.6, 150 mM NaCl. Reaction conditions: [CgMCA-I] = 2 µM, [Z-GGR-AMC] = 50 µM, 10 mM HEPES buffer pH 7.6, 150 mM NaCl, 10 mM CaCl2 (n = 3 independent experiments).
From days 0 to 4, the activity is slightly higher than the background signal (~10.10−6 µM min−1). The main metacaspase forms E0, E1, E2 identified by gel electrophoresis at the early stage of maturation, are not fully catalytically active (Fig. 1). At day 5, the activity increases sharply reaching a maximum of ~60.10−6 µM min−1 at day 8. This is consistent with the 6-fold increase of kcat observed in the previous experiment. Of these maturation steps, CgMCA-I form E3 identified by gel electrophoresis appears to be the fully active enzyme state. After day 8, all enzyme molecules are mostly in their catalytically active (mature) form.
From an activity point of view, the sigmoid shape of this curve suggests that two enzyme populations exist: a first population (namely Elow) with lowest specific activity comprising E0, E1, and E2 states; and a second population (namely Ehigh) with the highest specific activity composed by the E3 state. In both populations, the distinction between enzymes of the same activity is impossible.
The sigmoid shape of the curve suggests a trans mechanism, i.e. enzymes of the Ehigh population are able to maturate enzyme of the Elow population to afford Ehigh enzymes. Several models were evaluated to describe the kinetic mechanism of the transition from the Elow to the Ehigh population (Supplementary Tables 5, 6). The most acceptable model is a two-step model where the first transition from the Elow to the Ehigh population follows a cis mechanism, whereas the second step is a trans mechanism in which enzymes of the Ehigh population catalyse the maturation of the Elow enzymes into Ehigh enzymes population, similar to an autocatalytic mechanism (Fig. 6a). In order to validate this hypothesis, we mixed a fully maturated enzyme with a catalytic mutant CgMCA-IC238A/H182A, unable to maturate (Supplementary Fig. 12b). We observed after a period of 8 days that the catalytic mutant was indeed maturated by the active enzyme present at low concentration.
Apparent kinetic constants of the first step are about 600 times lower than those of the second step (Supplementary Table 8), thereby explaining why, under our experimental conditions, the appearance of the enzyme with high activity follows nearly an OFF-ON behaviour.
When the reaction is performed in the presence of EGTA (1 mM) or in the absence of calcium, no significant activity is observed during and after eight days evidencing that calcium is required for the activity. In order to assess the affinity of CgMCA-I for Ca2+ at different stages of maturation, we performed nano-DSF experiments and measured the intrinsic fluorescence of CgMCA-I in the absence or presence of Ca2+ after different incubation times (0, 1 h, or 24 h) (Supplementary Fig. 13). For CgMCA-I, the apparent Kd is slightly increasing with incubation time, indicating that even the unmatured form of the enzyme is able to bind Ca2+ (Supplementary Fig. 13b). Concerning, CgMCA-I at day 8 of maturation, the apparent Kd does not change drastically with incubation time and compared to CgMCA-I at maturation day 0 with 24 h of Ca2+ incubation (Supplementary Fig. 13). Altogether, this could indicate that the increased activity from the Elow forms to the Ehigh form would be due to the maturation of the enzyme (successive cleavages) rather than to an increased calcium affinity.
Regarding the cleavage site mutants, they all display different behavior from a catalytic point of view (Supplementary Fig. 14). Mutants K263A, K263F, K263W, and R307A all showed a delay in the activation process. Furthermore, K263F and K263W are less active after eight days of maturation. For mutant R307A, a rapid activation at day 4 but a decreased activity at day 8 was observed, illustrating an aberrant maturation. Mutant R54A showed the most intriguing behavior with a higher activity than that of the wild-type enzyme throughout the maturation process, and could suggest that the N-terminal, when un-mutated, could modulate the metacaspase activity prior to cleavage in the very last step of the maturation. These results also confirmed that the presence of basic residues at the different cleavage sites, at least in vitro, are not mandatory to mature the protein, and that the cleavage is probably more structure-dependent. However, the anarchic levels of activity obtained for the different mutants suggest that a properly matured metacaspase requires the presence of these residues.
Discussion
The present study provides functional and structural evidence on the Ca2+ dependency of metacaspases for their autocatalytic activity. In CgMCA-I, a complete activation requires at least three cleavages resulting in a fully maturated enzyme with its p20 and p10 domains.
We observed that the first cleavage occurred at the C-terminal of the protein forming an independent domain that can be released from the rest of the protein at denaturing conditions (Fig. 1a, b). The second and third cleavages occurred, respectively, at positions 263 and 307, releasing the central loop CgL6 (Asp264-Arg307), and eventually at the N-terminal of the protein (Arg54) (Fig. 1a, b). In the structure of TbMCA-Ib, the catalytic dyad is buried beneath the N-terminal that encircles the main body of the enzyme, and this conformation could indicate that the cleavage of the N-terminal domain may be a prerequisite for complete activation of the enzyme. Regarding the three-dimensional structures of ScMCA-I or CgMCA-I, the N-terminals are not visible, the structures having been determined using mature enzymes. It was suggested that the N-terminal of ScMCA-I had no auto-inhibition role16. The fact that the N-terminal of CgMCA-I is the last part of the enzyme to be cleaved, confirms that its role is not to control or to restrain the autocatalytic activation of this type of enzymes.
Earlier studies reported different catalytic activities regarding the maturation level of metacaspase. For example, processing of Trypanosoma brucei metacaspase 2 TbMCA2 seems to modulate its substrate specificity. The uncleaved/non-processed form (TbMCA2 K55/268G mutant) shows activity towards small synthetic substrates but is unable to cleave larger substrate like azocasein11. This could illustrate the fact that CgMCA-I shows a basal activity before maturation, namely the Elow forms, prior to achieving a fully maturated and active form, namely the Ehigh form. More surprisingly, Coll et al.18, showed that, in Arabidopsis thaliana, the function of AtMC2 which is to negatively regulate cell death, does not depend on its catalytic residues18. This indicates that the cellular function of metacaspase could go beyond a simple maturation and catalytic activation.
Based on the structure and the identified cleavage sites, we questioned the possibility of an autocatalytic cleavage in cis versus an autocatalytic in trans. As previously indicated for the crystal structure of ScMCA-I16, the distances between the catalytic center and the cleaved residues are hardly compatible with a cis cleavage. Our studies confirm that the activation of CgMCA-I could rely on a trans activation. If so, this suggests that the specificity of the cleavage is not dependent on the sequence due to the lack of conservation between the different cleavage sites14,15,16, but rather depends on the target loops conformation. This could also indicate that in order to avoid systematic cleavage, the active site is only accessible or at least restrained to this extended portion of the target proteins, with the accessibility ultimately relying on the presence of basic residues. As described previously, the cleavage of the metacaspase could exist in trans as observed by Watanabe and Lam for rAtMCP2d12. However, the authors suggested that cleavage in cis could exist as well in an even more efficient way. Interestingly, this observation is in agreement with our most probable model. Indeed, it may illustrate the fact that transitions from E0 to E1, E1 to E2, and E2 to E3 would be in cis. Then, as soon as an E3 form (Ehigh form) appears, the trans cleavage would be the most probable. In the cell, we hypothesize that the auto-cleavage could generate an Ehigh form able to transactivate the resting pool of metacaspases.
For substrate accommodation, the active site in metacaspase three-dimensional structures available to date display similar organizations with a loop bundle in which CgL3 and CgL4 are bearing, respectively, the catalytic histidine and cysteine amino acid residues (the loop bearing the catalytic cysteine being termed L2 for the executioner caspase-719 and ScMCA-I16). The bundle moreover consists of loop CgL7 capping the catalytic site (named L519, L320 or loop 34114 for caspase-7, L3 for ScMCA-I16, and the so-called “280-loop” for TbMCA-I14) and loop CgL1 and CgL7α (named L4 for caspase-720 and ScMCA-I16) on each side of the catalytic site. In this assembly, loop L1 (CgL1) observed in metacaspase structures determined so far shows the very same size and orientation14,16,19. As concerns CgL7 (including the αcap) it shows a highly variable sequence, size, and structural organization (Supplementary Fig. 6). In A. thaliana, the catalytic site is capped by the linker domain loop L6. This unique conformation forces a lysine (Lys225) to enter the catalytic site, resulting in the self-inhibition of AtMCA-IId15. In TbMCA-Ib14, the structure determined from a calcium soaked crystal shows a complete reorientation of the 280-loop which forms a two-stranded β-sheet with the N-terminal embedded in the catalytic site. In CgMCA-I, two different organizations are observed as well. In the presence of calcium, loop CgL7 is mainly destabilized, whereas in the presence of magnesium, the loop forms a one turn helix which is stabilized by a hydrogen bond between Asn337 and the side chain of Ser373 and Gln374 (Supplementary Fig. 15). CgL7 is further stabilized by the presence of a Mg2+ which is coordinated by 6 water molecules interacting with the side chain of Asp120 and the main chain of Gly116, Ile338 and Gly339 (Supplementary Fig. 15b, c). Under this conformation, CgL7 is entering the catalytic site forming a hydrogen bond between the catalytic His182 and Thr331 (Supplementary Fig. 15d, e). In addition, comparative studies between CgMCA-ICa and CgMCA-IMg revealed that the presence of the two Mg2+ ions in the loop Asn185-Asp199 engenders an increase in the distance between the two catalytic residues. By substituting the magnesium, Ca2+ could force the enzyme to switch to an active form and lock it under this configuration. Finally, in the study of TbMCA-Ib, it was suggested that a second site of low affinity3,21,22 could exist for Ca2+ playing a role in the control of the catalytic mechanism, but also that the binding could be dependent on the negatively charged residues in the p10 domain. In the CgMCA-IMg structure, Mg2+ is embedded in a negatively charged pocket formed by residues rather coming from the p20 domain like Asp120 (Supplementary Fig. 16). We observed three different binding sites for Mg2+, one sharing the location of the main Ca2+ binding site and the second in the vicinity of the first one, stabilizing the cation binding loop. We hypothesize that the third Mg2+ binding site could correspond to the Ca2+ low affinity binding site described by McLuskey et al., for TbMCA-Ib14. By replacing magnesium, it could reorient loop L7 loop reinforcing the effect of the Ca2+ which interacts with the cation binding loop.
Surprisingly, during this study, we observed a very long period of maturation (eight days without calcium and four days in presence of calcium Fig. 1b). It seems unlikely that a biological mechanism (i.e the autoprocessing of CgMCA-I) that is part of a cell death phenomenon could take place over such a long period of time. In the study of AtMC-IV15, the authors found that the plant metacaspase shows complete maturation after 10 min in presence of 12.5 mM Ca2+. Interestingly, in a recent publication by Aryamloo et al.23, it was observed that C. glabrata, exposed to different concentrations of caspofungin, exhibited the features of late apoptosis/necrosis after 18 h of incubation. Whereas this does not mean that metacaspase is necessarily involved in this phenomenon, it does indicate at a minimum that the apoptotic phenomenon in C. glabrata is relatively short and inferior to one day. Hence, the length of this process in our study could be due to these experiments being performed in vitro and not in vivo. It cannot be excluded that in the cell, protein partners, metacaspase or Ca2+ local concentrations or specific cellular localization could accelerate the process.
Material and methods
Cloning and site-directed mutagenesis experiments
A codon-optimized gene encoding the metacaspase from Candida glabrata was synthesized by GenScript and cloned into the NdeI and BamH1 sites of the pET15b vector (Novagen) with a 6xHis tag fused at the N-terminal (HisCgMCA-I). The construct of CgMCA-I with a His-tag at the C-terminal (CgMCA-IHis) was generated by a first step of amplification using pET15b_CgMCA-I (HisCgMCA-I) as template and oligonucleotide primers (Supplementary Table 1) containing SalI and SacI restriction sites. In a second step, the amplified fragment was cloned into SalI and SacI sites of the pET52 vector (Sigma-Aldrich) with a 10xHis tag at the C-terminal. PCR was performed: 1 × 98 °C for 5 min, 30 × [98 °C for 30 s; 54 °C for 1 min; 72 °C for 2 min] and 72 °C for 20 min. Cloning steps were performed in a DH5α strain and the construct was verified by DNA sequencing. The characteristics of both constructs are summarized in Supplementary Table 2.
The CgMCA-I gene was mutated with oligonucleotides listed in Supplementary Table 1, according to the principle of PCR-mediated point mutagenesis24 and was used for all single mutants: C238A, R74A, K283A, R307A. The double-mutant C238A/H182A was obtained using the single mutant C238A as template and the H182A primers. PCR was performed: 1 × 98 °C for 5 min, 30 × [98 °C for 30 sec; 50 °C for 1 min; 72 °C for 2 min] and 72 °C for 20 min. All constructs were verified by DNA sequencing.
Expression and purification of CgMCA-I and mutants
All constructs of CgMCA-I were overproduced in Escherichia coli T7 express strains (New England Biolabs), cultivated in 2 L of Luria-Bertani (LB, Sigma-Aldrich) medium supplemented by 50 µg mL−1 ampicillin at 160 rpm at 37 °C. CgMCA-I expression was induced by 0.2 mM isopropyl-β-d-thiogalactopyranoside (IPTG, Sigma-Aldrich) when the culture reached an OD600nm of 0.6; the induction was carried out at 160 rpm and 25 °C for 20 h. Cells were harvested by centrifugation at 5000 × g for 15 min at 4 °C and the pellet was resuspended in 60 mL of 10 mM HEPES pH 7.6, 300 mM NaCl lysis buffer in the absence or the presence of 10 mM CaCl2 and supplemented by one tablet of cOmplete, EDTA free protease inhibitor cocktail (Roche), 25 µg mL−1 lysozyme (Sigma-Aldrich), 5 µg mL−1 DNase I and RNase I (Sigma-Aldrich). Bacteria were lysed by using the Microfluidizer (M110P, Microfluidics) at 1500 bar. The lysate was then centrifugated at 11,000 × g for 45 min at 4 °C and the supernatant was applied to a Co-NTA column (HiTrap® TALON® crude 5 mL, GE Healthcare, UK) beforehand washed with lysis buffer containing 30 mM imidazole (Merck), 10 mM CaCl2 and 1% (w/v) glycerol (Euromedex). Elution was performed with an ÄKTA Purifier (GE Healthcare) with a linear gradient from lysis buffer to 100% of elution buffer containing 500 mM imidazole. The eluted protein was then desalted using an HiPrep© Desalting column (GE Healthcare, UK) equilibrated with a desalting buffer composed of 10 mM HEPES pH 7.6, 150 mM NaCl, in the absence or the presence of 10 mM CaCl2 and 1% (w/v) glycerol prior to the experiment. The eluted protein was concentrated using an Amicon Ultra Centrifugal filter with a 30 kDa molecular weight cut-off (MilliporeTM Corporation) and loaded on a gel filtration column (Superdex-200, GE Healthcare) previously equilibrated in the desalting buffer. The protein concentration was assessed with a NanoDrop (Thermo Fisher Scientific) and the purity and molecular mass of the protein were confirmed by SDS-PAGE using a gel composed of 4% stacking and 15% running gel and following Coomassie staining.
Maturation assays
Analysis of the maturation steps of CgMCA-I was performed by purifying the protein in the presence or the absence of CaCl2 (10 mM), MnCl2 (10 mM), MgCl2 (10 mM), ZnCl2 (10 mM) or EGTA (1 mM) (Supplementary Table 3) using a BioSprint 96 (Qiagen) for a rapid purification of the His-tagged protein on Ni-NTA-coated magnetic agarose beads. CgMCA-I was overproduced in E. coli T7 express strains (New England Biolabs®), cultivated in 200 mL of Luria-Bertani (LB, Sigma-Aldrich) medium supplemented with 50 µg.mL−1 ampicillin at 160 rpm at 37 °C. CgMCA-I expression was induced by 0.2 mM isopropyl-β-d-thiogalactopyranoside (IPTG, Sigma-Aldrich) when the culture reached and OD600nm of 0.6; the induction was carried out at 160 rpm and 25 °C for 20 h. Cells were harvested by centrifugation at 5000 × g for 15 min at 4 °C and the pellet was re-suspended in 5 mL of the corresponding lysis buffer (listed in Supplementary Table 2) and supplemented by CLAPA 1X (Chymostatin 1 µg mL−1, Leupeptin 1 µg mL−1, Antipain 1 µg mL−1, Pepstatin 1 µg mL−1, Aprotinine 5 µg mL−1), 25 µg mL−1 lysozyme (Sigma-Aldrich), 5 µg mL−1 DNase I and RNase I (Sigma-Aldrich). Bacteria were lysed by sonication on ice during 3 × 30 s, using a SONIFIER 250 (Branson). The bacterial lysate was clarified by centrifugation at 11,000 x g for 20 min at 4 °C and the supernatant was loaded onto the BiosPrint blocks. The proteins bind via their 6xHis tag to the Ni-NTA-coated surface of the magnetic beads that are then efficiently washed with 100 µL of the corresponding buffer (listed in Supplementary Table 3), removing nonspecifically bound protein while leaving the protein on the matrix. Pure protein is eluted in 100 µL of the corresponding elution buffer (listed in Supplementary Table 4). Elution fractions are collected at days 0, 4, and 8 after purification, supplemented with Laemmli buffer and further stored at – 20 °C prior to their analysis by SDS-PAGE 15%. Elution fractions at days 0, 4, and 8 were also further analyzed by western blot after being separated in a 15% SDS-PAGE and transferred to nitrocellulose membranes for immunoblot. The membrane was incubated with a primary monoclonal anti-His antibody (mouse, 1:5000, SIGMA H1029). Immunoblots were detected using phosphatase alkaline-conjugated anti-mouse secondary antibody (1:10,000, SIGMA A3562) and Sigma-Fast phosphatase alkaline substrate (SIGMA, F4648).
Mass spectrometry
LC-MS/MS analysis
Analysis of CgMCA-I fragments was performed to determine the cleavage sites.
A few hundred ng of proteins samples were injected and analyzed using an Ultimate 3000 nano-RSLC (Thermo Scientific, San Jose California) coupled on line with a Q Exactive HF mass spectrometer via a nano-electrospray ionization source (Thermo Scientific, San Jose California).
Samples were injected and loaded on a C4 Acclaim PepMap300 trap-column 300 µm ID × 5 mm, 5 µm, 300 Å, (Thermo Scientific) for 3 min at 20 µL min−1 with 2% acetonitrile, 0.05% trifluoroacetic acid in H2O and then separated on a C4 Acclaim Pepmap300 nano-column, 15 cm × 75 µm i.d, 5 µm, 300 Å (Thermo Scientific) with a 30 min linear gradient from 3.2 to 80% buffer B (A: 0.1% formic acid in H2O, B: 100% acetonitrile, 0.1% formic acid) and then from 80 to 95% of B in 1 min, hold for 5 min and returned to the initial conditions in 1 min for 13 min. The total duration was set to 50 min and the flow rate was 300 nL min−1. The oven temperature was kept constant at 40 °C.
The mass spectrometer was operated in the positive full MS mode and using a scan range from 500 to 2000 mass-to-charge (m/z). The mass resolution was set to 240,000 at 200 m/z, the AGC target was 3e6, and the maximum injection time was 100 ms.
The deconvolution analyses were processed using Biopharma Finder 2.0 (Thermo Scientific) with the default method Xtract-average over selected mass range (isotopically resolved) that uses a minimal charge state of 5, with at least 3 different charge states to identify a compound, and the accuracy mass tolerance for the deconvoluted MW was set at 20 ppm. The average deconvoluted mass spectrum was obtained resulting in the achievement of a list of MWs corresponding to the detected fragments present in the metacaspase sample. Deconvoluted masses with a relative abundance lower than 1% were filtered out. The resulting list of MWs are compared to the theoretical mass of the amino acid sequence of metacaspase with the potential presence of oxidations on methionines using FindPept tool on the Expasy website (SIB Swiss Institute of Bioinformatics, Expasy).
Enzyme kinetics and characterization
The enzyme solution (16.5 µM) was stored in 10 mM HEPES pH 7.6, 150 mM NaCl at 22 °C in the absence of calcium for at least 8 days. Every day, the activity of the enzyme was measured as follows: reactions were performed in 10 mM HEPES pH 7.6, 150 mM NaCl supplemented by 10 mM CaCl2 with 50 µM Z-GGR-AMC as substrate (10 µL). The reaction media incubated at 25 °C before starting the reaction by the addition of 12.5 µL enzyme (2 µM). The reaction volume was 100 µL. The release of AMC was followed every minute by measuring the fluorescence using an excitation wavelength of 355 nm (bandwidth 9 nm) and an emission wavelength of 460 nm (bandwidth 20 nm). Under these conditions the specific response of AMC is 4309 µM−1. Kinetics were recorded using a Tecan M200 microtiter plate reader (Salzburg, Austria) using black 96-well plates, and all reactions were performed at least in duplicate. Linear parts of the kinetics are used as initial rates and expressed as µM min−1. The control was obtained by replacing the enzyme solution by buffer. Determination of the kinetic constants was done using the same protocol, the only difference being that the final substrate concentration was 0–50 µM and the metacaspase concentration 4 µM. Similar reactions were conducted in the presence of EGTA (1 mM) and in the absence of calcium. Data analysis was performed and kinetic parameters were adjusted using the software package Dynafit25.
Script 1 from the Dynafit software package was used for the determination of the kinetic constants at day 0 (Supplementary Table 5). The script takes into consideration the chemical hydrolysis of Z-GGR-AMC in the absence of any protease. Initial parameters were set arbitrary. A similar script was used to determine the constants of the enzyme at day 8.
The rapid-equilibrium hypothesis is used. Concentrations are in µM.
[task] task = fit; data = rate; approximation = rapid-equilibrium ;
[mechanism] E + S <===> ES : Km dissoc ES ---> E + P : kcat S ---> P : kc
[constants] kcat = 1 ? Km = 25 ? kc = 1 ?
[responses] P = 0.004309
[concentrations] E = 0 ;
[data] variable S directory … sheet MM.csv column 2 | concentration E = 4 | label + Enz column 3 | concentration E = 0 | label - Enz
[output] directory … [settings] {Output} XAxisLabel = [Z-GGR-AMC], microM YAxisLabel = rate, Fluorescence units.min-1 [end]
Model description
The maturation of Elow into Ehigh population could result from three elementary steps:
-
-
a cis mechanism where Elow is converted into Ehigh following first order kinetics
-
-
a trans mechanism in which two Elow molecules are converted into at least one Ehigh molecule (the second being Elow or Ehigh) following second order kinetics
-
-
a trans mechanism where Elow is converted into Ehigh by a pre-existing Ehigh molecule following second order kinetics. This mechanism assumes that one of the previous mechanisms also occurs.
These mechanisms are not exclusive and others could be envisioned by combination of these three elementary steps. Trans mechanisms are usually associated to cooperativity, autocatalysis, or self-amplification processes leading to a sigmoidal behaviour and appears suitable for describing the metacaspase maturation. In order to elucidate the mechanism, several models were implemented and discriminated using the software package Dynafit (Supplementary Table 6). In all models, only two enzyme populations were considered because model discrimination is performed using one single parameter (e.g. activity). Therefore, the early maturation steps such as the conversion of E0 to E1, both low-activity forms, could not be differentiated. The initial Elow concentration is set at 8 µM and is not adjusted to the experimental data. The model response is the reaction rate that is directly related to the concentration of Elow and Ehigh, each form having its own specific response:
where rlow and rhigh are the specific response of Elow and Ehigh, respectively, initially set to 1.25 × 10⁻⁶ µM min−1 µM−1 and to 7.5 × 10⁻⁶ µM min−1 µM−1 and [Elow] and [Ehigh] the molar concentrations of Elow and Ehigh respectively.
Parameters that can be adjusted are specific responses (rlow and rhigh) and kinetic constants (k1 and k2). Model discrimination was performed using three set of initial parameters for each model, leading to 18 different adjustments (Supplementary Table 7). For a detailed explanation regarding the discrimination methodology please refer to the software handbook or to the literature26,27. A single model is found to be acceptable according to the coefficient of variation, adjustable parameters, relative sum of squared deviations, differential AIC/BIC criterion, and Akaike/Bayesian weight. The cis-trans model using parameter set 3 where the k1 constant is set to 0.001 day−1. Optimized parameters are reported in Supplementary Table 8.
Thermostability and calcium affinity
The thermostability of CgMCA-I was assessed using nanoscale differential scanning fluorimetry (nanoDSF; NanoTemper) by measuring the intrinsic dual-UV florescence change in tryptophan and tyrosine residues at emission wavelengths of 330 nm and 350 nm. Experiments were conducted either with the protein at day 0 and day 8 of maturation at 18 °C without CaCl2. Prior to fluorescence measurements, enzyme samples were supplemented with CaCl2 (final concentrations are 0, 0.1, 0.25, 0.5, 1, 2, 5, 7, 10 and 20 mM) and placed in the DSF capillaries. Measurements were performed immediately, after 1 h or after 24 h incubation at 18 °C. Samples were then screened over a temperature range from 25 °C to 95 °C using a heating gradient of 1 °C/min. Each experiment was conducted in duplicates.
Melting temperature for both CgMCA-I at maturation day 0 and day 8 without, after 1 h and after 24 h of maturation are respectively summarized in Supplementary Tables 9 and 10.
Delta Tm were calculated from the difference between melting temperatures in the presence of each CaCl2 concentration and the melting temperature without any CaCl2 (Tm0) for each experiment (Supplementary Fig. 13a). The apparent Kd was determined by curve-fitting using a single binding site model for calcium cations (Supplementary Fig. 13b).
Crystallization, data collection, and structure determination
Screening of crystallization conditions was carried out using the sitting-drop vapor-diffusion method employing commercial crystallization kits: MB Class suite (Qiagen), MB Class II (Qiagen), PEG I (Qiagen), PEG II (Qiagen), PEG ION (Hampton Research), Crystal screen (Hampton Research), MPD (Qiagen), MIDAS+ (Molecular Dimensions) and JCSG+ suite (Qiagen). MRC crystallization plates (Molecular Dimensions) were filled using a Mosquito® crystallization robot (SPT Labtech) and two protein/crystallization agent ratios were tested (200 nL + 200 nL and 200 nL + 100 nL drops equilibrated against 70 µL in the reservoir). Two batches of CgMCA-I led to crystal growth. A first preparation of CgMCA-I at maturation day 0, concentrated to 10.3 mg mL−1 in 10 mM HEPES pH 7.6, 150 mM NaCl, 10 mM CaCl2 resulted in crystals of the protein complexed with Ca2+ (CgMCA-ICa). Crystals of CgMCA-ICa complexed with Ca2+ were grown in 0.2 M (NH4)2SO4, 30% (w/v) PEG 4000. A second preparation of CgMCA-I at maturation day 4, concentrated to 8.2 mg mL−1 in 10 mM HEPES pH 7.6, 150 mM NaCl, 10 mM CaCl2 led to crystal growth of CgMCA-IMg complexed with Mg2+ in 0.2 M Mg Acetate, 20% (w/v) PEG 3350. Crystals appeared in both conditions after three months. Crystals were harvested and further cryo-protected in the same solution to which 15% ethylene glycol had been added. X-ray diffraction data were collected at PXIII beamline (SLS, Suisse) at wavelengths of 0.99999 Å for CgMCA-ICa data and at PROXIMA1 (SOLEIL, Paris) at 0.97857 Å for CgMCA-IMg data. Data were indexed, integrated, and scaled using programs from the XDS package28. The phase problem was solved by molecular replacement using phenix.phaser (PHENIX29) with the structure of Saccharomyces cerevisiae metacaspase (ScMCA-I, PDB entry 4F6O) as search model (66,5% identity)30. Model building was performed using Coot31 and refinement was carried out using PHENIX29. Data collection statistics for CgMCA-ICa and CgMCA-IMg are shown in Table 1.
Small-Angle X-ray Scattering
Samples purified by gel filtration (Superdex-200, GE Healthcare) in 10 mM HEPES pH 7.6, 150 mM NaCl, 1% glycerol, 10 mM CaCl2 were concentrated to 9.6 mg mL−1. SAXS data were collected at the SWING beamline, SOLEIL (Paris-Saclay) in a SEC coupled mode using an analytical Superdex S200 Increase 5/150 (GE Healthcare Life Sciences, U.K) equilibrated in 10 mM HEPES pH 7.6, NaCl 300 mM, 1% glycerol, 10 mM CaCl2. Initial processing was done using PRIMUS32 and calculation of P(r) was carried out using CRYSOL33. Ab initio envelope models of CgMCA-I were generated from the experimental data using DAMMIF34. The envelopes were superimposed onto the crystal structure using the CHIMERA software (University of California, San Francisco).
Statistics and reproducibility
For any activity and interaction analysis (i.e. kinetic constants determination, activity measurements, and thermophoresis), the experiment was conducted using at least two biological and three technical replicates. Representative data of a biological experiment are presented as the mean of two (thermophoresis, n = 2) or three (enzymatic assays, n = 3, ±SD replicates).
Figure rendering
Figures of three-dimensional structures were drawn with PyMol (Schrödinger, http://pymol.org).
Reporting Summary
Further information on research design is available in the Nature Research Reporting Summary linked to this article.
Data availability
The coordinates and structure of CgMCA-ICa and CgMCA-IMg have been deposited in the PDB with respective accession numbers 7QP1 and 7QP0. All other relevant manuscript data are available in the source data provided with this paper and from the corresponding authors upon reasonable request. The source data for all plots are shown in Supplementary Data 1. The uncropped and unedited gel images are included in Supplementary Data 2. The SAXS data have been deposited in the SASBDB with accession number SASDQN5.
References
Galluzzi, L. et al. Molecular mechanisms of cell death: recommendations of the Nomenclature Committee on Cell Death 2018. Cell Death Differ. 25, 486–541 (2018).
Madeo, F., Fröhlich, E. & Fröhlich, K.-U. A yeast mutant showing diagnostic markers of early and late apoptosis. J. Cell Biol. 139, 729–734 (1997).
Klemenčič, M. & Funk, C. Structural and functional diversity of caspase homologues in non-metazoan organisms. Protoplasma 255, 387–397 (2018).
Madeo, F. et al. A Caspase-related protease regulates apoptosis in yeast. Mol. Cell 9, 911–917 (2002).
Herker, E. et al. Chronological aging leads to apoptosis in yeast. J. Cell Biol. 164, 501–507 (2004).
Ivanovska, I. & Hardwick, J. M. Viruses activate a genetically conserved cell death pathway in a unicellular organism. J. Cell Biol. 170, 391–399 (2005).
Lee, R. E. C., Puente, L. G., Kærn, M. & Megeney, L. A. A non-death role of the yeast metacaspase: Yca1p alters cell cycle dynamics. PLoS ONE 3, e2956 (2008).
Hill, S. M. & Nyström, T. The dual role of a yeast metacaspase: What doesn’t kill you makes you stronger. Bioessays 37, 525–531 (2015).
Minina, E. A. et al. Classification and nomenclature of metacaspases and paracaspases: no more confusion with caspases. Mol. Cell 77, 927–929 (2020).
Vercammen, D. et al. Type II Metacaspases Atmc4 and Atmc9 of Arabidopsis thaliana cleave substrates after Arginine and Lysine*. J. Biol. Chem. 279, 45329–45336 (2004).
Gilio, J. M. et al. Processing of metacaspase 2 from Trypanosoma brucei (TbMCA2) broadens its substrate specificity. Biochim Biophys. Acta Proteins Proteom. 1865, 388–394 (2017).
Watanabe, N. & Lam, E. Calcium-dependent activation and autolysis of Arabidopsis metacaspase 2d. J. Biol. Chem. 286, 10027–10040 (2011).
Carraro, M. & Bernardi, P. Calcium and reactive oxygen species in regulation of the mitochondrial permeability transition and of programmed cell death in yeast. Cell Calcium 60, 102–107 (2016).
McLuskey, K. et al. Crystal structure of a Trypanosoma brucei metacaspase. Proc. Natl Acad Sci 109, 7469–7474 (2012).
Zhu, P. et al. Structural basis for Ca2+-dependent activation of a plant metacaspase. Nat. Commun. 11, 2249 (2020).
Wong, A. H.-H., Yan, C. & Shi, Y. Crystal Structure of the Yeast Metacaspase Yca1. J. Biol. Chem. 287, 29251–29259 (2012).
Watanabe, N. & Lam, E. Two Arabidopsis metacaspases AtMCP1b and AtMCP2b are arginine/lysine-specific cysteine proteases and activate apoptosis-like cell death in yeast. J. Biol. Chem. 280, 14691–14699 (2005).
Coll, N. S. et al. Arabidopsis Type I Metacaspases control cell death. Science 330, 1393–1397 (2010).
McLuskey, K. & Mottram, J. C. Comparative structural analysis of the caspase family with other clan CD cysteine peptidases. Biochem J. 466, 219–232 (2015).
Chai, J. et al. Crystal structure of a Procaspase-7 Zymogen: Mechanisms of activation and substrate binding. Cell 107, 399–407 (2001).
Acosta-Maspons, A. et al. Two aspartate residues at the putative p10 subunit of a type II metacaspase from Nicotiana tabacum L. may contribute to the substrate-binding pocket. Planta 239, 147–160 (2014).
Machado, M. F. M. et al. Substrate specificity and the effect of calcium on Trypanosoma brucei metacaspase 2. FEBS J. 280, 2608–2621 (2013).
Aryamloo, P. et al. Cellular apoptosis: An alternative mechanism of action for caspofungin against Candida glabrata. Curr. Med. Mycol. 5, 9–15 (2019).
Heckman, K. L. & Pease, L. R. Gene splicing and mutagenesis by PCR-driven overlap extension. Nat. Protoc. 2, 924–932 (2007).
Kuzmic, P. Program DYNAFIT for the analysis of enzyme kinetic data: application to HIV proteinase. Anal. Biochem. 237, 260–273 (1996).
Policarpo, R. L. et al. High-affinity alkynyl bisubstrate inhibitors of Nicotinamide N-Methyltransferase (NNMT). J. Med Chem. 62, 9837–9873 (2019).
Wei, Y., Kuzmič, P., Yu, R., Modi, G. & Hedstrom, L. Inhibition of IMPDH from Bacillus anthracis: Mechanism revealed by pre-steady state kinetics. Biochemistry 55, 5279–5288 (2016).
Kabsch, W. XDS. Acta Cryst. D. 66, 125–132 (2010).
Adams, P. D. et al. PHENIX: a comprehensive Python-based system for macromolecular structure solution. Acta Crystallogr. D. Biol. Crystallogr 66, 213–221 (2010).
Wong, A. H.-H., Yan, C. & Shi, Y. Crystal structure of the yeast Metacaspase Yca1. J. Biol. Chem. 287, 29251–29259 (2012).
Emsley, P., Lohkamp, B., Scott, W. G. & Cowtan, K. Features and development of Coot. Acta Crystallogr. D. Biol. Crystallogr. 66, 486–501 (2010).
Konarev, P. V., Volkov, V. V., Sokolova, A. V., Koch, M. H. J. & Svergun, D. I. PRIMUS: a Windows PC-based system for small-angle scattering data analysis. J. Appl. Crystallogr. 36, 1277–1282 (2003).
Svergun, D., Barberato, C. & Koch, M. H. J. CRYSOL—a program to evaluate X-ray solution scattering of biological macromolecules from atomic coordinates. J. Appl. Crystallogr. 28, 768–773 (1995).
Franke, D. & Svergun, D. I. DAMMIF, a program for rapid ab-initio shape determination in small-angle scattering. J. Appl. Cryst. 42, 342–346 (2009).
Acknowledgements
The authors thank the SOLEIL synchrotron for access to beamline PROXIMA1, the European Synchrotron Radiation Facility for access to MX-beamlines and the Swiss Light Source for access to beamline PXIII. Technical support from all the beamlines staff is gratefully acknowledged. Authors acknowledge the contribution of SFR Biosciences (UAR3444/CNRS, US8/Inserm, ENS de Lyon, UCBL), especially V. Gueguen-Chaignon from the Protein Science Facility. Support from the CNRS is acknowledged. SP is supported by the EDCTP2 programme from the European Union grant number RIA2017T-2018 WANECAM-2.
Author information
Authors and Affiliations
Contributions
Conceptualization S.P., A.L.B., N.A; LB, formal analysis, A.P, E.D., C.D., B.D., L.C., N.A.; S.V., L.B., funding acquisition N.A.; investigation L.C., FG, L.B., S.V., supervision., N.A, L.B; validation S.P., A.B., B.D., L.C., L.B., S.V.; writing B.D., L.C., S.V., N.A and L.B.
Corresponding authors
Ethics declarations
Competing interests
The authors declare no competing interests.
Peer review
Peer review information
Communications Biology thanks Mauricio Machado, Dušan Turk and the other, anonymous, reviewer(s) for their contribution to the peer review of this work. Primary Handling Editor: Gene Chong. Peer reviewer reports are available.
Additional information
Publisher’s note Springer Nature remains neutral with regard to jurisdictional claims in published maps and institutional affiliations.
Rights and permissions
Open Access This article is licensed under a Creative Commons Attribution 4.0 International License, which permits use, sharing, adaptation, distribution and reproduction in any medium or format, as long as you give appropriate credit to the original author(s) and the source, provide a link to the Creative Commons license, and indicate if changes were made. The images or other third party material in this article are included in the article’s Creative Commons license, unless indicated otherwise in a credit line to the material. If material is not included in the article’s Creative Commons license and your intended use is not permitted by statutory regulation or exceeds the permitted use, you will need to obtain permission directly from the copyright holder. To view a copy of this license, visit http://creativecommons.org/licenses/by/4.0/.
About this article

Cite this article
Conchou, L., Doumèche, B., Galisson, F. et al. Structural and molecular determinants of Candida glabrata metacaspase maturation and activation by calcium. Commun Biol 5, 1158 (2022). https://doi.org/10.1038/s42003-022-04091-4
Received:
Accepted:
Published:
DOI: https://doi.org/10.1038/s42003-022-04091-4
Comments
By submitting a comment you agree to abide by our Terms and Community Guidelines. If you find something abusive or that does not comply with our terms or guidelines please flag it as inappropriate.
