Abstract
Secondary organic aerosol (SOA) plays a significant role in contributing to atmospheric fine particles, as well as in global air quality and climate. However, the current understanding of the atmospheric formation of SOA and its simulation is still highly uncertain due to the complexity of its precursor VOCs. In our study, SOA formation in different mixed VOC scenarios was investigated using a 30 m3 indoor smog chamber. By comparing SOA formation in individual VOC scenarios, it was found that SOA yield from anthropogenic VOCs (AVOCs) can be positively (+83.9%) affected by coexisting AVOCs, while inhibited (−51.4%) by the presence of isoprene, via the OH scavenging effect. The cross-reactions of peroxyl radical (RO2) generated from different AVOCs were proved to be the main contributor (up to 39.0%) to SOA formation, highlighting the importance of RO2 + RʹO2 reactions in mixed VOC scenarios. Meanwhile, the formation of gas-phase organic intermediates of different volatility categories from the RO2 reactions was also affected by the precursor concentration, and a higher SOA yield was found at lower precursor concentrations due to the larger contribution of intermediates with lower volatility. Our study provides new insights into SOA formation by considering the interactions between intermediate products from mixed VOCs.
Introduction
Air pollution characterized by fine particulate matter (PM2.5, with aerodynamic diameter less than 2.5 μm) has attracted considerable attention due to its significant impact on global air quality1, climate change2,3, and human health4,5,6. Secondary aerosol formation is the main driver of PM2.5 pollution7,8. Secondary organic aerosol (SOA) has been recognized as an important component of PM2.5, contributing 20–60%9,10 and up to 30–77% globally to PM2.5 in heavy pollution periods, such as recent episodes in China7,8,11,12.
Volatile organic compounds (VOCs) from a wide range of biogenic and anthropogenic sources are the crucial precursors to SOA13,14,15. Many studies have been conducted to reveal SOA formation mechanisms and to obtain the SOA yields of reactive VOCs16,17,18,19. At present, the SOA yield parameters obtained in individual VOC systems are adopted by the air quality models to predict atmospheric SOA levels without considering the interactions between VOCs20,21. However, SOA levels predicted by the models can be inconsistent with the values observed during field observations22,23. This highlights the limited understanding of the chemical pathways of SOA formation, especially in the context of the presence of mixed VOCs under more atmospherically relevant conditions.
Previous studies implied the presence of interactions between different VOCs during their chemical reactions, which may negatively or positively affect the new particle formation (NPF) and SOA formation depending on the class of VOCs24,25,26,27,28. For example, Kiendler-Scharr et al.24 reported the efficient suppression of NPF by isoprene (one of the main biogenic VOCs, BVOCs), which was attributed to the reduction of OH concentrations with the increase in isoprene concentrations relative to those of coexisting VOCs. McFiggans et al.25 showed that the presence of isoprene can inhibit monoterpene-derived SOA, which was caused by the scavenging of OH by isoprene and the scavenging of highly oxygenated monoterpene products by the oxidation products of isoprene that would otherwise form SOA. Similar suppression effects of isoprene on anthropogenic SOA formation have also been proposed when anthropogenic VOCs (AVOCs, e.g., toluene and p-xylene) coexist with isoprene in the presence of NOx26. However, utilizing isotope-labeled toluene and unlabeled α-pinene, Ahlberg et al.27 found that the presence of anthropogenic SOA could promote the formation of biogenic SOA in an oxidation flow reactor. Meanwhile, mixtures of AVOCs (n-dodecane and 1,3,5-trimethylbenzene) exhibited enhanced SOA formation compared to the individual AVOCs, as reported by Li et al.28, and the interaction between intermediate products from the two AVOCs was considered to be the main reason28. Furthermore, the composition and volatility of SOA from the photo-oxidation of the mixed VOCs (e.g., o-cresol and α-pinene) showed significant differences from those formed in the single VOC systems, which was determined to be caused by a combination of two trade-off effects, i.e., suppression of the formation of lower-volatility products and enhancement of the formation of unique products with lower volatility compared to those formed in the single VOC systems29. These complex effects on SOA formation in mixed VOC systems highlights the need to conduct more studies to further understand the mechanism of SOA formation from mixed VOCs. This is important to the control of SOA and further reduction in PM2.5 considering the stricter guideline value for PM2.5 (5 μg m−3) recently proposed by the World Health Organization (WHO)30.
In addition, our previous study hinted that there may be synergistic effects among aromatic VOCs, considering that SOA formation from gasoline vapors increases non-linearly with increasing aromatic content31. The distinct differences in the oxidation degree of SOA formed at lower and higher VOC concentrations reported by our previous research suggested that the formation of gas-phase intermediates, especially products with low volatility, would change with changes in the initial precursor concentrations, then affecting the formation and composition of SOA from the photo-oxidation of aromatics32. However, the detailed mechanisms have not been clarified. With the development of high-resolution time-of-flight chemical-ionization mass spectrometer (HR-ToF-CIMS), more gas-phase intermediates with a broader volatility range can be detected to better reveal SOA formation mechanisms33,34. Benefiting from this, the self- and cross-reactions of alkylperoxyl radical (RO2) closely related to SOA formation were increasingly understood in various reaction systems35,36,37,38,39. Kroll et al.19 showed that RO2 + RO2 reactions are relatively unimportant in isoprene and H2O2 systems, while Peng et al.38 recently suggested that the RO2 + RO2 reactions are significant to aromatic SOA yields under low NOx conditions and should be considered in the chemical transport models to better estimate SOA formation. Currently, the research on the quantitative contribution of RO2 self- and cross-reactions to SOA formation is still lacking. Moreover, considering the existence of multiple organic and inorganic species from various anthropogenic and biogenic sources in the real atmosphere, more smog chamber experiments involving mixed VOCs (including AVOCs and BVOCs) and NOx are needed to clarify SOA formation under more atmospherically relevant conditions.
In this study, the SOA formation from mixed VOCs was systematically investigated by carrying out a series of photochemical chamber experiments at two clearly differentiated VOC concentration levels in the presence of NOx (~20 ppb), whose concentrations are in the range of average levels observed in urban areas. The roles of RO2 chemistry and precursor concentrations in SOA formation were examined, mainly from the aspect of the gas-phase organic intermediate products and the compositional characteristics of SOA. Meanwhile, the contribution of intermediate products with various volatilities to SOA formation under different mixed VOC systems was estimated and discussed.
Results
SOA formation under different conditions
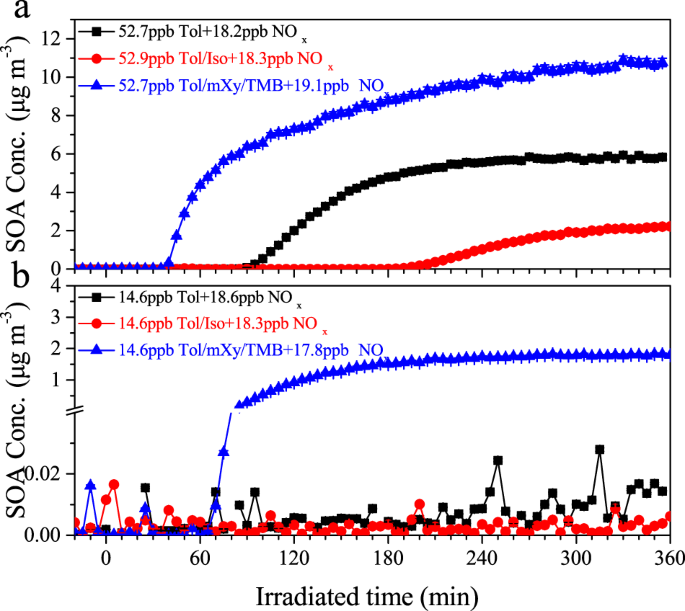
Under different mixed VOC scenarios (including individual AVOCs, mixed AVOCs and BVOCs, as well as mixed AVOCs), a series of photochemical experiments were conducted in the presence of NOx (~20 ppb). The detailed experimental conditions are summarized in Table 1. The HC0/NOx,0 ratio for those experiments had a wide range of 5.5–38.2 ppbC ppb−1, which covers the peak levels of heavy haze events occurred in China40. The temporal evolution of SOA concentrations formed from these photo-oxidation reaction systems is presented in Fig. 1. At higher VOC concentration levels (Fig. 1a), a considerable SOA concentration (Exp. Tol01, 5.8 ± 0.12 μg m−3) was formed in the toluene-only system, and the toluene SOA yield was calculated to be 4.8%, which is comparable to the results reported by previous studies16,17,41. However, this toluene SOA yield obtained in our present study was dramatically lower than those (~0.2–0.5) reported by Zhang et al.42, who conducted the experiments in the presence of high concentration of ammonium sulfate (AS) seed aerosols, which would greatly promote the gas-particle partitioning43. In the presence of isoprene (i.e., mixed AVOC/BVOC scenario, Exp. Tol/Iso02), SOA formation was greatly inhibited by up to 61.7%. This indicated the suppression effect of isoprene on SOA formation, and was consistent with previous studies25,26. In contrast, the highest SOA concentration of 10.8 ± 0.22 μg m−3, which was 85.6% higher than that in the toluene system, was observed with the coexistence with m-xylene and 1,3,5-trimethylbenzene (i.e., mixed AVOC scenario, Exp. Tol/mXy/TMB03). This may imply the enhancement of SOA formation by the coexistence of other AVOCs. Similar changes in SOA production were also found at lower VOC concentrations (Fig. 1b).
SOA concentrations formed from photo-oxidation under different mixed VOC scenarios (i.e., toluene alone, mixed toluene and isoprene, as well as mixed toluene, m-xylene, and 1,3,5-trimethylbenzene) in the presence of NOx (~20 ppb) at a higher and b lower VOC concentration levels. The detailed experimental conditions can be found in Table 1.
To quantitatively evaluate the impact of coexisting VOCs on SOA formation, the toluene SOA yield was calculated after deducting the contribution of other reacted VOC precursors (i.e., isoprene, m-xylene and 1,3,5-trimethylbenzene) to SOA formation, which was determined by an additional series of experiments using individual VOCs (Details seen Supplementary Discussion). In the mixed AVOC/BVOC scenario (i.e., Exp. Tol/Iso02), the addition of isoprene significantly reduced the overall SOA yield and toluene SOA yield to 2.1 and 2.3% (Table 1), respectively, and the latter is 51.4% lower than that in the toluene-only system. In contrast, enhancement of the overall SOA yield and toluene SOA yield to 6.5 and 8.8% (Table 1), respectively were obtained in the mixed AVOC scenario (i.e., Exp. Tol/mXy/TMB03), and the latter was up to 83.9% higher than that in the toluene-only system. These results further suggested that coexisting VOCs indeed will negatively or positively affect SOA formation, depending on the class of VOCs (e.g., distinction between AVOCs and BVOCs). This is probably caused by the OH scavenging effect and changes in the oxidation pathways (e.g., related to RO2 chemistry).
Another notable effect observed in the systems with coexisting VOCs is the time at which SOA began to form (defined as the induction time). Taking the cases of higher VOC concentration as an example (Fig. 1a), the induction time became longer (170 min vs. 75 min) with the addition of BVOCs (i.e., Exp. Tol/Iso02), while it became shorter (30 min vs. 75 min) with the coexistence of other AVOCs (i.e., m-xylene and 1,3,5-trimethylbenzene, Exp. Tol/mXy/TMB03). This was closely related to the formation of gas-phase organic intermediates, thus affecting their contribution to SOA formation via gas-particle partitioning. Details will be discussed in the following section.
SOA formation and gas-phase organic intermediates
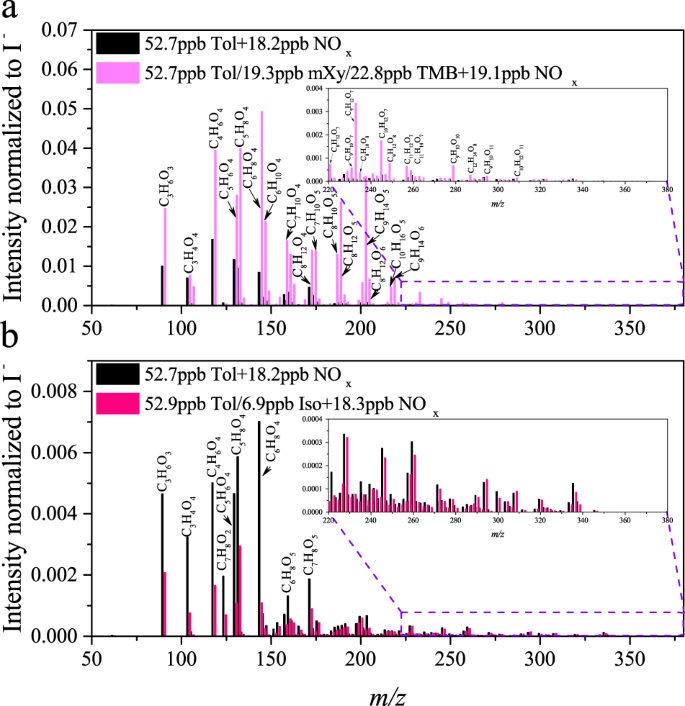
In our study, using an iodide HR-ToF-CIMS33, numerous gas-phase organic products with multiple oxygen- and nitrogen-containing organics could be well identified in the form of iodide-adducts. Figure 2 presents the gas phase mass spectra measured in different mixed VOC scenarios. It can be clearly observed that the intensity of intermediates with larger m/z (>120 Da) was greatly enhanced by the presence of other AVOCs, while being suppressed by the presence of isoprene. This effect is more pronounced in the range of m/z > 220 Da with a greater number of oxygen atoms (>7), as shown in the inset of Fig. 2. These differences suggested that the coexisting VOCs will affect the formation of these intermediates, and thus their contribution to SOA formation.
Gas-phase mass spectra derived from the photochemical experiments under different mixed VOC scenarios (i.e., toluene, mixed toluene and isoprene, as well as mixed toluene, m-xylene, and 1,3,5-trimethylbenzene) in the presence of NOx (~20 ppb) at higher VOC concentration levels. a toluene vs. mixed AVOC scenario and b toluene vs. mixed AVOC/BVOC scenario. Intensities were normalized to the ion source iodide. The assignments of detected ions to individual species were speculated considering iodide-CIMS has an inability to directly provide structural information.
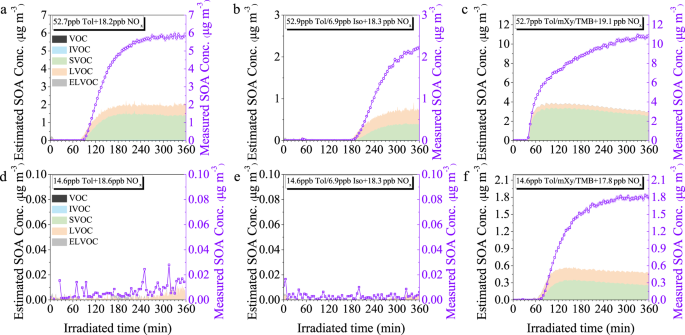
These intermediate products are grouped into five classes based on their saturation vapor pressure (C*, Details can be seen Supplementary Method), i.e., volatile organic compounds (VOC), intermediate volatility organic compounds (IVOC), semivolatile organic compounds (SVOC), low volatility organic compounds (LVOC), and extremely low volatility organic compounds (ELVOC). Further, the quantitative contribution of these species to SOA formation was estimated based on their concentration and gas-particle partitioning coefficient (Details seen Supplementary Method), and the results are summarized in Fig. 3. On average, 27.7–39.2% of the SOA formation can be explained by the gas-particle partitioning of these intermediate products in different reaction systems, where the percentage is equal to the estimated SOA concentration divided by the measured SOA concentration. Similar contribution fractions were also reported by Wang et al.44, who indicated that 26–39% of the organic aerosol mass growth could be explained by the condensation of oxygenated organic molecules (OOMs). This highlights the urgent need to simultaneously obtain the organic gas- and particle-phase information at the molecular level to achieve better accuracy in SOA research.
Estimated SOA concentrations derived from intermediate products (left y-axis) and measured SOA concentrations (right y-axis) under different mixed VOC scenarios (i.e., toluene, mixed toluene, and isoprene, as well as mixed toluene, m-xylene, and 1,3,5-trimethylbenzene) in the presence of NOx (~20 ppb) at a–c higher and d–f lower VOC concentration levels. The detailed experimental conditions can be found in Table 1.
Compared with the estimated SOA concentration derived from these intermediate products in the toluene-only scenario, the value became higher in the mixed AVOC scenario, while it was lower in the mixed AVOC/BVOC scenario with the addition of isoprene. These results were consistent with the trends of SOA concentrations formed in the three scenarios. Meanwhile, it can be found that the start time for the formation of these gas-phase species coincided with the induction time of SOA. These phenomena further suggested that the gas-particle partitioning of these low-volatility organic products was the dominant driving force in SOA formation45. Among the intermediate products, the contribution of ELVOC to SOA formation was relatively small, which was related to the moderate OH exposure (Table 1) used in our chamber study, as well as the insensitivity of iodide-CIMS to such species. Also, SVOC and LVOC were found to be the main contributors to SOA formation regardless of the reaction systems. However, their relative contribution to SOA was different in different reaction systems, which indicated that coexisting VOCs are involved in the formation of intermediate products, mainly through the reaction between RO2 formed from OH oxidation. The RO2 + RʹO2 reactions to form organic peroxide dimers (ROORʹ) was regarded as an important pathway for the formation of highly oxygenated organic molecules (HOMs), which play an important role in the formation and growth of SOA46,47,48,49.
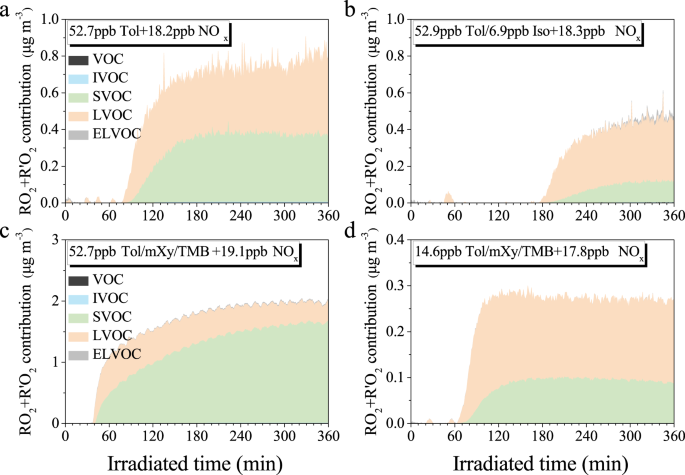
In the mixed AVOC scenario with the coexistence of toluene, m-xylene, and 1,3,5-trimethylbenzene, in addition to the dimeric product C14H18O8 (Supplementary Fig. 1) from the self-reaction of bicyclic peroxy radicals (BPRs, one type of RO2, C7H9O5·) derived from toluene, more dimeric products (i.e., C16H22O8 and C18H26O8, Supplementary Fig. 1) from the self-reaction of BPRs (C8H11O5· and C9H13O5·) formed in the photo-oxidation of m-xylene and 1,3,5-trimethylbenzene, respectively were also generated, as well as dimeric products (e.g., C15H20O8 and C17H24O8, Supplementary Fig. 1) resulting from the cross-reaction of BPRs from different VOC precursors. Meanwhile, a number of dimeric products with odd oxygen numbers were detected (Fig. 2), which may be generated by the cross-reactions of RO2 with odd and even oxygen numbers from different VOC precursors35,50. For example, C9H14O5 shown in Fig. 2 can be attributed to the cross-reaction of CH3O2 radical and C8H11O5 radical, which are formed in the photo-oxidation of toluene and m-xylene, respectively. In addition, the cross-reaction of CH3O2 radical and C9H13O5 radical generated in the photo-oxidation of toluene and 1,3,5-trimethylbenzene, respectively, can form dimeric products with formula C10H16O5, as marked in Fig. 2. The intensities of the mass spectral signals for these organic peroxide dimers were significantly enhanced (Fig. 2), which will greatly promote the formation of SOA. In order to quantitatively evaluate the contribution of organic peroxide dimers derived from RO2 + RʹO2 reactions to SOA formation, all RO2 from the mechanism of the corresponding VOCs recorded in the Master Chemical Mechanism (MCM version 3.3.1, http://mcm.york.ac.uk/) were adopted, and a similar estimation method to that mentioned above was used. Their contributions are presented in Fig. 4, taking the cases of experiments carried out at higher VOC concentrations as an example. The observed evolution trends were similar to the trends in SOA concentrations formed in the three scenarios. Comparing Fig. 3 and Fig. 4, it can be concluded that the contribution of organic peroxide dimers to SOA can account for 39.9% in the toluene-only scenario (i.e., Exp. Tol01), while this contribution increased up to 64.4% in the mixed AVOC scenario with the coexistence of toluene, m-xylene, and 1,3,5-trimethylbenzene (i.e., Exp. Tol/mXy/TMB03). The contributions of organic peroxide dimers formed from the cross-reactions of RO2 from different VOCs and self-reactions of RO2 from the same VOCs were also examined, and the results showed that cross-reactions of RO2 generated from different AVOCs are the main contributors (up to 39.0%, Supplementary Fig. 2). These results suggested the importance of RO2 + RʹO2 reactions to SOA formation.
Contribution of organic peroxides derived from RO2 + RʹO2 under different mixed VOC scenarios (i.e., toluene, mixed toluene and isoprene, as well as mixed toluene, m-xylene, and 1,3,5-trimethylbenzene) in the presence of NOx (~20 ppb) at a–c higher and d lower VOC concentration levels. The detailed experimental conditions can be found in Table 1.
In the mixed AVOC/BVOC scenario with the addition of isoprene (i.e., Exp. Tol/Iso02), although the contribution of organic peroxide dimers to SOA also increased to 64.4%, the formation of gas-phase organic intermediates was significantly suppressed due to the relatively lower OH concentration (reduced by about 50%, Supplementary Fig. 3) by the OH scavenging effect of isoprene25, resulting in less SOA formation compared to the toluene-only scenario. The most intuitively persuasive evidence is that the intensities of mass spectra signals became weaker with the addition of isoprene than those in the individual toluene scenario, especially for C3H6O3, C3H4O4, C4H6O4, C7H8O2, C5H6O4, C5H8O4, C6H8O4, C6H8O5, and C7H8O5, as marked in Fig. 2. These species correspond to products from the reaction of toluene with OH contained in the near-explicit gas phase Master Chemical Mechanism (MCM version 3.3.1, http://mcm.york.ac.uk/)51. The volatility distributions of the gas-phase organic intermediates under different mixed VOC scenarios further supported this conclusion, where the relative intensity of these species (especially for SVOC, LVOC, and ELVOC) became significantly weaker in the mixed AVOC and BVOC scenario with the addition of isoprene (Supplementary Fig. 4).
Effect of precursor concentration on SOA formation
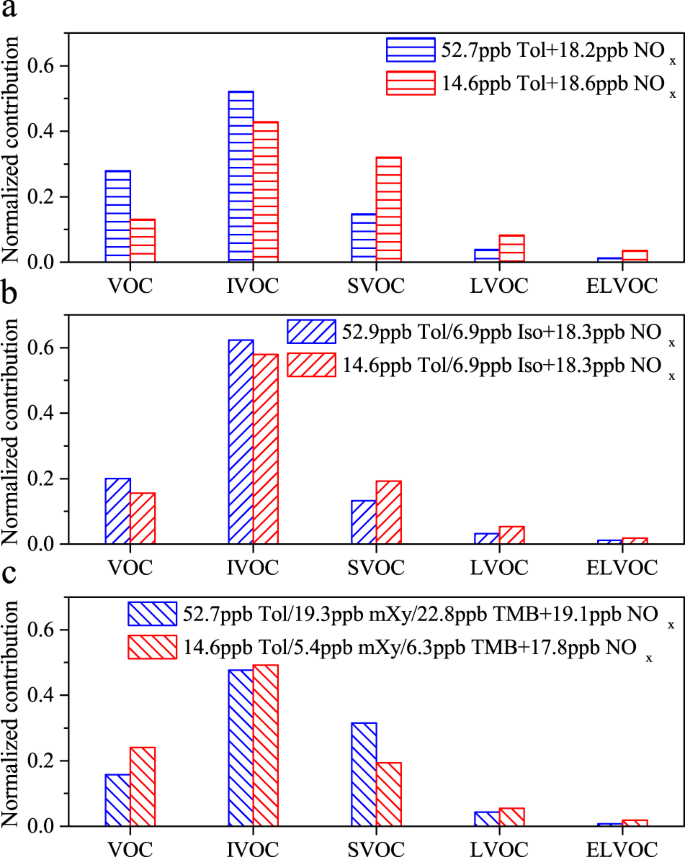
In this study, the formation of gas-phase organic intermediates (i.e., VOC, IVOC, SVOC, LVOC, and ELVOC) under different VOC concentration levels was also compared to reveal the effect of precursor concentration. In the toluene-only system (Fig. 5a), the normalized contributions of SVOC, LVOC and ELVOC, which are more oxidized with lower volatility, were greater at lower precursor concentrations, while the less-oxidized VOC and IVOC category showed the opposite trend. This indicated that VOC precursor concentrations will affect the oxidation process, and thus the volatility distributions of gas-phase products. According to the chemistry of toluene degradation in the Master Chemical Mechanism (MCM version 3.3.1, http://mcm.york.ac.uk/), the rate constant for the reaction of toluene + OH (ktoluene+OH = 5.63 × 10⁻¹² cm3 molecule−1 s−1) is lower than those for the reactions of subsequent products with OH or HO2 (e.g., kcresol+OH = 4.65 × 10⁻¹¹ cm3 molecule−1 s−1, and kBPRs+HO2 = 1.87 × 10⁻¹¹ cm3 molecule−1 s−1). Thus, there was a clear competition between the reactions of toluene and the formed intermediates with OH, and the reaction of the intermediates with OH was dominant. As a result, the proportion of toluene consumed will be lower (42.5% vs. 57.2% for Exp. Tol04 and Exp. Tol01, respectively) and the proportion of more-oxidized intermediates formed will be larger at lower toluene concentration levels, as supported by the greater normalized contributions of SVOC, LVOC and ELVOC mentioned above. This further resulted in a higher oxidation state (OSc = 2 × O/C − H/C, 0.55 ± 0.02 vs. 0.41 ± 0.01) for SOA formed at lower toluene concentration, for which H/C and O/C were derived from the elemental analysis of HR-ToF-AMS data52. Similar results were also observed in the mixed AVOC/BVOC scenario (Fig. 5b). It is worth noting that the effect of precursor concentration was attenuated by the addition of isoprene, as evidenced by the reduction in the gap in the normalized contributions of different VOC categories compared with those in the toluene-only scenario between high- and low-precursor conditions. This was related to the OH scavenging effect of isoprene25, which will reduce the OH concentration in these reaction systems (Supplementary Fig. 3).
Contributions of different classes of gas-phase organic intermediates (i.e., VOC, IVOC, SVOC, LVOC, and ELVOC) formed from photo-oxidation under different mixed VOC scenarios in the presence of NOx (~20 ppb) at higher and lower VOC concentration levels. a toluene, b mixed toluene and isoprene, as well as c mixed toluene, m-xylene, and 1,3,5-trimethylbenzene.
In the mixed AVOC scenario (Fig. 5c), larger normalized contributions of LVOC and ELVOC were also observed at lower precursor concentrations. This was consistent with those in the toluene-only scenario, as well as the mixed AVOC/BVOC scenario. However, the contributions of SVOCs were larger at higher precursor concentrations compared to those at lower precursor concentrations. This was related to the contribution of RO2 + RʹO2 reactions to SOA formation. Comparing Fig. 4c and Fig. 4d, it can be found that a large proportion (up to 81.8%) of SVOC was generated from the RO2 + RʹO2 reactions at higher precursor concentrations, while LVOC became the dominant fraction (up to 66.3%) at lower precursor concentrations. This is partly related to the higher concentration of precursors, but also to the concentration levels of OH in both systems. Under lower precursor concentration conditions, the estimated OH concentration was higher ([OH] = 9.41 × 10⁶ molecule cm−3 vs. 4.28 × 10⁶ molecule cm−3, Supplementary Fig. 3) and a larger proportion of precursors (e.g., the consumption proportion of toluene was 63.6% vs. 36.3% for Exp. Tol/mXy/TMB06 and Exp. Tol/mXy/TMB03, respectively) was consumed. These will collectively result in higher contributions from the VOC and IVOC categories at lower precursor concentration conditions, as shown in Fig. 5c. Meanwhile, a higher OSc (0.17 ± 0.06 vs. −0.19 ± 0.02) was also observed for SOA formed at lower precursor concentrations. Additionally, it is worth noting that a larger toluene SOA yield (3.7% at Mo = 1.8 μg m−3, Table 1) was observed in the mixed AVOC scenario with lower precursor concentrations. Compared to the SOA yields obtained at higher precursor concentrations (Table 1), this SOA yield observed at lower precursor concentrations was significantly different from (t-test, p < 0.05) and greatly higher (1.9 times) than that predicted from the yield curve obtained at higher concentrations (Supplementary Fig. 5). This suggested that the formation and partitioning of low-volatility intermediates (e.g., SVOC, LVOC, and ELVOC) play a crucial role in the oxidation state of SOA, as well as the SOA yield.
Discussion
Aromatic VOCs and biogenic VOCs widely coexist in the atmosphere, mainly originating from motor vehicle and industrial emissions, as well as vegetation in terrestrial ecosystems, respectively13,53. Previous have shown that these VOCs have considerable SOA formation potential and will have a significant impact on global SOA budgets18,23. Our findings demonstrate that SOA yield from anthropogenic VOCs is positively affected (up to 83.9%) by the coexistence of other AVOCs, while negatively influenced by the presence of BVOCs, thus affecting the global budget of anthropogenic SOA. The cross-reactions between intermediate products from different VOCs were proved to be the dominant contributor (up to 39.0%) to SOA formation and widely exist in the photochemical reaction systems of mixed VOCs. This implied that the SOA yield of individual VOCs may be greatly underestimated in the mixed AVOC systems, and it is not reasonable to assume that SOA yields are additive. Meanwhile, this underestimation effect is also affected by the precursor concentration, due to the competing reactions of intermediates and precursors with the main oxidant, OH radical, resulting in a larger SOA yield at lower precursor conditions, which are more relevant to atmospheric levels. Therefore, the careful consideration of interactions between intermediate products from mixed VOCs will provide new insights for the improvement of SOA simulations, and thus provide a basis for the accurate assessment of the physical and chemical properties (e.g., radiative forcing and oxidation state) of SOA.
Additionally, from the perspective of the enhancement of carbon sinks, tree planting has been proposed to offset carbon dioxide (CO2) emissions54, which will enhance the emissions of isoprene and other biogenic VOCs. On one hand, the release of isoprene itself can contribute to SOA formation. A recent study pointed out that the effects of enhanced SOA formation caused by the increased emissions of biogenic VOCs due to future urban greening may offset the benefits of reduced anthropogenic VOC emissions in Los Angeles County55. However, as revealed by our present study and previous studies25, isoprene, one typical biogenic VOC, plays an inhibiting role in the formation of anthropogenic SOA, as well as in new particle formation (NPF). Therefore, more experimental simulations using more types of mixtures of anthropogenic and biogenic VOCs are need to be carefully conducted, in order to provide a more scientific basis for achieving simultaneous reductions in pollution and carbon emissions.
Methods
Smog chamber experimental simulation
A series of photochemical experiments using toluene (Peking Reagent, 99.5%), m-xylene (Sigma-Aldrich, 99.5%), 1,3,5-trimethylbenzene (TMB, Sigma-Aldrich, analytical standard), and isoprene (Sigma-Aldrich, 99%) in the presence of NOx were carried out in a 30 m3 indoor smog chamber that was operated in batch mode and has been described in detail elsewhere56,57. Briefly, the cuboid FEP chamber reactor is located in a temperature-controlled room equipped with an air conditioning system to mechanically control the temperature (T) with a precision of ±1 °C. A Teflon-coated fan was installed at the bottom of the reactor to ensure uniform mixing of pollutants. 120 UV lamps (Philips, 365 nm) were installed to provide an NO2 photolysis rate of 0.55 min−1, which is similar to that at noon in Beijing58.
At the beginning of each experiment, the chamber was flushed using purified and dry zero air for 24–36 h with a flow rate of 100 L min−1 until the concentration of gas-phase species (e.g., NOx, O3, and VOCs) was below the detection limit of the corresponding instruments and the particle number concentration was <10 cm−3. After that, a known volume of one or more liquid VOCs was added into the chamber through a heated Teflon line system (~100 °C) carried by purified and dry zero air. The concentrations of VOCs were measured in real time using thermal desorption combined with gas chromatography coupled to mass spectrometry (TD-GC/MS, UNITY 2, Markes, UK; 7890B GC and 5977 A MS, Agilent, USA). Subsequently, a mass flow controller was used to inject NO into the chamber from a standard NO gas cylinder (1020 ppm in N2, Beijing Huayuan), which contained a tiny fraction of NO2. The NOx concentration was continuously monitored using a chemiluminescence analyzer (Model 42i-TL, Thermo Fisher Scientific, USA). After the reactants (i.e., VOCs and NOx) were mixed well and their concentration were basically stable, the experiment was initiated by turning on the UV lights and continued for about 360 min at a temperature of 26 ± 1 °C and dry conditions (RH ~ 5.0%), during which T and RH were measured in real time using a hydro-thermometer (Vaisala HMP110, Finland). The averaged OH concentration during each experiment was estimated from the first-order degradation of VOCs. An iodide high-resolution time-of-flight chemical-ionization mass spectrometer (HR-ToF-CIMS; Tofwerk AG, Aerodyne Research Inc, USA) was employed to detect the gas-phase intermediate products. The concentrations of O3 and SOA were monitored using a UV photometric analyzer (Model 49i, Thermo Fisher Scientific, USA) and a scanning mobility particle sizer (SMPS, Model 3082 with Model 3776 CPC, TSI, USA), respectively. In addition, a high-resolution time-of-flight aerosol mass spectrometer (HR-ToF-AMS; Aerodyne Research Inc, USA) was utilized to measure the mass concentration and chemical composition of the formed SOA, during which the AMS was alternately run in 3 min V-mode and 2 min W-mode. The ionization efficiency (IE) was regularly calibrated using 300 nm monodisperse and dried ammonium nitrate (AN) aerosols. In this study, HR-ToF-AMS results were corrected using the mass concentration derived from SMPS according to the same method as Gordon et al.59, which had also been described in detail in our previous study60.
Wall loss corrections
Considering the wall loss of gas- and particle-phase species on the Teflon film, all the gaseous species and SOA concentrations were corrected carefully. The wall loss rates of NO2, NO, O3 and VOCs were (1.67 ± 0.25) × 10–4, (1.32 ± 0.32) × 10–4, (3.32 ± 0.21) × 10–4 and (2.20 ± 0.39) × 10–4 min−1, respectively31. The deposition rate constant (kdep, h−1) of an aerosol particle was determined to be related to its diameter (Dp, nm) with a relationship of kdep = 4.15 × 10⁻⁷ × Dp1.89 + 1.39 × Dp−0.88 using polydisperse ammonium sulfate (AS) aerosols, which have been widely used to correct aerosol wall loss in many previous studies41,61,62. Meanwhile, the effects of vapor wall loss on SOA formation were also evaluated in detail, and details can be seen in Supplementary Method.
Data availability
The datasets associated with the current study are available from the corresponding author (honghe@rcees.ac.cn) on reasonable request.
References
Zhang, R. et al. Formation of urban fine particulate matter. Chem. Rev. 115, 3803–3855 (2015).
Shrivastava, M. et al. Recent advances in understanding secondary organic aerosol: Implications for global climate forcing. Rev. Geophys. 55, 509–559 (2017).
Seinfeld, J. H. et al. Improving our fundamental understanding of the role of aerosol-cloud interactions in the climate system. Proc. Natl Acad. Sci. USA 113, 5781–5790 (2016).
Chan, L. K. et al. Relationship between the molecular composition, visible light absorption, and health-related properties of smoldering woodsmoke aerosols. Atmos. Chem. Phys. 20, 539–559 (2020).
Shiraiwa, M. et al. Aerosol health effects from molecular to global scales. Environ. Sci. Technol. 51, 13545–13567 (2017).
Lelieveld, J., Evans, J. S., Fnais, M., Giannadaki, D. & Pozzer, A. The contribution of outdoor air pollution sources to premature mortality on a global scale. Nature 525, 367–371 (2015).
Huang, R.-J. et al. High secondary aerosol contribution to particulate pollution during haze events in China. Nature 514, 218–222 (2014).
Guo, S. et al. Elucidating severe urban haze formation in China. Proc. Natl Acad. Sci. USA 111, 17373–17378 (2014).
Jimenez, J. L. et al. Evolution of organic aerosols in the atmosphere. Science 326, 1525–1529 (2009).
Lee, P. K. H., Brook, J. R., Dabek-Zlotorzynska, E. & Mabury, S. A. Identification of the major sources contributing to PM2.5 observed in Toronto. Environ. Sci. Technol. 37, 4831–4840 (2003).
Li, Y. J. et al. Real-time chemical characterization of atmospheric particulate matter in China: A review. Atmos. Environ. 158, 270–304 (2017).
Chen, T. et al. Measurement report: Effects of photochemical aging on the formation and evolution of summertime secondary aerosol in Beijing. Atmos. Chem. Phys. 21, 1341–1356 (2021).
Atkinson, R. Atmospheric chemistry of VOCs and NOx. Atmos. Environ. 34, 2063–2101 (2000).
Atkinson, R. & Arey, J. Atmospheric degradation of volatile organic compounds. Chem. Rev. 103, 4605–4638 (2003).
Hallquist, M. et al. The formation, properties and impact of secondary organic aerosol: Current and emerging issues. Atmos. Chem. Phys. 9, 5155–5236 (2009).
Li, L., Tang, P., Nakao, S., Chen, C. L. & Cocker, D. R. III Role of methyl group number on SOA formation from monocyclic aromatic hydrocarbons photooxidation under low-NOx conditions. Atmos. Chem. Phys. 16, 2255–2272 (2016).
Ng, N. L. et al. Secondary organic aerosol formation from m-xylene, toluene, and benzene. Atmos. Chem. Phys. 7, 3909–3922 (2007).
Carlton, A. G., Wiedinmyer, C. & Kroll, J. H. A review of secondary organic aerosol (SOA) formation from isoprene. Atmos. Chem. Phys. 9, 4987–5005 (2009).
Kroll, J. H., Ng, N. L., Murphy, S. M., Flagan, R. C. & Seinfeld, J. H. Secondary organic aerosol formation from isoprene photooxidation. Environ. Sci. Technol. 40, 1869–1877 (2006).
Henze, D. K. et al. Global modeling of secondary organic aerosol formation from aromatic hydrocarbons: High- vs. low-yield pathways. Atmos. Chem. Phys. 8, 2405–2420 (2008).
Lane, T. E., Donahue, N. M. & Pandis, S. N. Simulating secondary organic aerosol formation using the volatility basis-set approach in a chemical transport model. Atmos. Environ. 42, 7439–7451 (2008).
Jiang, J. et al. Sources of organic aerosols in Europe: A modeling study using CAMx with modified volatility basis set scheme. Atmos. Chem. Phys. 19, 15247–15270 (2019).
Hodzic, A. et al. Rethinking the global secondary organic aerosol (SOA) budget: stronger production, faster removal, shorter lifetime. Atmos. Chem. Phys. 16, 7917–7941 (2016).
Kiendler-Scharr, A. et al. New particle formation in forests inhibited by isoprene emissions. Nature 461, 381–384 (2009).
McFiggans, G. et al. Secondary organic aerosol reduced by mixture of atmospheric vapours. Nature 565, 587–593 (2019).
Li, K. et al. Suppression of anthropogenic secondary organic aerosol formation by isoprene. npj Clim. Atmos. Sci. 5, 12 (2022).
Ahlberg, E. et al. Secondary organic aerosol from VOC mixtures in an oxidation flow reactor. Atmos. Environ. 161, 210–220 (2017).
Li, J. et al. Enhanced secondary organic aerosol formation from the photo-oxidation of mixed anthropogenic volatile organic compounds. Atmos. Chem. Phys. 21, 7773–7789 (2021).
Voliotis, A. et al. Exploring the composition and volatility of secondary organic aerosols in mixed anthropogenic and biogenic precursor systems. Atmos. Chem. Phys. 21, 14251–14273 (2021).
World Health Organization. WHO Global Air Quality Guidelines: Particulate Matter (PM2.5 and PM10), Ozone, Nitrogen Dioxide, Sulfur Dioxide and Carbon Monoxide (World Health Organization, Press, 2021).
Chen, T. et al. Important role of aromatic hydrocarbons in SOA formation from unburned gasoline vapor. Atmos. Environ. 201, 101–109 (2019).
Chen, T. et al. Differences of the oxidation process and secondary organic aerosol formation at low and high precursor concentrations. J. Environ. Sci. 79, 256–263 (2019).
Lee, B. H. et al. An iodide-adduct high-resolution time-of-flight chemical-ionization mass spectrometer: application to atmospheric inorganic and organic compounds. Environ. Sci. Technol. 48, 6309–6317 (2014).
Wang, M. et al. Photo-oxidation of aromatic hydrocarbons produces low-volatility organic compounds. Environ. Sci. Technol. 54, 7911–7921 (2020).
Molteni, U. et al. Formation of highly oxygenated organic molecules from aromatic compounds. Atmos. Chem. Phys. 18, 1909–1921 (2018).
Bianchi, F. et al. Highly oxygenated organic molecules (HOM) from gas-phase autoxidation involving peroxy radicals: A key contributor to atmospheric aerosol. Chem. Rev. 119, 3472–3509 (2019).
Cheng, X. et al. Highly oxygenated organic molecules produced by the oxidation of benzene and toluene in a wide range of OH exposure and NOx conditions. Atmos. Chem. Phys. 21, 12005–12019 (2021).
Peng, W., Le, C., Porter, W. C. & Cocker, D. R. Variability in aromatic aerosol yields under very low NOx conditions at different HO2/RO2 regimes. Environ. Sci. Technol. 56, 750–760 (2022).
Orlando, J. J. & Tyndall, G. S. Laboratory studies of organic peroxy radical chemistry: an overview with emphasis on recent issues of atmospheric significance. Chem. Soc. Rev. 41, 6294–6317 (2012).
Zou, Y. et al. Characteristics of 1 year of observational data of VOCs, NOx and O3 at a suburban site in Guangzhou, China. Atmos. Chem. Phys. 15, 6625–6636 (2015).
Chen, T. et al. Effect of relative humidity on SOA formation from aromatic hydrocarbons: Implications from the evolution of gas- and particle-phase species. Sci. Total Environ. 773, 145015 (2021).
Zhang, X. et al. Influence of vapor wall loss in laboratory chambers on yields of secondary organic aerosol. Proc. Natl Acad. Sci. USA 111, 5802–5807 (2014).
Odum, J. R. et al. Gas/particle partitioning and secondary organic aerosol yields. Environ. Sci. Technol. 30, 2580–2585 (1996).
Wang, Y. et al. Molecular composition of oxygenated organic molecules and their contributions to organic aerosol in Beijing. Environ. Sci. Technol. 56, 770–778 (2022).
Kroll, J. H. & Seinfeld, J. H. Chemistry of secondary organic aerosol: formation and evolution of low-volatility organics in the atmosphere. Atmos. Environ. 42, 3593–3624 (2008).
Ehn, M. et al. A large source of low-volatility secondary organic aerosol. Nature 506, 476–479 (2014).
Kirkby, J. et al. Ion-induced nucleation of pure biogenic particles. Nature 533, 521–526 (2016).
Tröstl, J. et al. The role of low-volatility organic compounds in initial particle growth in the atmosphere. Nature 533, 527–531 (2016).
Berndt, T. et al. Accretion product formation from self- and cross-reactions of RO2 radicals in the atmosphere. Angew. Chem. Int. Ed. 57, 3820–3824 (2018).
Garmash, O. et al. Multi-generation OH oxidation as a source for highly oxygenated organic molecules from aromatics. Atmos. Chem. Phys. 20, 515–537 (2020).
Mehra, A. et al. Evaluation of the chemical composition of gas- and particle-phase products of aromatic oxidation. Atmos. Chem. Phys. 20, 9783–9803 (2020).
Kroll, J. H. et al. Carbon oxidation state as a metric for describing the chemistry of atmospheric organic aerosol. Nat. Chem. 3, 133–139 (2011).
Guenther, A. et al. A global model of natural volatile organic compound emissions. J. Geophys. Res. Atmos. 100, 8873–8892 (1995).
Domkea, G. M., Oswaltb, S. N., Waltersa, B. F. & Morinc, R. S. Tree planting has the potential to increase carbon sequestration capacity of forests in the United States. Proc. Natl Acad. Sci. USA 117, 24649–24651 (2020).
Gu, S., Guenther, A. & Faiola, C. Effects of anthropogenic and biogenic volatile organic compounds on Los Angeles air quality. Environ. Sci. Technol. 55, 12191–12201 (2021).
Chen, T. et al. Enhancement of aqueous sulfate formation by the coexistence of NO2/NH3 under high ionic strengths in aerosol water. Environ. Pollut. 252, 236–244 (2019).
Chen, T. et al. Smog chamber study on the role of NOx in SOA and O3 formation from aromatic hydrocarbons. Environ. Sci. Technol. 56, 13654–13663 (2022).
Chou, C. C. K. et al. Photochemical production of ozone in Beijing during the 2008 Olympic Games. Atmos. Chem. Phys. 11, 9825–9837 (2011).
Gordon, T. D. et al. Secondary organic aerosol formation exceeds primary particulate matter emissions for light-duty gasoline vehicles. Atmos. Chem. Phys. 14, 4661–4678 (2014).
Chen, T. et al. Significant source of secondary aerosol: formation from gasoline evaporative emissions in the presence of SO2 and NH3. Atmos. Chem. Phys. 19, 8063–8081 (2019).
Wang, N., Jorga, S. D., Pierce, J. R., Donahue, N. M. & Pandis, S. N. Particle wall-loss correction methods in smog chamber experiments. Atmos. Meas. Tech. 11, 6577–6588 (2018).
Takekawa, H., Minoura, H. & Yamazaki, S. Temperature dependence of secondary organic aerosol formation by photo-oxidation of hydrocarbons. Atmos. Environ. 37, 3413–3424 (2003).
Acknowledgements
This work was financially supported by the National Natural Science Foundation of China (22006152, 22188102, and 21876185), and the Young Talent Project of the Center for Excellence in Regional Atmospheric Environment, CAS (CERAE201801). The authors thank Mr. Chunshan Liu of Beijing Convenient Environmental Tech Co. Ltd (http://www.bjkwnt.com/) for their help and support in smog chamber setup. The authors would also like to thank Ms. Qingcai Feng for her help editing this manuscript.
Author information
Authors and Affiliations
Contributions
T.C. conceived the study. T.C. performed the experiments and conducted the data analyses. T.C., P.Z., and Y.G. interpreted and discussed the data results. T.C. wrote the manuscript. H.H. revised the manuscript. All authors contributed to the final paper.
Corresponding author
Ethics declarations
Competing interests
The authors declare no competing interests.
Additional information
Publisher’s note Springer Nature remains neutral with regard to jurisdictional claims in published maps and institutional affiliations.
Supplementary information
Rights and permissions
Open Access This article is licensed under a Creative Commons Attribution 4.0 International License, which permits use, sharing, adaptation, distribution and reproduction in any medium or format, as long as you give appropriate credit to the original author(s) and the source, provide a link to the Creative Commons license, and indicate if changes were made. The images or other third party material in this article are included in the article’s Creative Commons license, unless indicated otherwise in a credit line to the material. If material is not included in the article’s Creative Commons license and your intended use is not permitted by statutory regulation or exceeds the permitted use, you will need to obtain permission directly from the copyright holder. To view a copy of this license, visit http://creativecommons.org/licenses/by/4.0/.
About this article
Cite this article
Chen, T., Zhang, P., Chu, B. et al. Secondary organic aerosol formation from mixed volatile organic compounds: Effect of RO2 chemistry and precursor concentration. npj Clim Atmos Sci 5, 95 (2022). https://doi.org/10.1038/s41612-022-00321-y
Received:
Accepted:
Published:
DOI: https://doi.org/10.1038/s41612-022-00321-y


