
Abstract
To achieve the sustainable development goal of “no poverty”, many attempts have been made to measure poverty so that policy intervention can target the right people with the correct intensity. Since the traditional method of a unidimensional approach using monetary indicators, such as income and consumption, is now considered insufficient, a multidimensional approach has been employed using non-monetary indicators. The latter approach encompasses the different poverty aspects affecting an individual’s capabilities and functioning. This study aimed to calculate multidimensional poverty in Pakistan using the Alkire & Foster method and Pakistan Social and Living Standards Measurement (PSLM) published by the Pakistan Bureau of Statistics data for 2018–19. To further complete the research, a binary logistic regression has been run to measure the effects of a deviation in income status on multidimensional poverty to see the impact of monetary income on non-monetary measures. Results show that the national global Multidimensional Poverty Index (MPI) is 0.24, meaning that multidimensionally poor people in Pakistan experience 24% of the total deprivations. The most deprived dimension of the three is education (44.7%), which needs special attention. Furthermore, if a household’s total annual income increases and becomes more significant than the mean income of the sample, the household’s probability of being multidimensionally poor will decrease. This implies that with the increase in average national income, the national poverty will reduce not only in absolute terms but also multidimensionally. This study’s findings have several implications for policymakers, and the results of the MPI should align the allocation of public sector resources calculated to give a geographical and sectoral image of the poverty situation, which will guide policy designs and allocation of budget and resources.
Introduction
The United Nations Development Program (UNDP) set the Sustainable Development Goals (SDGs) to be achieved by 2030, intending to eradicate poverty globally. The goals could be defined as “measurable, universally agreed upon objectives for tackling extreme poverty and hunger, preventing deadly disease, and expanding primary education to all children, among other development priorities.” (Adlys et al., 2000). Since the initiation of these goals, more than a billion people have been lifted out of extreme poverty. In addition, child poverty was reduced by more than 50%. In 2012, the MDGs were updated and branded as the Sustainability Development Goals (SDGs) at a UN Conference in Rio de Janeiro. These updated goals set out a map targeting the main elements in a state to be tapped to achieve growth. Broadly categorized, they aimed at environmental, political, and economic challenges, with 17 goals, and all interconnected one way or the other. They reaffirmed the “international commitment to end poverty, permanently, everywhere.” (Adlys et al., 2000). This paper addresses the SDGs’ first six goals for poverty, hunger, health, education, gender equality, and sanitation. Based on these goals, the multidimensional poverty index (MPI) calculates the deprivation of said goals, which are treated as enablers of the capabilities and functioning of an individual. Deprivation of these enablers tags the individual as multidimensionally poor. The latest report from the UNDP is the 2022 unpacking deprivation bundles to reduce multidimensional poverty
The traditional method of using a unidimensional approach using monetary indicators, namely functions of Income and Consumption, is now considered an insufficient measure, and non-monetary indicators are required for a multidimensional approach. One of the many advantages of multidimensional poverty is that it gives the composition of poverty at a macro and a micro level. Multidimensional poverty is the index based on non-monetary measures such as education, health, and living standards. The results can be obtained at the lowest possible aggregate level: national, regional (urban and rural), provincial, and district. Based on these goals, the MPI calculates the deprivation of said goals, which are treated as enablers of the capabilities and functioning of an individual. Deprivation of these enablers tags the individual as multi-dimensionally poor. The latest report from the UNDP is the 2022 Global Multidimensional Poverty Index (MPI), Unpacking deprivation Bundles to reduce Multidimensional Poverty” (UNDP and OPHI, 2022).
This study aims to calculate multidimensional poverty in Pakistan at a national, regional, and provincial level. These results identify the areas of social sector performance along with regional disparities that are lacking so that policies can be designed accordingly. In addition, this study aims to understand the impact of policies that have taken place to reduce poverty in society. The study supports the argument of multidimensional poverty by providing debates and results from relevant literature, and an attempt has been made to calculate poverty in Pakistan using this approach. In addition, this study also attempts to see the effect of monetary income on multidimensional poverty to see whether both complement each other.
The forthcoming section defines well-being and provides the relevant literature on why a multidimensional approach to measuring poverty is preferable. Next, it outlines the framework used to calculate the MPI, the Alkire and Foster Model. The third section outlines the data used, the variables designed, and the empirical model formulated. The fourth section provides analyses of the results and presents policy recommendations. Finally, the last section concludes this study.
Literature review
Poverty: from unidimensional to a multidimensional approach
Poverty is the deprivation of well-being. In literature, poverty has been measured in two ways: unidimensional and multidimensionally. The unidimensional approach to measure poverty uses one single measure of well-being: income or consumption. Individuals, families or households below a certain minimum threshold level of income or consumption are considered poor. There are different approaches to measuring the minimum level of income or consumption. Income poverty can be calculated using “Poverty Lines and Consumption Functions”. This approach reflects on monetary poverty, using the basic needs approach and dividing them into food and non-food categories (see Atkinson, 1987).
The ownership of income above the poverty line might still render an individual incapable due to deprivation of non-monetary dimensions such as health, education and living standards. Many empirical researchers have attempted to measure poverty using the cost of living or income (Atkinson et al., 2010; Jäntti and Danziger, 2000; Meyer and Sullivan, 2009; Semega et al., 2017; Ward et al., 2009).
The unidimensional approach is a quick and easy method that uses a monetary value of either income or consumption. Income is a lump sum potential resource, whereas consumption is the actual expense for which quantity and price may be recalled by respondents, and errors may occur. The aggregation principle for both is the same, which is troublesome. In addition, the interchanging of two types of resources may also be problematic.
Critiques have been raised over using income and monetary indicators to define well-being and poverty. Sen stated, “The value of the living standards lies in the living, and not in possessing commodities” (Sen, 1987). Sen described well-being as functioning and capabilities. Functioning can be put as beings and doings that people value, while capabilities are the various functioning combinations people can achieve (Sen, 1992). Amartya Sen describes capabilities through the “capability approach” as the “progress of human freedom and capability to lead the kind of lives that people have reason to value” (Drèze and Sen, 2013). Therefore, poverty is the deprivation of capabilities. And since capabilities are multiple, as are the aspects of life, the measurement of poverty via measuring the deprivation of capabilities brings multi-dimensionality in its measurement.
A question is raised whether being poor can be defined by the ownership of resources. Alkire and Foster (2011) described resources as not having intrinsic value but rather instrumental in gaining utility and value from other objectives. To this end, “people’s ability to convert resources into a valuable functioning (personally and within different societies) varies in important ways” (Alkire et al., 2015). Therefore, poverty is the deprivation of capabilities. Since capabilities are multiple, as are the aspects of life, the measurement of poverty via measuring the deprivation of capabilities brings multidimensionality in its measurement. Poverty is a function of the absence of capability, which is the freedom to pursue a lifestyle. It is the “Holistic and realistic perspective of the tangible manifestations of poverty using social indicators that contribute to the degree of deprivation in poor countries” (Nunes, 2008). We see the reflection of the same multidimensional approach of capabilities in SDGs.
In the concept of multidimensional poverty, two categories exist. The first category states that multidimensional poverty complements income and that “non-monetary well-being problems are usually related to market failures or incomplete markets” (Wang et al., 2016). The second category states that multidimensional poverty can include income as a dimension. Furthermore, it says that capabilities can be improved by an increase in income, which will resultantly help in both monetary and non-monetary domains. A study examined the relationship between income, poverty and multidimensional poverty using the Alkire and Foster method using the China National Survey with 2011 data (Wang et al., 2016). The results showed that 69% of multidimensionally poor households were not income-poor, meaning a 31% coincidence of income poverty and multidimensional poverty was calculated. Hence, the unidimensional and multidimensional approaches to measuring poverty complement each other. If we cannot plausibly construct aggregate variables, then multidimensional approaches to poverty measurement should complement the unidimensional approach. The multidimensional approach may combine different population sizes for each dimension (Alkire and Foster, 2011). However, the approach still needs methodological advancement in aspects such as the subjective choice of dimensions, and the equal weight of dimensions. Data availability and consistency are also concerning issues.
Many studies (Alkire and Santos, 2010; Bourguignon and Chakravarty, 2003; Dotter and Klasen, 2017; Tsui, 2002). Alkire and Santos (2010) are of the view that apart from income, it is an important and more prudent approach to measure poverty through multiple dimensions. Alkire and Santos (2010) emphasized that low income could not identify individuals unable to function in society due to lacking resources, while non-monetary deprivations gave accurate results. Moreover, this method overlooked the clustered disadvantage in the former tests. “Poverty is a condition in which people are exposed to multiple disadvantages- actual and potential.” (Alkire et al., 2015). Stewart et al. (2007) found that 53% of the malnourished children of India were not income-poor, while 53% of poor-income children were not malnourished. Income is unable to act as a proxy for non-monetary deprivations accurately. We find empirical evidence of MPI in several countries, including South Asia and Africa (Abbas et al. 2020; Alkire et al., 2019; Fransman and Yu, 2019; Mushongera et al., 2017). The researchers have used varied indicators to measure poverty and termed it multidimensional poverty (Pomati and Nandy, 2020). In Pakistan, several attempts have been made to measure poverty, but a holistic picture has been missing due to a lack of data and indicators. Jamal (2007) conducted a study using data from 2004–05 to measure the incidence of poverty for only the province (Punjab) of Pakistan. Cheema et al., (2008) used the Multiple Indicators Cluster Survey (2003–2004) to calculate MPI for only one province, Punjab. We found similar studies for a province of Pakistan (Burki et al., 2015; Said et al., 2011). Naveed and Ali (2012) attempted to map multidimensional poverty in the districts of Pakistan by using data from PSLM 2008–09. To address the data issue, according to the proposed Alkire and Foster Methodology of GMPI (Alkire et al., 2018), the national household survey of Pakistan has also been updated to cover all aspects of SDGs and be aligned with GMPI. Global Multidimensional Poverty Index (GMPI) is grouped into three dimensions, and each dimension is allotted an equal weight, ergo 1/3rd, the sum of which is 1. In collaboration with the UNDP and OPHI, the government of Pakistan calculated the multidimensional poverty in Pakistan using the PSLM data from 2014–15 (Ministry of Planning, OPHI, UNDP 2016).
Poverty, entailing both objective and subjective indicators of well-being, is imperative to opt for a holistic conceptualization. In the available literature, the attempts to calculate poverty multidimensionally in Pakistan have several pitfalls, like abstract choosing of indicators for multidimensional poverty that do not adhere to any specific reference, lack of coverage, and issues such as working with an imperfect framework, resulting in their being not wholly accurate and reliable. However, they used 15 indicators, not the conventional ten indicators outlined and approved by the GMPI. Moreover, the unit of analysis they used was a household rather than an individual.
Considering the SDGs, this study’s motivation is to measure poverty multidimensionally at the national and provincial levels to get more insights into poverty than the unidimensional approach. Finding evidence of recent multidimensional evidence is crucial for designing policy interventions according to regional and provincial disparities. The calculation of multidimensional poverty is imperative for impact evaluation and improvement in its methodological discourse. Furthermore, in this study, we will also analyze the impact of monetary income on non-monetary MPI, which will have implications for formulating cash transfer policies. Further, limited studies have analyzed multidimensional poverty in low-income countries (Salecker, Ahmadov, and Karimli, 2020). Hence, this study is motivated by the aforementioned gap and takes Pakistan as the study’s sample.
Methodology
In this study, we aim to calculate the GMPI for Pakistan at the regional and Provincial level using the Pakistan Social and Living Standards Measurement (PSLM) survey 2018–19. The data used for this study is PSLM survey data, which is nationally representative data collected from rural and urban regions of each province. The PSLM collects data using the 2-stage stratified random sampling. Samples are taken from all urban and rural regions except for military-restricted areas. Each stratum consists of several enumeration blocks comprising 200–250 households. These blocks are further divided into high, medium, and low-income categories. From each stratum, enumeration blocks are randomly sampled. This is the primary sampling unit. Then, households are randomly sampled from the randomly selected enumeration blocks, which are the secondary sampling units following Begum (2015). The data used has been extracted from the PSLM Survey conducted in 2018–19, accessed from the Pakistan Bureau of Statistics Microdata portal. For the calculation of MPI, 11 indicators have been sectioned into three dimensions: education, health, and living standards. The dual cutoff approach is employed. Deprivation cutoff points are based on the definitions of the indicators set by the GMPI.
The data used has been extracted from the PSLM Survey conducted in 2018–19, accessed from the Pakistan Bureau of Statistics Microdata portal. Questionnaire sections 2, 4, 5, and 7 of PSLM were used to define the variables of multidimensional poverty. This study has employed the Alkire and Foster multidimensional measure of poverty framework (Alkire et al., 2018). This approach uses the intuitive counting approach to identify people experiencing poverty and explicitly considers the joint distribution of deprivations, showing poverty’s incidence, intensity, and dimensional composition. The dimensional breakdown allows the analysis of the multidimensional poverty composition. Each dimension has been assigned a weight of 1/3. The sum of all dimensions’ weights equals 1 (approximately). Therefore, the weight of the dimension is equally distributed between each indicator of that dimension.
-
1.
The three dimensions are education, health, and living standards. Both education and health have two indicators each (making a total of 4), and the living standards variable has six indicators (which completes the ten dimensions mentioned formerly). Education indicators are years of schooling and school attendance. weights assigned to each are 1/6 (half of 1/3). Health indicators are child mortality and nutrition. Weights assigned to each are 1/6 (half of 1/3). Indicators of living standards are (1) electricity, sanitation, drinking water, floor, cooking fuel, and asset ownership. Weights assigned to each are 1/18 (6 divisions of 1/3). As shown, education and health indicators have a larger weight than indicators of living standards. Deprivation cutoffs have been defined for each indicator to identify the poor according to the sum of joint deprivations for individual experiences shown in Fig. 1 (see Using PSLM 2018–19 we have formulated three dimensions as follows: Education
-
1.
Years of schooling: Data on questions about the highest grade completed in school and age were used to create a dummy variable of deprivation for this indicator.
-
2.
School Attendance: We found that the average age of a school-aged child in class 8 is 15. After age, we used the variables defining educational background. PSLM asked the respondents whether the child was not enrolled in school or had the highest grade completed, which helped derive the deprivation indicator.
Fig. 1: Description of variables,dimensions and indicators used to calculate Global Multi-dimensional PovertyIndex. 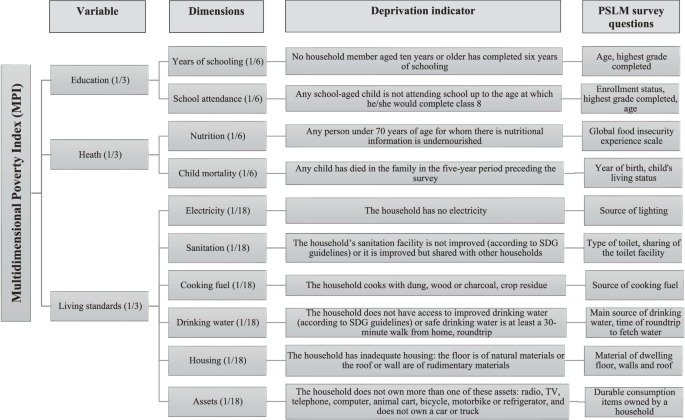
Global Multi-dimensional Poverty Index is calculated using equal weights for three variables: education, health and living standards. Each variable has different dimensions measured through their indicators theoretically. The respective questions asked for each indicator in the PSLM survey has also been provided.
-
1.
-
2.
Health
-
1.
Child Mortality: A child born 5 years preceding the survey dates that are no longer alive falls under child mortality. PSLM asks about the year a child is born and whether the child is alive or not. Therefore, if a child is born after 2013 and is dead, they are deprived of this indicator.
-
2.
Nutrition: Nutritional information for individuals aged 70 years and below is required to define nutrition. Nutritional information has not been mentioned in the PSLM 2018–19 questionnaire. In its place, the “Global Food Insecurity Index”, which consists of 8 questions, was used. We have used “dietary diversity” as a proxy for nutritional information. The question asks: ‘Was there a time when you or others in your household ate only a few kinds of foods because of a lack of money or other resources? Dietary diversity is the number of foods or food groups consumed over a given reference period. The reference period, in this case, is 12 months. Dietary Diversity has been used as a proxy for nutritional status (Oldiges, 2017).
-
1.
-
3.
Living Standards
-
1.
Cooking Fuel: The PSLM survey asks about different types of fuels that households use for cooking. According to WHO guidelines, households using gas, kerosene, LPG/cylinder, and electricity are considered clean cooking fuel, and households are considered not deprived. However, households using firewood, dung cake, coal/charcoal, crop residue, and other sources are using inappropriate cooking fuels and are therefore considered
-
2.
Electricity: PSLM asks about the source of lighting for households by giving options of electricity and no electricity. If a household is not using electricity, it is considered deprived.
-
3.
Sanitation: PSLM asks about the type of toilet a household has. It is considered deprived if a household responds with no toilet, dry pit latrine, dry raised latrine, composting toilet, and others. Another indicator used is whether the household shares their toilet with non-household members. Therefore, they are considered deprived if a household does not have a flush system or shares their toilet with non-household members.
-
4.
Housing: Housing is defined as floors made of natural materials or roofs or walls made of rudimentary materials. Consider the floor. PSLM asks about the main material of the dwelling floor. The household is considered deprived if the floor is made of earth/sand, dung, or others. However, the flooring is adequate if the floor is made from ceramic tiles/marble, parquets/polished wood, cement/cement tiles, or bricks. Another question is whether the roof is made of adequate materials. It is inadequate if it is made of wood/bamboo or other types of material, and roofing is deprived. However, it is adequate if made from RCC/RBC, sheet/cement/iron, or grader/T-Iron. The survey also asks whether the wall is made out of mud bricks/mud, wood/bamboo, plywood/cardboard, stones, or others. The walls are adequate if they are made of burned bricks or rocks. According to the deprivation cutoff points defined by the GMPI, a house is deprived if it is deprived of any one of the three (floor, roof, or wall). To qualify as not being deprived in the indicator housing, the house must have all the floors, walls, and roofs made of adequate materials.
-
5.
Drinking Water: PSLM asks about the source of drinking water. If a household has piped water, a hand pump, a motor pump/tube well, a protected spring, bottled water, or a filtration plant, they have clean drinking water. The unclean drinking water sources include closed well/ open wells, unprotected springs, and other water sources. Another question asks about the time consumed on a round trip to fetch water. Deprivation is considered if a household does not have access to clean drinking water or the clean water is at least 30 min round trip from their house.
-
6.
Asset Ownership: PSLM asks about the durable consumption items owned by the household. A household is considered deprived if “the household does not own more than one of these assets: radio, TV, telephone, computer, animal cart, bicycle, motorbike or refrigerator, and does not own a car or truck”.
-
1.

Some indicators are household indicators, whereas some are individual-specific. The unit of analysis in this study is individual. It is assumed that all the individuals in a household are deprived if a household is deprived of a certain household characteristic. For example, if a household is deprived of electricity, then all the individuals living in it will be deprived in dimension.
As there are three dimensions, 1/3rd weight was given to a single dimension. The indicators were given equal weights in each dimension. Then, multidimensional poverty was calculated as a multidimensional national, provincial and regional poverty index. That is, the adjusted headcount ratio, M0, was found. The value of 1 was given to multidimensionally poor individuals, and the value of 0 was given to those who were not. The formula used to calculate the MPI is:
For aggregation, matrix Y is used. Y1j is the ‘j’ indicator of human welfare for household-1. Y1c is the observation from household-1 taken up to the “c” indicator. Observations are taken from a total of “n” number of households (From household-1 to household-n).
According to the adjusted headcount ratio methodology, a person is labeled poor using the dual cutoff methodology in two steps. First, according to the deprivation cutoff definitions, a deprived person is allotted a score of 1. In contrast, non-deprived individuals are allocated a score of 0, multiplied by the weights assigned to each indicator. These are summed up to calculate the individual’s weighted deprivation score across all indicators. People with weighted deprivation scores equal to or greater than 33.3% will be labeled multidimensionally poor. They are then aggregated to calculate H, the poverty headcount ratio. Next, their weighted deprivation scores are aggregated and averaged for the intensity of poverty, A. Finally, the value of the headcount (H) and intensity (A) of poverty are multiplied to calculate the MPI (M0), as illustrated in the formula below.
The MPI calculated by the Alkire and Foster Model is used to identify poor and non-poor individuals, and it is called poverty.
We also aim to see the effect of monetary income on non-monetary poverty and the association.
Total household income was taken from the PSLM 2018–19 Survey. The mean income was calculated. Households having income up to mean income was assigned as one and zero otherwise.
The empirical model below was employed to calculate the effect of income increase on multidimensional poverty:
The general formula for linear regression is as follows:
Where “Y” is a vector for the dependent variable having k outcomes, and “X” is a vector for independent variables. The number of observations is given by “i”. Y denotes the multidimensionally Poverty score. It is the dependent variable. X is a vector of independent variables including annual income, region (urban/rural), province (Punjab, Sindh, Balochistan, Khyber Pakhtunkhwa), age and gender (male/female).\(\,{\beta }_{1}\) is the slope coefficient and \({\beta }_{o}\) is the Y-intercept with error \(\mu\).
Results
The study includes 24,809 households with 130,538 individuals after data cleaning. The sample consists of 51% females and 49% males. The mean education (years of schooling) ranges from 0–22 years, with a mean of ~2 years and a standard deviation of 4 years. The mean age of the sample is 22 years, with a standard deviation of 8 years. Around 51% of the sample is female, and the rest are male. About 65% of the population lives in areas, and 35% lives in urban areas. The mean annual income of the sample is PKR 326764 with a standard deviation of PKR 411,144. Around 40% of the respondents have an income lower than the mean annual income of the respondents in the sample. Figure 2 shows the percentage of people deprived in each dimension.

National Uncensored Headcount Ratios showing percentage of people who are deprived in each indicator.
As shown in Fig. 2, the highest deprivation has been found in cooking fuel (meaning that 58.271% of the total population at the national level is deprived in this indicator). The second-largest deprived indicator is years of schooling (51.111%), followed by housing (48.974%) and asset ownership (42.063%). The uncensored headcount ratios are lowest for the following indicators: school attendance (25.181%), electricity (11.656%), and households without access to clean drinking water (15.959%). The deprivations show that people are primarily deprived of living standards and education. The macroeconomic policies need to focus on development in Pakistan, which will help improve individuals’ living standards.
Based on these deprivations, the national MPI has been calculated, which has been disaggregated at the regional and provincial levels to provide insights for policymaking.
The Figure shows that the multidimensional poverty’s national headcount (H) ratio is 47.70%, which indicates that more people are multidimensionally poor than monetary poor (40%). The national average intensity of deprivation (A), which shows the share of deprivations that each deprived person experiences on average, is 50.40%. Each poor person is, on average, deprived in almost half of the weighted indicators. As the MPI is the product of H and A, it yields a value of 0.24. This indicates that multidimensionally poor people in Pakistan experience 24% of the total deprivations that would be experienced if all people were deprived in all indicators. The MPI calculated by GoP was 0.197% in 2014–15, calculated as 0.24 in our study. The incidence of poverty estimated by this study is 47.7%, more significant than the previous H0, 38.8% in 2014–15 (Ministry of Planning, OPHI, UNDP 2016). However, in this study, we have used individuals as the unit of analysis, whereas the GoP report takes the household as the unit of analysis. The reference age group for not attending the school is above 10 years, whereas the reference study uses age groups of 6–10 years to identify school attendance. There is also a difference in dimensions between the two studies.
Regions are divided into two areas: urban and rural areas. As depicted, the MPI in rural areas, 0.205, is higher than in urban areas, 0.078. Although the intensity of deprivation is higher in rural areas, 45.30% than in urban areas, 41.90%, this difference is not nearly as significant as the difference in the poverty headcount ratio (H0) between rural areas, 45.20%, and urban areas, 18.60% which mainly is a result of the rural area’s large population share (69.1%). From this number alone, we may not infer that multidimensional poverty is a rural phenomenon, but seeing deprivations in Fig. 2, we may conclude that more people are deprived of living standards such as cooking fuel that may be a rural phenomenon.
Figure 3 shows that multidimensional poverty is highest among Pakistan’s provinces in Baluchistan (0.376), whereas the lowest is in Punjab (0.159). However, on an absolute basis, we can assume that there are more poor individuals in Punjab than in Baluchistan due to the larger population share of the former (48.8%) compared to the latter (9.9%). Considering the standard errors, there is not much difference between the MPI levels of the provinces Sindh and KP, whose MPIs are 0.292 and 0.262, respectively.

The graph provides the incidence and intensity of multi-dimensional poverty across country, provinces and rural/urban areas.
Provincially, the same pattern as the MPI value is followed, with Balochistan having the highest incidence (69.50%), more than double the lowest incidence value, Punjab (33.80%). KPK and Sindh are not too far apart, with KPK in the lead. The same pattern is followed provincially in intensity, with Balochistan having the highest value (54.10%), followed by Sindh (52.50%), then KPK (49.30%), and finally Punjab (47.00%). The difference between the highest and lowest intensity provincially is 6.4%. We may summarize that multidimensional poverty is high in Balochistan’s rural areas, and we need to focus on the dimensions of living standards. The intensity of poverty calculated in this study is comparable with that of the government of Pakistan (GoP).
This study has helped to look deep into disaggregated level of poverty in order to find hotspots of poverty. In addition, it conducts an in-depth analysis of multidimensional poverty by calculating the percentage of each of the ten indicators contributing to Pakistan’s MPI, which itself is evidence that multidimensional poverty has much more capacity than unidimensional poverty for better policymaking. Table 1 shows the weighted percentage contribution of each indicator to depict the composition of multidimensional poverty at provincial and regional levels.
At the national level, the largest contribution to the MPI is by the indicator years of schooling, nutrition and school attendance. If analyzed dimension-wise, the greatest contribution is by the dimension education (44.7%), followed by living standards (35.3%) and health (20%). At the regional level, consider the urban region. The largest contributions are by the indicators of years of schooling (33.3%), attendance (21.8%), and nutrition (21.4%). The MPI’s greatest contribution is by the dimension of education at 42.5%, living standards at 38.1%, and health at 19.4%. A similar trend has been seen at the provincial level. The general trend seems to show that years of schooling is the indicator with the biggest contribution to MPI. After that, the strongest contributors to MPI are nutrition, followed by attendance. The weakest contributor is child mortality in most areas, although it may be replaced with drinking water (Punjab) and access to electricity (urban region). Regarding dimensions, the strongest contributing dimension of education in all areas is living standards and health. Pakistan needs a comprehensive education and health policy to lift people out of multidimensional poverty.
Effect of monetary income on multidimensional poverty
We were eager to know the effect of income on multidimensional poverty to check whether the two approaches complement each other. Table 2 shows the effects of an increase in income on the MPI.
Following the hypothesis used by Wang and Xia (2016), An important question to find is to find the impact of monetary income on non-monetary poverty (MPI). We saw the impact of annual income on MPI score using controls of age, region, gender, and province. We found an inverse relationship between the dependent (poverty) and independent (total household income). According to the results in Table 2, if a household’s total annual income increases and becomes greater than the mean income calculated earlier, the MPI score will decrease. Considering that MPI is the deprivation score, a higher score indicates higher education, health, and living standards deprivation. A person having one-third of the deprivation is considered multidimensionally poor. Males, in contrast to females, people living in urban areas than in rural areas, and Punjab, as compared to Khyber Pakhtunkhwa, have significantly lower MPI scores than their counterparts. Sindh and Balochistan have significantly lower MPIs than Khyber Pakhtunkhwa, but their magnitude is not large. To see the impact of income at the subnational level, we have used the interactions of income with provinces to show whether the higher income in a particular province will impact MPI. People with higher than mean income living in Balochistan have significantly higher MPI scores than people belonging to lower-than-average income groups residing in Khyber Pakhtunkhwa. In short, the monetary source of income may negatively reduce multidimensional poverty by providing the ability to purchase education, health, and living standards. The magnitude is not very high as the access may restrain the purchasing ability.
Conclusion
This study has attempted to calculate multidimensional poverty in Pakistan using PSLM 2018–19 survey data. A multidimensional approach using the Alkire Foster Methodology has been used to calculate MPI at the national, regional, and provincial levels, which will help in the future for longitudinal analysis and understanding disparities within the country for policy interventions. Calculating poverty via MPI can assist in tracking the progress of policies aimed at social and infrastructure targets. In this regard, the MPI is helpful as it sheds light on social indicators rather than pure economic indicators such as income or consumption. It is, therefore, valuable for measuring the progress of the state’s social sector performance. This study employed the Alkire and Foster Framework, which has directed the incidence of poverty, H0, to a high value and thus has made more people worthy of policy attention. According to the Framework, an individual must be deprived in 1/3rd of the ten weighted indicators of the index to be labeled as multidimensionally poor. The value of the national MPI (0.24) indicates that poor people in Pakistan experience 24% of the deprivations if the whole population were deprived in all the indicators of the index. We also tested the effect of income on MPI and found that a significant inverse relationship exists, and this relationship is moderated by province.
As the current research has bridged a limitation of past research (number and choice of indicators and complete Alkire and Foster methodology), it would be helpful for future researchers to conduct such a study on multidimensional poverty at not only a national, regional, and provincial level but also at a district wise level. The advantage of the MPI is that it tabulates poverty at the most disaggregated level, which enables micro-targeting for every area. Unfortunately, district-wise data was unavailable in the PSLM 2018–19 Survey, thus limiting this research. Frequent calculation of MPI with the most recent data will help to compare it temporally and evaluate the performance of policies and interventions.
Implications
The indicator years of schooling is the biggest contributor to the calculated multidimensional poverty. The second indicator of education, attendance, is also a considerable deprivation, although not as much as nutrition. Dietary diversity, the proxy for nutritional information, contributes the second biggest part to the national MPI. The most minor contributors are two indicators of the living standards dimension of electricity access and drinking water, and the indicator of child mortality is even smaller than these. The national policy for poverty alleviation and social sector performance should first focus on education. Years of schooling should be increased, as should the method to manage and increase school attendance. Dietary diversity should also be focused upon. The second most deprived dimension, living standards, has its place due to the indicators of cooking fuel, housing, asset ownership, and sanitation provisions. Policies should focus on providing and ensuring a better standard of living nationally.
Looking at the results regionally, urban areas do not significantly contribute to living standards indicators. Health is the second most deprived dimension after education. The policies should, therefore, be focused more on the former two dimensions. However, the situation in rural areas is similar to the results of the national MPI. Therefore, policies catering to living standards are necessary because it is the second largest deprived dimension. Policy recommendations for Punjab focus firstly on ensuring that years of schooling and attendance, the two most significant contributors to multidimensional poverty in that province, are catered to. Policies enabling multidimensionally poor people access to a diverse range of necessary foods must be designed, as nutrition is the third most significant indicator of multidimensional poverty. The cooking fuel, housing, asset ownership, and sanitation indicators have a rather sizeable joint contribution to multidimensional poverty. Therefore, policies enabling access to such indicators via different means must be implemented. Again, nutrition and dietary diversity should be focused on, while child mortality remains small and insignificant.
However, compared to the other provinces, child mortality has the third most negligible impact on multidimensional poverty in Punjab. In contrast, child mortality is the most minor contributor in the other three provinces. Therefore, it would be prudent to conduct a survey to analyze the situation and design a policy to reduce this contribution. After years of schooling, nutrition and dietary diversity are the biggest issues in Sindh, followed by attendance. Therefore, policies focusing on education and health are imperative. In KPK and Baluchistan, drinking water is the third lowest contributor, and its percentage contribution is a little more than in the other provinces, indicating that access to drinking water is a bigger issue in these two provinces than in other provinces. Therefore, policies to supply adequate drinking water sources must be designed. Other than that, the same pattern of the education dimension and nutrition and dietary diversity is prevalent; therefore, policies should focus on eradicating them, which will significantly impact the MPI—the multidimensionally deprived population percentage in each province’s urban and rural regions. Policies must be balanced between provinces to ensure an equal standard of living conditions is provided nationally.
Data availability
The data used in this study was collected by the Pakistan Bureau of Statistics (PBS) for 2018–2019, through Pakistan Social and Living Standards Measurement (PSLM) survey. For the current study, sections 2, 4, 5, and 7 of the PSLM survey were used as the variable’s measurement. Subsequently the datasets provided in the supplementary file include respondent’s responses on survey sections 2, 4, 5, and 7. The complete survey and respective separate sections of the data are available publicly on the Pakistan Bureau of Statistics website: https://www.pbs.gov.pk/content/pslm-hies-2018-19-microdata.
References
Abbas K, Li S, Xu D, Baz K, Rakhmetova A (2020) Do socioeconomic factors determine household multidimensional energy poverty? Empirical evidence from South Asia. Energy Policy 146:111754. https://doi.org/10.1016/j.enpol.2020.111754
Adlys P, Ambrozaitiené D, Andreikénas A, Dapsiené G, Eidukiené V, Sapoliené A (2000) Human Development Report 2000. UNDP (United Nations Development Programme). https://hdr.undp.org/content/human-development-report-2000
Alkire S, Foster J (2011) Understandings and misunderstandings of multidimensional poverty measurement. J Econ Inequal 9:289–314
Alkire S, Kanagaratnam U, Suppa N (2018) The global multidimensional poverty index (MPI): 2018 revision. OPHI MPI methodological notes no 46, Oxford Poverty and Human Development Initiative (OPHI). University of Oxford
Alkire S, Roche JM, Ballon P, Foster J, Santos ME (2015) Multidimensional poverty measurement and analysis. Oxford University Press, USA
Alkire S, Santos, ME (2010) Acute Multidimensional Poverty: A New Index for Developing Countries. Oxford Poverty & Human Development Initiative (OPHI) Working Paper No. 38, United Nations Development Programme Human Development Report Office Background Paper No. 2010/11. https://doi.org/10.2139/ssrn.1815243
Alkire S, Ul Haq R, Alim A (2019) The state of multidimensional child poverty in South Asia: a contextual and gendered view
Atkinson AB (1987) On the measurement of poverty. Econometrica: J Econ Soc, 55(4):749–764
Atkinson AB, Marlier E, Montaigne F, Reinstadler A (2010) Income poverty and income inequality. In Income and living conditions in Europe. Publications Office of the European Union, p 101–131
Begum S (2015) The Livelihood and Poverty Mapping Analysis at Regional Level in Pakistan. https://edepot.wur.nl/355191
Bourguignon F, Chakravarty SR (2003) The measurement of multidimensional poverty. J Econ Inequal 1:25–49
Burki AA, Memon R, Mir K (2015) Multiple inequalities and policies to mitigate inequality. OXFAM Research Report. https://oi-files-d8-prod.s3.eu-west-2.amazonaws.com/s3fs-public/file_attachments/rr-multiple-inequalities-pakistan-110315-en.pdf
Cheema A, Khalid L, Patnam M (2008) The geography of poverty: evidence from the Punjab. Lahore J Econ 13:163–188
Drèze J, Sen A (2013) An uncertain glory. In: An Uncertain Glory. Princeton University Press
Dotter C, Klasen S (2017) The multidimensional poverty index: achievements, conceptual and empirical issues. https://www.econstor.eu/bitstream/10419/162856/1/893991872.pdf
Fransman T, Yu D (2019) Multidimensional poverty in South Africa in 2001–16. Dev South Afr 36(1):50–79
Jamal H (2007) Income poverty at district level: An application of small area estimation technique. Social Policy and Development Centre
Jäntti M, Danziger S (2000) Income poverty in advanced countries. Handb Income Distrib 1:309–378
Meyer BD, Sullivan JX (2009) Five decades of consumption and income poverty (No. w14827). National Bureau of Economic Research
Ministry of Planning, Development & Reform (2016) Multidimensional poverty in Pakistan. Available at https://ophi.org.uk/sites/default/files/MPDR_OPHI_UNDP_Multidimensional_poverty_Pakistan_2016.pdf
Mushongera D, Zikhali P, Ngwenya P (2017) A multidimensional poverty index for Gauteng province, South Africa: evidence from Quality of Life Survey data. Soc Ind Res 130(1):277–303
Naveed A, Ali N (2012) Clustered deprivation: district profile of poverty in Pakistan. Sustainable Development Policy Institute (SDPI)
Nunes C (2008) Poverty measurement: the development of different approaches and its techniques. Working Papers 93, ECINEQ, Society for the Study of Economic Inequality
Oldiges C (2017) Measuring malnutrition and dietary diversity: theory and evidence from India. OPHI Working Papers (108)
Pomati M, Nandy S (2020) Assessing progress towards SDG2: Trends and patterns of multiple malnutrition in young children under 5 in West and Central Africa. Child Indic Res 13:1847–1873
Said F, Musaddiq T, Mahmud M (2011) Macro level determinants of poverty: investigation through poverty mapping of districts of Pakistan. Pak Dev Rev 50(4):895–910
Salecker L, Ahmadov AK, Karimli L (2020) Contrasting monetary and multidimensional poverty measures in a low-income Sub-Saharan African Country. Soc Indic Res 151:547–574
Semega JL, Kayla R, Kollar MA, (2017). Income and poverty in the United States: 2016. Current population reports. https://www.census.gov/content/dam/Census/library/publications/2017/demo/P60-259.pdf
Sen A (1992) Inequality reexamined. Oxford University Press
Sen AK (1987) The standard of living. Cambridge University Press, Cambridge
Stewart F, Saith R, Harriss-White B (2007) Defining Poverty in Developing Countries. Basingstoke:Palgrave Macmillan
Tsui KY (2002) Multidimensional poverty indices. Soc Choice Wel. 19:69–93
UNDP (United Nations Development Programme), OPHI (Oxford Poverty and Human Development Initiative) (2022). 2022 Global Multidimensional Poverty Index (MPI): Unpacking deprivation bundles to reduce multidimensional poverty. United Nations Development Programme, New York
Wang S, Feng H, Xia Q, Alkire S (2016) On Relationship between Income Poverty and Multidimensional Poverty in China (No. 101). Queen Elizabeth House, University of Oxford
Ward T, Lelkes O, Sutherland H, Tóth IG (Eds.) (2009) European inequalities: social inclusion and income distribution in the European Union. https://nbn-resolving.org/urn:nbn:de:0168-ssoar-58701
Author information
Authors and Affiliations
Contributions
Haq, W conceptualized the idea, designed the study, analyzed the data, and wrote and revised the manuscript. All other coauthors were equally involved in analysis of the data, writing, and proofreading of the manuscript.
Corresponding author
Ethics declarations
Competing interests
The authors declare no competing interests.
Ethical approval
Ethical approval was not required as the current study used public data. The data is publicly available on the Pakistan Bureau of Statistics website (https://www.pbs.gov.pk/content/pslm-hies-2018-19-microdata).
Informed consent
As the data used in this study is secondary, informed consent is not applicable.
Additional information
Publisher’s note Springer Nature remains neutral with regard to jurisdictional claims in published maps and institutional affiliations.
Supplementary information
Rights and permissions
Open Access This article is licensed under a Creative Commons Attribution 4.0 International License, which permits use, sharing, adaptation, distribution and reproduction in any medium or format, as long as you give appropriate credit to the original author(s) and the source, provide a link to the Creative Commons licence, and indicate if changes were made. The images or other third party material in this article are included in the article’s Creative Commons licence, unless indicated otherwise in a credit line to the material. If material is not included in the article’s Creative Commons licence and your intended use is not permitted by statutory regulation or exceeds the permitted use, you will need to obtain permission directly from the copyright holder. To view a copy of this licence, visit http://creativecommons.org/licenses/by/4.0/.
About this article

Cite this article
Haq, W., Azam, M., Babar, Z. et al. Investigation of multidimensional poverty in Pakistan at the national, regional, and provincial level. Humanit Soc Sci Commun 11, 517 (2024). https://doi.org/10.1057/s41599-024-03005-5
Received:
Accepted:
Published:
DOI: https://doi.org/10.1057/s41599-024-03005-5
