
Abstract
The formal recycling of waste electrical and electronic equipment (WEEE) has long faced collection difficulties owing to the inadequate recycling system and insufficient collection capacity under China’s fund-based recycling model. The government has introduced the recycling Target Responsibility System (TRS) to motivate producers to develop and share recycling systems, yet without clear incentive mechanisms. In this study, we provide a “1 + N” shared recycling model referring to the theory of the sharing economy, and we propose a credit mechanism with a deposit system and a penalty mechanism for dishonesty to constrain the opportunistic behavior of sharing. In addition, according to the TRS, we design a “reduction-penalty-subsidy” fund policy to incentivize producers and recyclers to achieve recycling targets. On this basis, we apply evolutionary game theory and system dynamics approach to analyze the collaborative mechanism of shared recycling and the incentive effect of the funding policy. Game analysis yields the evolution of shared recycling from the developing stage to the mature stage. The system simulation results indicate that the government’s “penalty” and “subsidy” strategies provide evident incentives for producers and recyclers, respectively, in the developing stage, whereas endogenous dynamics derived from economies of scale under market mechanisms promote the multi-agent collaborative implementation of shared recycling in the mature stage.
Introduction
The energy crisis and environmental degradation have become significant obstacles to economic and social development. Waste electrical and electronic equipment (WEEE) contains various recyclable resources and hazardous substances (Habib et al. 2022; Shittu et al. 2021a). More than 50 million tons of WEEE are generated globally each year; unfortunately, over two-thirds are recycled informally, resulting in a serious waste of resources and an increase of environmental hazards (Anandh et al. 2021; Baidya et al. 2020; Shittu et al. 2021b). China is the largest producer and consumer of electrical and electronic equipment (EEE) as well as one of the world’s largest producers of WEEE (Zeng et al. 2016; Zhang et al. 2021). To achieve standardized management and ecological recycling of WEEE, the Chinese government has implemented the Extended Producer Responsibility (EPR) system in the EEE industry since 2011 (Wang et al. 2017; Zhou et al. 2017). The EPR system promotes the development of formal recycling by collecting funds from producers to subsidize qualified processors, a policy that has dramatically improved resource and environmental efficiency (Sun et al. 2022). However, owing to the inadequate recycling system and low collection capacity of formal recycling, informal sectors still collect and recycle more than 60% of WEEE (Cao et al. 2016; Wang, et al. 2022a). Formal recycling has long faced the dilemma of “excessive processing capacity, but the lack of sufficient WEEE supply to process” (Fu et al. 2020; Sun et al. 2022), so the Chinese government introduced a Target Responsibility System (TRS) based on EPR in 2021. The TRS encourages EEE producers to establish a recycling system to collect and recycle WEEE, with the aim of improving the collection capacity and recycling rate of formal recycling. However, the cost of establishing a recycling system is relatively high for the producer on its own, with the various stakeholders unwilling to cooperate horizontally. As a result, incentivizing producers to proactively implement a TRS and fulfill physical responsibilities has become an urgent concern for the industry and government.
Scholars have intensely debated the forms and ways in which producers fulfill their WEEE recycling responsibilities based on EPR. These scholars most often focus on emphasizing producers’ economic responsibilities through fund levy and tax regulation, while neglecting their physical responsibilities for collection and recycling (Gao and Chen, 2024; Wang et al. 2017; Zhao et al. 2020). In addition, the responsible agents in all links of the product life cycle, including producers, retailers, collectors, and recyclers, should complete the collection and recycling of WEEE together according to the principle of EPR (Koshta et al. 2022; Li et al. 2022; Liu, et al. 2021a). However, to maximize their own interests, these formal recycling stakeholders prefer to compete rather than cooperate with each other under channel and price competition (Favot et al. 2022; Yu et al. 2022), which worsens the dilemma of limited collection capacity and insufficient competitiveness of formal recycling in the current multiple recycling models. Scholars have studied the vertical cooperation between upstream and downstream stakeholders of WEEE recycling from the perspective of supply chain management (Jian et al. 2019; Li et al. 2022; Zuo et al. 2020), but they have yet to explore in depth the mechanism of horizontal cooperation and sharing of reverse logistics resources (Tian et al. 2020). Overall, there is a research gap between incentive mechanisms for producers to fulfill their physical responsibilities and sharing mechanisms in the reverse logistics supply chain. Therefore, it is critical to design an innovative recycling model and corresponding incentive mechanism to meet the needs of the TRS in theoretical research.
When implementing collective EPR, producers cooperate in recycling by jointly investing in a recycling system, which is conducive to improving cost-effectiveness (Gui et al. 2018b) and realizing economies of scale and scope (Gui et al. 2016; Tian et al. 2019). Meanwhile, the TRS proposes that producers should optimize recycling channels and guide producers and recyclers to build and share a recycling system for WEEE. In this study, we introduce the concept of shared logistics into WEEE recycling, and we propose an innovative “1 + N” shared recycling model of WEEE under the TRS referring to the theory of the sharing economy. Property rights theory, collaborative consumption theory, and multilateral platform theory form the basis of the sharing economy. According to the theory of collaborative consumption (Botsman and Rogers, 2010), an EEE producer leads the effort to develop a recycling network system for sharing, and N recyclers participate in and pay for shared recycling resources, thus improving the capacity and efficiency of collaborative recycling through the scaled-up and intensive allocation of logistics resources. The theory of property rights decomposes property rights into use rights, ownership rights, and transfer rights (Coase, 2013), and the “temporary transfer of use rights” is an essential feature of the sharing economy (Belk, 2014). In shared recycling, the dominant producer transfers the use rights of the logistics resources to demanders with actual needs but holds the ownership and management rights independently, which avoids the responsibility-sharing problem in cooperative recycling. The bilateral platform theory holds that the sharing economy is essentially a platform economy (Mair and Reischauer, 2017; Rochet and Tirole, 2006), so the central work of the platform in shared recycling can resolve the coordination failure of bilateral markets in cooperative recycling and internalize negative externalities in the WEEE recycling supply chain through the clustering effect of platform networks. On this basis, we designed a “reduction-penalty-subsidy” fund policy to incentivize producers and recyclers to achieve the recycling targets.
In this study, we comprehensively applied evolutionary game theory and system dynamics (SD) methods to explore the collaborative mechanism of multi-agent implementation of shared recycling under the TRS. Based on game analysis and system simulation, we drawn some meaningful conclusions. First, shared recycling is a feasible and efficient recycling model that increases recycling efficiency, reduces recycling costs, and enhances collection capacity. In its developing stage, policy support is a prerequisite and guarantee for shared recycling, so the government should increase financial inputs with a view to improving the ecological environment and enhancing social welfare before taking the initiative to withdraw from the market when shared recycling enters the mature stage. Second, the combination of a reduction-penalty-subsidy fund policy effectively promotes the synergistic implementation of shared recycling, among which the “penalty” and “subsidy” strategies create significant incentives for producers and recyclers to accomplish the recycling goals, respectively. Third, the recyclers’ participation strategy affects producers’ decision-making behavior, so producers should focus on controlling the marginal cost of recycling and take the initiative to reduce the sharing fee to mobilize recyclers to participate in the sharing of incentives after obtaining the excess returns that the scale effect generates. In addition, opportunistic behavior in shared recycling is unavoidable, and the credit constraint mechanism can effectively guarantee the smooth implementation of shared recycling only if the deposits and penalties are within a certain threshold.
In this study, we attempt to fill the research gaps and deficiencies mentioned above, and we make the following significant contributions. We developed an innovative WEEE shared recycling model that bridges the research gap in horizontal cooperation and sharing between reverse logistics subjects and provides a new theoretical perspective for the responsible subjects to fulfill the physical responsibility of WEEE recycling under collective EPR. Then, we designed a credit mechanism for shared recycling with a deposit system and a two-way penalty system for breach of trust as the main content, which restrains the opportunistic behavior of the participants in shared recycling. In addition, we proposed a fund policy of reduction-penalty-subsidy in the context of the EPR in China to incentivize producers and recyclers to achieve recycling targets through cooperation and sharing in the recycling of WEEE, thus catering to the demand for the recycling TRS. Moreover, combining evolutionary game and system dynamics methods, we analyzed the operation mechanism of shared recycling and verified the effectiveness of the reduction-penalty-subsidy fund policy in the Chinese context, providing reliable empirical evidence for shared recycling and TRSs. It is undeniable that the fund system, a blood transfusion-based incentive method, is not a long-term solution, and relying on subsidies alone is tantamount to drinking poison to quench thirst. Therefore, our findings have a strong practical value, and the government can formulate corresponding incentive mechanisms based on them to promote the industry’s sustainable development.
Theoretical background
Extended producer responsibility and targeted responsibility system
EPR makes the producer responsible for the product’s whole life cycle, in particular the recycling and final disposal of the product after it is discarding, to achieve the environmental goal of reducing a product’s total environmental impact (Atasu et al. 2009; Compagnoni, 2022). EPR extends the producer’s responsibility for the product to the postconsumer stage of the product life cycle, making it an effective means of governing the environmental externalities of EEE (Lifset, 1993). Lindhqvist (2000) defined five types of responsibility: informative, physical, economic, liability, and ownership. The fund system, deposit system, and target management system (TMS) are internationally well-established systems of EPR (Shan et al. 2021; Wang et al. 2017). In the fund system, the producer (importer) of a product pays the government authority or specific third-party organization for the collection, disposal, and recycling of the product after it is discarded, the fund is then earmarked for the recycling of the waste. The TMS makes it mandatory for the producer (importer) to take responsibility for the recycling of their postconsumer products and to meet certain targets by means of regulations or administrative directives.
In 2009, the State Council of China issued The Regulations on the Administration of the Recovery and Disposal of Waste Electric and Electronic Equipment, which clarified the establishment of a special fund for recycling and disposal according to the principle of EPR while promoting the development of standardized recycling. The Ministry of Finance enacted the Management Measures for the Collection and Use of WEEE Treatment Fund in 2012, marking the formal implementation of EPR with a fund system as its core in China. The operation model of the fund in China is that the administration of taxation charges the fund from the producer and remits it to the pool of processing funds that the Ministry of Finance operates. The fund audit agency, under the Ministry of Ecology and Environment’s supervision, then subsidizes qualified dismantling processors (Gu et al. 2017). The formal processing industry purchases WEEE that third-party collectors collect for dismantling. Recyclers and disposers then ecologically recycle and finally dispose of the WEEE (Zhang et al. 2020). The producer is not obliged to fulfill their physical responsibilities under the current fund-based model, and they do not even need to build a recycling system to complete the collection and recycling of discarded products after consumption (Hou et al. 2020; Zhao and Bai, 2021). As a result, producers are more inclined to pay only the funds needed to fulfill their economic responsibilities, rather than the high cost of self-built recycling.
The formal processing industry is growing rapidly with fund subsidy and policy support. The standardized processing capacity of WEEE in China has reached more than 170 million units since 2018 (CHEARI, 2019). However, owing to insufficient incentives for producers to build recycling systems independently based on the EPR fund system, the lack of infrastructure for formal recycling has become a major challenge for EPR implementation in many developing countries such as China (Gui, 2020). In addition, because the annual generation of WEEE exceeds the sales of new EEE, the amount of fund collection is far from meeting the expenditure required for the dismantling subsidy, resulting in delayed disbursement of the processing fund (Gu et al. 2017; Liu, et al. 2021c; Zhang et al. 2020). As a result, formal recycling loses its competitive advantage related to price and convenience in the competition with informal recycling for WEEE procurement. The rate of ecological recycling in the formal system under EPR is less than 40%, and the actual processing amount was only about 84 million units in 2022 (CHEARI, 2023). In the implementation and adjustment of China’s fund-based EPR system, problems such as the difficulty of formal collection, inadequate fund management, and incomplete extension of responsibilities have gradually been exposed (Fu et al. 2020; Zeng et al. 2017).
Therefore, the government realizes the necessity of the producer’s physical responsibility, which is essential to alleviate the pressure of a processing fund that is unable to make ends meet and thus promote the sustainable development of WEEE recycling. In 2021, the National Development and Reform Commission (NDRC) and three other departments jointly issued the Notice on Encouraging Home Appliance Producers to Carry Out Actions of Recycling Target Responsibility System (NDRC Industry [2021] No. 1102, hereafter). The TRS aims to encourage producers to collect and recycle WEEE through self-built or co-built recycling systems to achieve recycling targets, thereby improving the collection capacity and recycling efficiency of formal recycling. The difference between the TRS and the TMS lies in whether the recycling target is mandatory. The Chinese government encourages producers to participate voluntarily in the TRS action and set recycling targets by themselves, whereas the South Korean government makes it compulsory for producers to achieve recycling targets, as a typical country implementing TMS (Park et al. 2019).
The TRS is a supplement and improvement to the current fund policy, but there is a lack of clear incentive mechanisms for producers to fulfill their physical responsibilities at the present exploratory stage. Only six producers responded positively to participate in 2022, with annual recycling targets set far off their sales volume (CHEARI, 2023). The effectiveness of the TRS does not meet expectations, so there is an urgent need for supporting incentives to promote its efficient implementation. Meanwhile, the mechanism and model of jointly building and sharing a WEEE recycling system have not been identified clearly in theoretical research and practical exploration (Gui, 2020; Tian et al. 2019).
Research gap
In recent years, the sharing economy has prevailed in many industries owing to its green environmental protection, sustainability, and economic efficiency (Dabbous and Tarhini, 2021; Geissinger et al. 2020). Shared logistics is a typical application of the sharing economy. It optimizes the allocation of logistics resources by sharing many of them, including logistics facilities, equipment, information and technology, and labor resources, which makes it a new logistics model that reduces costs and improves efficiency (Matusiewicz and Ksiazkiewicz, 2023). Shared logistics has become a reliable choice for WEEE reverse logistics to enhance collection capacity and optimize resource allocation. However, the theoretical research on reverse logistics sharing lags behind practical development. Relatively little research addresses the application of shared logistics to solving the problems of WEEE reverse logistics; instead, studies focus on soft resources sharing, such as knowledge sharing (Borner and Hegger, 2018), information sharing (Gu et al. 2019), and technology sharing (Ikhlayel, 2018) between different stakeholders. The following gaps and shortcomings remain in the previous research. In terms of the form of resource sharing, the synergistic mechanism whereby producers, as responsible agents, share reverse logistics resources with other recycling participants needs further improvement. In addition, the issues of responsibility sharing (Jacobs and Subramanian, 2012; Wang et al. 2015) and cost sharing (Gui et al. 2016; Gui, 2020; Xiong et al. 2021) constrain cooperative recycling and resource sharing among different parties, and there is still insufficient theoretical research on solutions to such problems. To make up for the above deficiencies in research, we constructed a shared recycling model guided by the theory of the sharing economy and explore the operation mechanism of shared recycling under the market mechanism.
The successful operation of the sharing economy depends on multiple factors, including the inherent operation mechanism and regulatory system. The key issue we address in this study is the promotion of producers and recyclers to jointly increase their recycling efforts and enhance the benefits of cooperation and sharing from the perspective of market operation and government supervision. On the one hand, information sharing is an effective means for improving the matching efficiency of supply and demand in the sharing economy, yet the problems of information asymmetry and credit regulation arising from it make the trust mechanism among stakeholders a link to the development of the sharing economy (Acerbi et al. 2022; Jager-Roschko and Petersen, 2022; Shang et al. 2016). Jacobs and Subramanian (2012) and Gui et al. (2016) have attempted to coordinate the conflicts of interest and cost sharing in principal–agent relationships through covenants and contracts, but speculative behavior among sharing participants has not yet been resolved in information sharing in reverse logistics (Gu et al. 2019; Wu et al. 2022). We propose a credit mechanism for shared recycling, with a deposit system and a two-way penalty system for breach of trust as the core, to constrain the opportunistic behaviors of participants in shared recycling.
On the other hand, government supervision is an essential institutional supply for promoting shared recycling and realizing the TRS. The research in the field focuses on studying the forms of cooperation and policy mechanisms from the perspective of vertical cooperation between single or multiple entities in the supply chain. For example, based on the implementation of the EPR fund system, some scholars have studied the incentive effects of fund levies, exemptions, and subsidies on producers and recyclers in the fulfillment of their environmental responsibilities (Hou et al. 2020; Zhao and Bai, 2021; Zhou et al. 2017). Others have analyzed the impact mechanisms of different fund or subsidy strategies on the entire supply chain system (Fu et al. 2020; Guo et al. 2018; Liu et al. 2022). Researchers also suggested that the government should appropriately adjust the subsidy strategy (Liu et al. 2016) and gradually reduce the subsidy intensity from high to low at different stages of the development of the WEEE recycling industry (Wang et al. 2020). On this basis, Wang et al. (2022b) and Wang and Huo, (2023) argued that increased subsidies have little incentive utility; instead, the government should adopt severe regulatory penalties.
However, the aforementioned research rarely takes the limited rationality of the responsible subject as the premise to study horizontal cooperation between upstream and downstream parties of the WEEE reverse logistics supply chain, and there is little research on the government’s regulatory policy and incentive mechanism for the TRS. Based on the research on the optimization of the fund policy, we propose a reduction-penalty-subsidy fund policy according to the characteristics and requirements of the recycling TRS to incentivize producers and recyclers to achieve the recycling target through cooperation and sharing in the recycling of WEEE.
The government, producers, and recyclers constitute important stakeholders in the collaborative implementation of shared recycling under the TRS, and the strategic choices of all parties at different evolutionary stages of shared recycling are multiple dynamic complex games. Evolutionary game models can effectively depict the dynamic changes of behavior strategies of multiple bounded rationality agents in long-term repeated games (Liu, et al. 2021b; Taylor and Jonker, 1978), whereas SD has the distinctive advantage of dealing with complex time-varying problems with nonlinear and multiple feedback (Rafew and Rafizul, 2021; Sterman, 2000), which contributes to analyzing the dynamic evolution process of game systems. Therefore, we established a tripartite evolutionary game model to analyze the dynamic characteristics of multi-agent participation in shared recycling decision-making behavior, and we used SD simulation analysis technology to study the dominant factors that affect the shared recycling at different developmental stages.
Model construction
Theoretical model
Based on a series of theoretical foundations of the sharing economy, we developed an innovative WEEE recycling model as shown in Fig. 1. We defined this innovative recycling model as the “1 + N” shared recycling model. Considering the advantages of collective EPR and cooperative recycling, this model attaches importance to the horizontal cooperation and resource optimization among multiple agents.

One enterprise or consortium builds a shared recycling system independently, N participants sharing the use right of logistics resources.
Figure 1 shows that “1” refers to one enterprise or consortium configuring and providing reverse logistics resources independently, including recycling outlets, vehicles, human resources, and information platforms, whereas N represents multiple participants with recycling services and resource needs sharing the use right of logistics resources. The resource provider gains benefits by completing the recycling activities or providing logistics resources for the N sharing participants, whereas the N sharing participants need to pay for recycling services or resources. This shared recycling model achieves efficiency improvement and cost reduction through scale economies in the optimized allocation of reverse logistics resources.
Figure 1 depicts the recycling model of shared recycling, with “ ” indicating its reverse logistics. In shared recycling, the producer develops and shares a reverse logistics system with the responsible agents, including producers, retailers, third-party collectors, and processors. The former has the ability to build a recycling system independently and allocate recycling resources, whereas the latter has real needs for recycling services and logistics resources. The producer builds an information platform to match the supply and demand sides online, optimizes the resource allocation offline, and completes the reverse logistics activities in a centralized and coordinated manner for the sharing participants.
Figure 1 also shows the current fund-based recycling models, with “ ” indicating the reverse logistics of multiple recycling models. In the mainstream model that dismantling processors lead, third-party collectors gather the WEEE, which processors then dismantle and recycle. The manufacturers, such as Haier and Gree, lead the secondary model and collect WEEE through their own recycling systems or sales channels. We establish the shared recycling based on the current model.
Under the current fund-based recycling model, the producer pays the processing fund, and the government subsidizes the dismantling processor for WEEE recycling. According to the requirement of TRS, shared recycling focuses on the performance of the producer’s physical responsibility for recycling. Based on the current fund policy, we propose the strategy of “reduction-penalty” and “subsidy” for producers and recyclers in this model, respectively, to incentivize them to achieve recycling targets and thus better implement the TRS. In Fig. 1, “ ” denotes the fund streams described above, which the government authority regulates and operates.
Evolutionary game model
Model descriptions and assumptions
Based on the theoretical model of shared recycling and the logical relationship among the behaviors of multiple entities in China’s current situation, the government authority, manufacturer, and recycler constitute the main stakeholders in WEEE shared recycling under the TRS. Specifically, the government authority (or the government, hereafter) refers to the relevant departments that regulate shared recycling, including the National Development and Reform Commission, the Ministry of Finance, and the Ministry of Ecology and Environment. We define the manufacturer as the EEE producer that develops a shared recycling system. The recycler includes third-party collectors, dismantling processors, and producers who do not have the ability to build recycling systems on their own. We classify the strategic choices of the tripartite participants in the game model of shared recycling as follows.
The government has two regulatory strategies when making decisions, that is, positive supervision (PS) and negative supervision (NS), and the probabilities of choosing two strategies are x and \(1-x\), \(x\in [0,1]\), respectively. Under the PS strategy, the government encourages responsible agents to implement shared recycling through incentives, subsidies, and punishments, and it supervises the sharing behavior among participants. Thus, PS is conducive to improving ecological benefits and social credibility while incurring government fiscal and regulatory costs. The NS strategy indicates that the government adheres to the current EPR policy and does not take any incentive or regulatory measures for shared recycling given the high cost of environmental governance and fund expenditures.
The manufacturer has two optional strategies for performing its recycling responsibilities, that is, active performance (AP) and passive performance (PP), and the probabilities of the two strategies are y and \(1-y\), \(y\in [0,1]\), respectively. When the manufacturer adopts the AP strategy, it proactively implements the recycling TRS, invests in constructing a sharing network system, and shares recycling services to participants in need. AP can improve the recycling revenues of its own products and obtain excess returns through the scale effect in the implementation of shared recycling. However, the manufacturer must invest substantial funds to allocate logistics resources in the initial stage and bear all the costs of WEEE collection and management in the recycling business. The PP strategy indicates that the manufacturer keeps on performing responsibilities through collaborative recycling or by entrusting third-party recycling rather than actively implementing a recycling TRS, a choice that makes it difficult to achieve the recycling target.
The recycler has two alternative strategies in the game, that is, participation (P) and no participation (NP), and the probabilities of the two strategies are z and \(1-z\), respectively, \(z\in [0,1]\). The P strategy means that the recycler pays to use logistics resources and enjoy shared recycling services, thus effectively saving the costs of recycling system construction and recycling business implementation. When the recycler adopts the NP strategy, it continues to maintain the status of an independent recycler.
The key issues we address in this study are what measures the government should take to incentivize producers to implement shared recycling and collaborative participation of recyclers and how to develop a sharing mechanism to coordinate the interests between producers and recyclers under market mechanisms. Based on the theoretical model and problem descriptions, we make the following assumptions.
Hypothesis 1: Bounded rationality. The government, manufacturer, and recycler have bounded rationality. All of them make strategic choices independently, then adjust and optimize strategies to maximize their respective profits during the evolutionary game.
Hypothesis 2: The reduction-penalty-subsidy policy. According to NDRC Industry [2021] No. 1102, the manufacturer implementing the TRS sets their annual target recycling volumes as τ0. On this basis, we assume that τ1 and τ2 are the manufacturer’s annual recycling volumes when they adopt PP and AP strategies, respectively, where \({\tau }_{2} > {\tau }_{0} > {\tau }_{1}\). Drawing inspiration from Zhao and Bai (2021) and Hou et al. (2020) research on incentive strategies for manufacturers to fulfill recycling responsibilities based on current fund policies, we propose that the government incentivizes manufacturers to perform responsibilities through a “reduction-penalty” fund policy under PS. That is, manufacturers that achieve recycling targets will be reduced in funding levies (a fund reduction of e per unit), and penalties will be imposed on the manufacturer that fails to achieve the target (a penalty of k per unit). According to Zhou et al. (2017) and Liu et al. (2016), government subsidies increase the recycling volumes and profits of formal recyclers and also improve their channel competitiveness. Therefore, we propose that the government should incentivize recyclers to participate in sharing through a subsidy under PS. Recycling volumes increase from σ1 to σ2 after the recyclers participate in sharing, and the government subsidizes s per unit for the increasing volumes. In this case, the number of recyclers participating in sharing will increase from η1 to η2.
Hypothesis 3: Government’s income and costs. Considering that when the industry conducts ecological recycling of WEEE, the government’s environmental and social benefits will be improved (Li et al. 2022; Wang et al. 2020). We therefore assume that the government’s environmental benefits are Rg and \({R}_{g{\prime} }\), respectively, when the manufacturer builds a shared recycling system with and without the participation of recyclers. Moreover, Ug denotes the government’s basic benefit from shared recycling under PS, including credibility, performance evaluation, and economic benefits. Correspondingly, we define the regulatory cost as Cg. In contrast, \({C}_{g{\prime} }\) denotes the environmental remediation cost caused by the failure to implement shared recycling.
Hypothesis 4: Manufacturer’s income and costs. The net income per unit for recycling is um when the manufacturer adopts the PP strategy. Referring to the model of producer responsibility under collective EPR that Gui et al. 2018a designed, when manufacturers build a shared recycling system, they need to invest Cs to configure reverse logistics resources and bear the recycling business cost of cm per unit. Manufacturers’ incomes in shared recycling mainly comprise two parts: (a) revenues from shared business, that is, the logistics resource usage fee and recycling service fee charged to the recycler (rm per unit); and (b) revenues from the recycling and reuse of their own products (rm′ per unit). According to the incentive policy in NDRC Industry [2021] No. 1102, the government’s PS provides certain policy incentives and credit priorities to manufacturers that achieve recycling targets, thus bringing reputational and image benefits of Rm to manufacturers. The manufacturer that adopts the PP strategy will miss out on a series of preferential policies with an opportunity cost of Co. Conversely, the government’s NS leads to indirect losses to the manufacturer (denoted by lm′) when they adopt the AP strategy; such indirect losses include discouraged motivation and insufficient promotion for achievements.
Hypothesis 5: Recycler’s income and costs. In this study we assume that the recycler hands over all the WEEE they collect to formal processors for ecological disposal, and their recycling income of rt per unit remains unchanged whether they participate in sharing or not. The recyclers’ costs of independent recycling and participation in sharing are represented as ct and rm per unit, respectively. Recyclers’ participation in sharing saves them the cost of building and managing a recycling network system (denoted by \(\varDelta {C}_{t}\)) and boosts their reputational and image benefits of Rt. Even though information sharing may result in potential loss of interest (denoted by Cp), the recycler must bear the opportunity cost of Co′ when other peers participate in sharing while the recycler adopts the NP strategy. Based on the incentive policy of Hypothesis 2 and the analysis of government subsidy strategies under channel competition in Liu et al. (2022) research, we assume that the government will subsidize the recycler for channel construction if manufacturers adopt the PP strategy. The recycler will then invest in expanding the recycling network with government support to increase their recycling volume (denoted by σ3 (σ3 > σ2).
Hypothesis 6: The opportunistic cost of sharing. Opportunistic behavior in the sharing economy will inevitably occur in shared recycling, and speculation among manufacturers and recyclers impedes the development of shared recycling. Recycling information is an important strategic resource; the manufacturer leading the sharing may gain benefits of im from free-riding behavior by using the information resources the recycler provides with a probability of μm. In this case, the government will punish the manufacturer with a fine of f and compel it to pay liquidated damages (denoted by pm) to recyclers. Similarly, the recycler may take speculative measures such as providing false information or fraudulently obtaining subsidies (Fu et al. 2020). The probability of recyclers’ speculative behavior and the benefits obtained from it are denoted by μt and it, respectively. To restrain speculative behavior, we propose that recyclers should pay a deposit of b to the manufacturer once they participate in sharing and compensate the manufacturer with liquidated damages of pt in case of default. Table 1 shows the summary of the parameters and descriptions.
Payoffs matrix
Based on the above assumptions and model descriptions, Tables 2 and 3 show the payoff matrices of the three stakeholders in the shared recycling model under the TRS.
Model solution and analysis
Strategic stability of the three stakeholders
According to Tables 2 and 3, we calculate the expected revenue, the average expected revenue, and the replicator dynamic equation of each stakeholder, and we further analyze the evolutionary stability in turn.
Let \({U}_{g1}\) and \({U}_{g2}\) represent the expected revenues of government for adopting the PS and NS strategies, respectively, with \({\overline{U}}_{g}\) denoting the average revenue:
Replicator dynamics equations are used to study the strategy adopted by the majortiy of the population at a specific time. Based on Eqs. (1) and (2), we can calculate the replicator dynamic equation of the government choosing the PS strategy as Eq. (4):
According to Eq. (4), we then conduct an evolutionary stability strategy (ESS) analysis on the government.
-
(1)
When \(y=\hat{y}\), we get \(F(x)\equiv 0\), which indicates that it is a stable strategy and will not change over time no matter what strategy the government chooses, as shown in Fig. 2a.
Fig. 2: The evolutionary phase diagram of the government’s strategic choices. 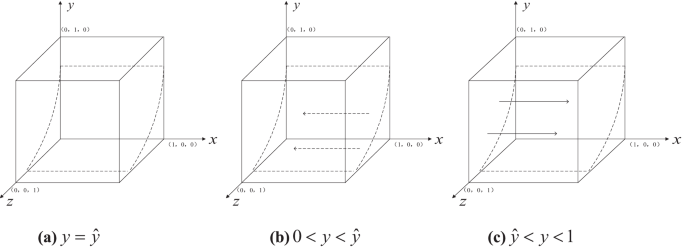
There are three situations in the game strategy adopted by the government: a illustrates that it is a stable strategy and will not change over time no matter what strategy the government chooses; b indicates that the government adopts the NS strategy as the only ESS; c the government chooses the PS strategy as the only ESS.
-
(2)
When \(y\,\ne\, \hat{y}\), let \(F(x)=0\), and there are two possible stable points, that is, \({x}_{1}^{\ast }=0\) and \({x}_{2}^{\ast }=1\). Taking the first derivative of \(F(x)\), we obtain the following:

-
(a)
If \(0 \,<\, y \,<\, \hat{y}\), we get \(F^{\prime} ({x}_{1}^{\ast }) \,<\, 0\) and \(F^{\prime} ({x}_{2}^{\ast }) \,>\, 0\). Thus, \({x}_{1}^{\ast }=0\) is the stable point, that is, the government adopts the NS strategy as the only ESS, as shown in Fig. 2b.
-
(b)
If \(\hat{y} \,<\, y \,<\, 1\), we get \(F^{\prime} ({x}_{1}^{\ast }) \,>\, 0\) and \(F^{\prime} ({x}_{2}^{\ast }) \,<\, 0\). Therefore, \({x}_{2}^{\ast }=1\) is the stable point, that is, the government chooses the PS strategy as the only ESS, as shown in Fig. 2c.
Similarly, let \({U}_{m1}\) and \({U}_{m2}\) represent the manufacturer’s expected revenues for adopting the AC and NC strategies, respectively, with \({\overline{U}}_{m}\) denoting the average revenue:
Based on Eqs. (6) and (7), we can calculate the replicator dynamic equation of the manufacturer choosing the AC strategy as Eq. (9):
According to Eq. (9), we next conduct an ESS analysis on the manufacturer.
-
(1)
When \(z=\hat{z}\), we obtain \(F(y)\equiv 0\), which indicates that it is a stable strategy and will not change over time no matter what strategy the manufacturer chooses, as shown in Fig. 3a.
Fig. 3: The evolutionary phase diagram of the manufacturer’s strategic choices. 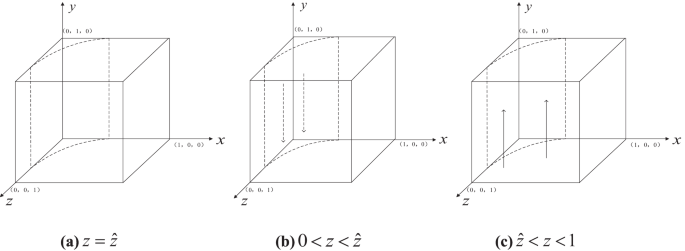
There are three situations in the game strategy adopted by the manufacturer: a illustrates that it is a stable strategy and will not change over time no matter what strategy the manufacturer chooses; b indicates that the manufacturer adopts the PP strategy as the only ESS; c depicts that the manufacturer chooses the AP strategy as the only ESS.
-
(2)
When \(z\,\ne\, \hat{z}\), let \(F(y)=0\), and there are two possible stable points, that is, \({y}_{1}^{\ast }=0\) and \({y}_{2}^{\ast }=1\). Taking the first derivative of \(F(y)\), we obtain the following:

-
(a)
If \(0 \,<\, z \,<\, \hat{z}\), we get \(F^{\prime} ({y}_{1}^{\ast }) \,<\, 0\) and \(F^{\prime} ({y}_{2}^{\ast }) \,>\, 0\). At this moment, \({y}_{1}^{\ast }=0\) is the stable point, that is, the manufacturer adopts the PP strategy as the only ESS, as shown in Fig. 3b.
-
(b)
If \(\hat{z} \,<\, z \,<\, 1\), we get \(F^{\prime} ({y}_{1}^{\ast }) \,>\, 0\) and \(F^{\prime} ({y}_{2}^{\ast }) \,<\, 0\). In this case, \({y}_{2}^{\ast }=1\) is the stable point, that is, the manufacturer chooses the AP strategy as the only ESS, as shown in Fig. 3c.
Similarly, let \({U}_{r1}\) and \({U}_{r2}\) represent the expected revenues of the recycler for adopting the P and NP strategies, respectively, with \({\overline{U}}_{r}\) denoting the average revenue:
Based on Eqs. (11) and (12), we can calculate the replicator dynamic equation of the recycler choosing the P strategy as Eq. (14):
According to Eq. (14), we next analyze the strategic stability of the recycler.
\({\rm{Let}}\,\hat{x}=\frac{\begin{array}{c}[\Delta {C}_{t}-({\sigma }_{3}-{\sigma }_{1})({r}_{t}-{c}_{t})]-y\left[{\sigma }_{2}({r}_{t}-{r}_{m})-{\sigma }_{3}({r}_{t}-{c}_{t})\right.\\ \left.+{\mu }_{t}({i}_{t}-{p}_{t})+{\mu }_{m}({p}_{m}-{l}_{t})+2\Delta {C}_{t}+{C}_{o{\prime} }-b-{C}_{p}\right]\end{array}}{ys({\sigma }_{2}-{\sigma }_{3})+[s({\sigma }_{3}-{\sigma }_{1})+{R}_{t}]}\),
-
(1)
When \(x=\hat{x}\), we obtain \(F(z)\equiv 0\), which indicates that it is a stable strategy and will not change over time no matter what strategy the recycler chooses, as shown in Fig. 4a.
Fig. 4: The evolutionary phase diagram of the recycler’s strategic choices. 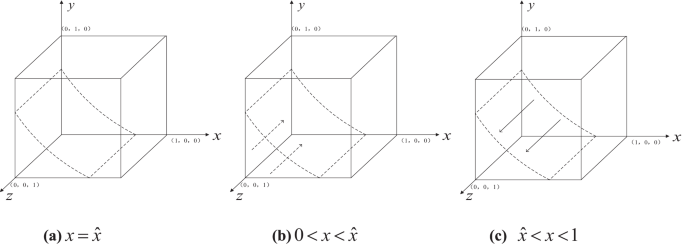
There are three situations in the game strategy adopted by the recycler: a illustrates that it is a stable strategy and will not change over time no matter what strategy the recycler chooses; b indicates that the recycler adopts the NP strategy as the only ESS; c depicts that the recycler chooses the P strategy as the only ESS.
-
(2)
When \(x\,\ne\, \hat{x}\), let F(z) = 0, and there are two possible stable points, that is, \({z}_{1}^{\ast }=0\) and \({z}_{2}^{\ast }=1\). Taking the first derivative of \(F(z)\), we obtain the following:

-
(a)
If \(0 \,<\, x \,<\, \hat{x}\), we obtain \(F^{\prime} ({z}_{1}^{\ast }) \,<\, 0\) and \(F^{\prime} ({z}_{2}^{\ast }) \,>\, 0\). At this moment, \({z}_{1}^{\ast }=0\) is the stable point, that is, the recycler adopts the NP strategy as the only ESS, as shown in Fig. 4b.
-
(b)
If \(\hat{x} \,<\, x \,<\, 1\), we obtain \(F^{\prime} ({z}_{1}^{\ast }) \,>\, 0\) and \(F^{\prime} ({z}_{2}^{\ast }) \,<\, 0\). In this case, \({z}_{2}^{\ast }=1\) is the stable point, that is, the recycler chooses the P strategy as the only ESS, as shown in Fig. 4c.
Stability analysis of tripartite evolutionary system
In this section, we find the ESS of the tripartite evolutionary game of shared recycling among equilibrium points.
Combining Eqs. (4), (9), and (14), we can obtain the three-dimensional dynamic system of the evolutionary game model as Eq. (16):
According to Lyapunov’s (1992) stability theory, we can obtain the ESS from the local stability of the Jacobian matrix of the replicator dynamics system. Thus, we obtain the Jacobian matrix of the game system based on Eq. (16), which we can express as J.
where
According to Ritzberger and Weibull (1995), the ESS is a pure strategy when the information asymmetry condition of an asymmetric game is established. Friedman (1998) demonstrated that an ESS only exists in pure strategies. Therefore, we only need to discuss the stability of the eight pure strategy local equilibrium points that satisfy \(F(x)=0\), \(F(y)=0\), and \(F(z)=0\) in Eq. (18), which are \({E}_{1}(0,0,0)\), \({E}_{2}(0,0,1)\), \({E}_{3}(0,1,0)\), \({E}_{4}(0,1,1)\), \({E}_{5}(1,0,0)\), \({E}_{6}(1,0,1)\), \({E}_{7}(1,1,0)\), and \({E}_{8}(1,1,1)\).
Following Lyapunov’s (1992) stability theory, if and only if all the eigenvalues of the Jacobian matrix are negative (have negative real parts), the corresponding equilibrium point is asymptotically stable. Thus, we bring the eight equilibrium points (pure strategy solutions) into the Jacobian matrix J to calculate the eigenvalues of each equilibrium point sequentially, and we judge their plus or minus characteristics. We can then judge whether the equilibrium point is the ESS of the game system. Table 4 identifies the conditions of ESSs.
The stabilities and corresponding conditions of the above eight equilibrium points indicate that the tripartite stakeholders’ decisions change with the difference between their benefits and costs. Considering the important role of government regulations and credit mechanisms in the development of the sharing economy, the government’s payoff will affect its regulatory strategies and role changes at different stages. According to the sharing economy’s business model and the theory of the industry life cycle (Lumpkin and Dess, 2001; Zhu and Liu, 2021), we divide the evolution process of shared recycling into two stages: the developing stage and the mature stage.
(1) Developing Stage
Proposition 1: If \({U}_{g}+{\eta }_{2}{\mu }_{m}f\, > \,{C}_{g}+s({\sigma }_{2}-{\sigma }_{1})+e({\tau }_{2}-{\tau }_{0})\) is satisfied, the tripartite game system evolves into the equilibrium point \({E}_{8}(1,1,1)\). We can infer the strategic choices of the game parties from Table 4 when \({E}_{8}(1,1,1)\) is the ESS.
As we can see from the inequality \({U}_{g}+{\eta }_{2}{\mu }_{m}f\, > \,{C}_{g}+s({\sigma }_{2}-{\sigma }_{1})+e({\tau }_{2}-{\tau }_{0})\), the benefits of the government are greater than the sum of its regulatory costs and fiscal expenditure under PS, in which case the government prefers the PS strategy.
As we can see from the inequality \({\eta }_{2}{\sigma }_{2}({r}_{m}-{c}_{m})+e({\tau }_{2}-{\tau }_{0})+k({\tau }_{0}-{\tau }_{1})+{R}_{m}+{C}_{o}\, > \,{C}_{s}\), the sum of financial incentives for manufacturers to build a shared recycling system is greater than the cost of recycling system construction when the government adopts the PS strategy, which includes fund and fine reductions from the “reduction-penalty” fund policy, reputational benefits, development opportunities, and the business benefits of shared recycling. In addition, the inequality \({\tau }_{2}({r}_{m^{\prime} }-{c}_{m})\, > \,{u}_{m}{\tau }_{1}\) shows that revenue from the recycling business when the manufacturer constructs a recycling system with an increase in the amount of recycling for their own products is greater than the revenue when they choose the PP strategy. The manufacturer therefore adopts the AP strategy.
As the inequality \(s({\sigma }_{2}-{\sigma }_{1})+{R}_{t}+\Delta {C}_{t}+{C}_{o^{\prime} }\, > \,{C}_{p}\) expresses, when the recycler participates in sharing, the sum of the financial subsidies, reputational benefits, the recycling system’s savings in construction and management costs, and the opportunity costs are greater than the potential losses that information sharing causes. In addition, the inequality \({\sigma }_{2}({r}_{t}-{r}_{m})\, > \,{\sigma }_{1}({r}_{t}-{c}_{t})\) indicates that revenue from the recycling business when the recycler chooses the P strategy with an increase in recycling volume is greater than the revenue when they do not participate in sharing. The recycler therefore adopts the P strategy.
Conclusion 1: At the developing stage, the government chooses the PS strategy. The revenues of manufacturers building a sharing system and the recycler participating in sharing are greater than the costs of making corresponding choices under the incentive policy of reduction-penalty-subsidy, so they choose the AP and P strategies, respectively.
Proposition 2: Given condition ②, the opportunity costs of shared recycling satisfy the inequality \({\mu }_{t}({i}_{t}-{p}_{t})+{\mu }_{m}({p}_{m}-{l}_{t})\, > \,b\) and \({\mu }_{t}({p}_{t}-{l}_{m})+{\mu }_{m}({i}_{m}-f-{p}_{m})+b\, > \,0\).
In the developing stage, the restraint mechanisms and regulatory policies are not yet mature. As a result, both the manufacturer and the recycler have the potential to speculate for additional profits. Based on the above background, let \({\mu }_{m}\cong 1\) and \({\mu }_{t}\cong 1\), then we can obtain \({i}_{t}+{p}_{m}\, > \,b+{p}_{t}+{l}_{t}\) and\({i}_{m}+b+{p}_{t} \,> \,f+{p}_{m}+{l}_{m}\). The two inequalities above indicate that when both manufactures and recyclers engage in speculative behavior while sharing, the benefits both parties obtain are higher than the corresponding opportunistic costs. Therefore, we argue that the profits generated by speculation drive producers and recyclers to participate in shared recycling if the speculative behavior of the participating parties is inevitable, which creates an endogenous force to maintain the operation of shared recycling.
Conclusion 2: In the developing stage of shared recycling, the speculative intentions of manufacturers and recyclers objectively exist. In this situation, the deposit system and the two-way penalty system for dishonesty are effective institutional provisions for promoting the smooth operation of shared recycling. Based on government regulatory penalties for breach of contract, both systems have a certain restraining effect on the participants’ speculative behavior.
(2) Mature Stage
Proposition 3: If \({U}_{g}+{\eta }_{2}{\mu }_{m}f\, < \,{C}_{g}+s({\sigma }_{2}-{\sigma }_{1})+e({\tau }_{2}-{\tau }_{0})\) is satisfied, the tripartite game system evolves into equilibrium point \({E}_{4}(0,1,1)\).
We can infer the strategic choices of the game parties from Table 4 when \({E}_{4}(0,1,1)\) is the ESS. The inequality \({\eta }_{1}{\sigma }_{2}({r}_{m}-{c}_{m})+{\tau }_{2}({r}_{m^{\prime} }-{c}_{m})-{C}_{s}-{l}_{m^{\prime} }\, > \,{u}_{m}{\tau }_{1}\) indicates that the manufacturer adopts the AP strategy when the revenue from choosing this strategy is more than the PP strategy. As we can see from the inequality \({\sigma }_{2}({r}_{t}-{r}_{m}) \,>\, {\sigma }_{1}({r}_{t}-{c}_{t})\), the revenue from the recycling business when the recycler participates in sharing is greater than when not participating. In addition, the inequality \(\Delta {C}_{t}+{C}_{o^{\prime} } \,> \,{C}_{p}\) shows that the cost of recycling system construction and the opportunity cost saved by recyclers participating in sharing are higher than the potential loss of benefits that information sharing causes. The recycler therefore adopts the P strategy.
As the inequality \({U}_{g}+{\eta }_{2}{\mu }_{m}f < {C}_{g}+s({\sigma }_{2}-{\sigma }_{1})+e({\tau }_{2}-{\tau }_{0})\) indicates, the government’s basic benefits are less than the sum of regulatory costs and fiscal expenditure under PS, so the government voluntarily withdraws from the market and adopts the NS strategy.
Conclusion 3: In the mature stage, the sharing economy’s inherent operating mechanism enables the realization of shared recycling’s scale and scope effects. Thus, the manufacturer and recycler can achieve a win-win situation of sharing recycling benefits in the market mechanism without financial subsidies and policy support from government. They therefore choose the AP and P strategies, respectively.
Proposition 4: Given condition ①, the opportunity costs of shared recycling satisfy the inequality \({\mu }_{m}({i}_{m}-{p}_{m})+{\mu }_{t}({p}_{t}-{l}_{m})+b\, > \,0\) and \({\mu }_{t}({i}_{t}-{p}_{t})+{\mu }_{m}({p}_{m}-{l}_{t})-b\, > \,0\).
In the mature stage, owing to the increasing cost of opportunism because of speculative behavior including reputational damage and economic losses, manufacturers lose their motivation for speculation. Conversely, with the continuous improvement of channel competitiveness, recyclers are highly likely to seek more benefits for recycling businesses they operate themselves through speculative behavior. Thus, if \({\mu }_{m}\cong 0\) and \({\mu }_{t}\cong 1\), we can obtain \({l}_{m}\, < \,b\, < \,{i}_{t}\). The inequality indicates that the margin the recycler pays to the manufacturer should be greater than the profit loss the recycler’s speculative behavior caused to the manufacturer but less than the profit the speculation brought to itself. This indicates that the margin can only play its role when it is at a certain threshold, restricting the withdrawal of recyclers from sharing after speculative behavior occurs.
Conclusion 4. At the mature stage, recycler speculation still exists. In the absence of government regulation, the contract deposit as a credit constraint can effectively ensure the sustainable implementation of shared recycling. Its main function is to constrain recyclers’ speculative behavior without harming manufacturers’ interests.
By comparing the two stages of shared recycling, we find that the mature stage is an ideal scenario for shared recycling because it does not count on the government and creates value spontaneously through market mechanisms. In contrast, it is best to avoid the imperfect developing stage because it relies heavily on government intervention and fiscal incentives, which are not conducive to value creation through shared recycling.
Scenario analysis
System dynamics (SD) model
Game analysis shows that WEEE shared recycling involves a dynamic, complex system consisting of many variables that change over time. We can obtain the evolution stability strategies (ESSs) of participants in shared recycling under specific conditions by constructing an evolutionary game model that describes the dynamic logical relationship between the behavioral strategies of different participants and influencing factors. However, it cannot accurately reflect the dynamic impact of various factors on the evolution of behavioral strategies in a multi-agent game. SD is a science that closely combines system science theory with computer simulation to study the feedback structure and behavior of systems (Forrester, 1958; Sterman, 2000). SD can conduct systematic, visual, and convenient simulations of the internal correlations and complex dynamic evolution of evolutionary game models, thereby more intuitively revealing the dynamic evolutionary laws of the decision-making behavior of relevant participants in separate scenarios. The SD model is an enabling method for studying the long-term behavior of complex systems because it allows for experimental analysis of dynamic changes in these models’ behavior over time. Therefore, this method is suitable for in-depth exploration of the mechanisms of participants’ strategic choices and the effects of different influencing factors on the evolutionary state of shared recycling.
Numerous researchers have applied the SD model to the study of WEEE recycling problems, providing many effective insights for the standardized management of WEEE (Besiou et al. 2012; Chu et al. 2023; Guo et al. 2018). Based on the model solving and analyzing results of the evolutionary game, Wang and Huo, (2023) and Gao and Chen (2024) used system dynamics to establish a simulation model to study the multi-agent decision-making process in e-waste recycling management. We constructed an SD model drawing on the modeling approach of the above research in this subsection, then conducted numerical simulations in the next subsection using Vensim DSS software. According to the mathematical relationships between the variables that the three-dimensional dynamic system describes [Eq. (16)], we constructed an SD stock and flow diagram model of the evolutionary game system as shown in Fig. 5.

A system dynamics simulation model for the game system to depict the evolutionary behavior of the tripartite game in different scenarios.
In SD methodology, the stocks represent state variables that have accumulation effects represented by rectangles, and the flows are rate variables that alter the stocks represented by valves (Besiou et al. 2012; Poles, 2013). The clouds represent sources and leaks of flows, which lie outside the model boundary, so we do not consider them. As illustrated in Fig. 5, the model involves three state variables, three rate variables, nine auxiliary variables, and 40 constants. In this model, the probability that the government, manufacturer, and recycler choose strategies \(\{PS,AP,P\}\) are state variables denoted by \(x,y,z\), respectively; and the rate of change of the above proportions are the rate variables denoted by \(dx/dt,dy/dt,dz/dt\). The auxiliary variables indicate the expected revenues to game parties under different strategies, which the constants influence according to the game model. The lines with arrows indicate the interrelationships between the variables, which connect to form the model’s mathematical expression.
Numerical simulation analysis
In 2022, six manufacturers participated in the first batch of the Recycling Target Responsibility Action that the National Development and Reform Commission announced. We analyzed the recycling targets and implementation status of these enterprises, conducted research, and collected data from some manufacturers and recyclers, including Haier, GEM, and BOOLV. In addition, we comprehensively analyzed the relevant data from the white paper on the WEEE recycling industry in China over the past 3 years. On this basis, we referred to Tu et al. (2020) and He and Sun (2022) model parameter settings and assignment methods to assign the parameters. Then, we invited experts from research institutes and industry associations, such as the System Dynamics China Chapter Professional Committee and CHEARI, to evaluate the results, and we made revisions based on their suggestions. Finally, we set the initial conditions in the system simulation model in Fig. 5 as INITIAL TIME = 0, FINAL TIME = 10, TIME STEP = 0.0625, Units for time: Year. Considering the stable conditions of the equilibrium point \({E}_{8}(1,1,1)\), we set the initial values of the parameters as shown in Table 5.
The impact of initial strategies of the game parties
Let \({x}_{0},{y}_{0},{z}_{0}\) denote the initial strategies of the government, manufacturer, and recycler, respectively. Adjust the values of \({x}_{0},{y}_{0},{z}_{0}\) to explore the impact of the initial behavioral strategies of different stakeholders on the system evolution results. We conducted the numerical simulation of the game system based on Table 5. Figure 6 shows the simulation results.

The evolution of the strategies among the government, manufacturer, and recycler under different initial strategies. a represents the evolution result of the tripartite strategy behavior when all initial values are 0.1; b represents the evolution result of the tripartite strategy behavior when; c represents the evolution result of the tripartite strategy behavior when all initial values are 0.5. Note: The x-axis represents time, while the y-axis depicts the share of the population opting for “PS”, “AP”, and “P” strategies.
According to Fig. 6a, given that other parameters remain unchanged, when all the initial strategy values are 0.1, the game system eventually evolves to the unstable equilibrium point (1,0,1). Specifically, the probability of manufacturers’ active performance rapidly decreases to 0, whereas the probability of recyclers’ participation slowly increases to 1. A reasonable explanation for this situation is that, owing to the low initial intention of the government’s PS and the recyclers’ low participation, manufacturers are unwilling to immediately invest a large amount of cost in building a recycling system in the absence of policy support and market prospects. However, because manufacturers perform responsibilities passively, the government has no choice but to incentivize recyclers to invest in the construction of a recycling system for ecological recycling of WEEE through subsidies. However, relying solely on government financial support will lead to system collapse due to excessive fiscal expenditure pressure, which describes the current situation of funds that cannot make ends meet in reality.
As shown in Fig. 6b, when the initial strategy values are \({x}_{0}=0.5,{y}_{0}=0.5,{z}_{0}=0.1\), respectively, the game system evolves to the equilibrium point (1,1,1), but it is not stable. Specifically, the probability of recyclers’ participation in sharing shows an S-shaped growth trend to 1, whereas the probability of manufacturers’ AP first sharply decreases to 0, then rapidly increases to 1 and fluctuates between 0.75 and 1. A reasonable explanation for this situation is that, owing to the low initial intention of recyclers’ participation, manufacturers are unwilling to build recycling systems and bear huge costs alone. As the government’s promotion efforts gradually raise the recyclers’ intention, the motivation for manufacturers to build a shared recycling system also increases.
As shown in Fig. 6c, when the initial strategy values of all three parties are 0.5, the game system eventually evolves to the stable equilibrium point (1,1,1). Specifically, the intentions of both manufacturers and recyclers show a trend of first decreasing, then rapidly climbing to point 1 and finally stabilizing. However, the fluctuation range of manufacturers is more prominent than that of recyclers. A reasonable explanation for this situation is that the intention of recyclers to participate in sharing will initially show a decreasing trend as a result of the loss of benefits brought on by information sharing, then it will quickly increase with the expansion of government promotion and profits from sharing. Recyclers’ participation has an impact on manufacturers’ intentions to develop a shared recycling system in decision-making, and it exhibits a similar trend of initially declining and then growing as well.
Figure 6 shows that no matter how the initial strategy of manufacturers and recyclers changes, the trend of the government’s PS quickly rises to point 1 and stabilizes. This indicates that the government, as the maker of policies and the governor of pollution, urgently needs to fulfill its environmental responsibilities through effective means. Promoting WEEE shared recycling through environmental regulations and incentive policies is a practical way to govern pollution and develop a circular economy.
Conclusion 5. The government’s PS is a prerequisite and guarantee for implementing shared recycling. Significantly, recyclers’ participation determines manufacturers’ decision-making in building a shared recycling system, which is also the key to the successful implementation of shared recycling.
Developing stage: the impact of external variables (government incentive policies)
(1) Scenario I: The impact of the government “reduction-penalty” policy on manufacturers
Adjust the values of fund reduction as \(e=1,2,3\) to obtain Fig. 7, and adjust the values of penalty fine as \(b=2,3,4\) to obtain Fig. 8.

Evolutionary results of fund reduction policy. a The impact of dynamic reduction e = 2, 3, 4 on the government’s behavioral strategies; b The impact of dynamic reduction e = 2, 3, 4 on the manufacturer’s behavioral strategies; c The impact of dynamic reduction e = 2, 3, 4 on the recycler’s behavioral strategies. Note: The x-axis represents time, while the y-axis depicts the share of the population opting for “PS”, “AP”, and “P” strategies.

a The impact of dynamic penalty k = 1, 3, 5 on the government’s behavioral strategies; b The impact of dynamic penalty k = 1, 3, 5 on the manufacturer’s behavioral strategies; c The impact of dynamic penalty k = 1, 3, 5 on the recycler’s behavioral strategies. Note: The x-axis represents time, while the y-axis depicts the share of the population opting for “PS”, “AP”, and “P” strategies.
As shown in Fig. 7, the incentive effect of the “reduction” strategy on manufacturers is not apparent. Figure 7b shows manufacturers’ willingness to develop a shared recycling system will not obviously fluctuate with the changes in the intensity of fund reduction; correspondingly, the government and recyclers’ willingness show the same trend as well, as shown in Fig. 7a, c, respectively. This indicates that the incentive policy, like fund reduction, fails to have an incentive effect on manufacturers (Wang and Huo, 2023). As shown in Fig. 8, the “penalty” strategy for incomplete recycling targets has a more evident incentive effect than the “reduction” policy. Figure 8b shows that the higher the fine, the more significant the incentive effect. Specifically, when the penalty fine is as high as 5, the manufacturer will strive to develop a recycling system to mitigate the substantial fines. In contrast, when the penalty fine is as low as 1, the penalty fine is within an acceptable range even if the recycling target is not achieved, so manufacturers are unwilling to invest a large amount of cost in building and managing the recycling system. In this situation, the government must supervise WEEE recycling positively by subsidizing recyclers to benefit the environment. However, Fig. 8a illustrates that the government’s supervision efforts fluctuate dramatically in response to financial pressure. As a result, recyclers’ participation shows an S-shaped fluctuation, and they quit participating ultimately because of insufficient channel competitiveness, as shown in Fig. 8c.
Conclusion 6. The government’s “penalty” strategy for failing to achieve the recycling target has a significant incentive effect on manufacturers compared with the fund “reduction” policy for achieving the target.
(2) Scenario II: The impact of the government “subsidy” policy on recyclers
China’s EPR fund subsidy policy currently only targets dismantling enterprises. To explore the incentive effect of a subsidy policy for recyclers based on the recycling TRS, we set the values of subsidy as \(s=1,3,5\) and obtain Fig. 9.

a The impact of dynamic subsidy s = 1, 3, 5 on the government’s behavioral strategies; b The impact of dynamic subsidy s = 1, 3, 5 on the manufacturer’s behavioral strategies; c The impact of dynamic subsidy s = 1, 3, 5 on the recycler’s behavioral strategies. Note: The x-axis represents time, while the y-axis depicts the share of the population opting for “PS”, “AP”, and “P” strategies.
As shown in Fig. 9, the subsidy strategy has a significant incentive effect on recyclers to participate in shared recycling. Figure 9c shows that recyclers’ intention to participate in sharing rises with the increase of subsidies. Specifically, when the recycling subsidy is 1, the recycler will not participate in sharing. However, when the subsidy is more than 2, the recycler chooses to participate. Figure 9b shows that under different levels of the subsidy, the trend of changes in manufacturers’ intentions to actively perform responsibility is consistent with recyclers’ participation in sharing. Figure 9a shows that when the value of the subsidy is between 1 and 5, the government chooses to positively supervise shared recycling constantly. A reasonable explanation for this situation is that because recyclers participate in shared recycling, they not only need to bear the losses that information sharing causes, but they also need to transfer certain benefits in the form of sharing costs. Therefore, when the subsidy is low, recyclers will not participate in shared recycling, but as subsidies gradually increase, the balancing effect of subsidies on participation costs becomes more apparent and leads to a continuous increase in recyclers’ participation. The recyclers’ participation influences manufacturers’ decision-making behavior, so their strategic choice is consistent with that of the recyclers. Within the acceptable range of fiscal expenditure, the government will actively promote the successful implementation of shared recycling through subsidies, thereby improving environmental benefits and gaining credibility.
Conclusion 7. The subsidy strategy for recycling can effectively mobilize recyclers’ enthusiasm to participate in and promote the efficient realization of shared recycling.
(3) Scenario III: The impact of the basic revenue on the government
The government implements the TRS to realize standardized management of WEEE, which is the process of promoting carbon reduction and resource conservation, so the government’s behavioral goals are composed of improving social welfare and increasing government revenue. In different stages of shared recycling, the government weighs public welfare and government revenue differently according to the specific decision-making conditions and constraints. In this study we integrate the sum of social credibility income, political performance assessment, and economic benefits to define the basic revenue of the government’s positive supervision as Ug. To analyze the government’s dynamic decision-making when its revenue changes and to examine its impact on the evolution of the game system, we adjust the value of \({U}_{g}=10,35,50\) separately and obtain Fig. 10.

a The dynamic evolution strategy of the government when Ug = 10, 35, 50; b The dynamic evolution strategy of the manufacturer when Ug = 10, 35, 50; c The dynamic evolution strategy of the recycler when Ug = 10, 35, 50. Note: The x-axis represents time, while the y-axis depicts the share of the population opting for “PS”, “AP”, and “P” strategies.
As shown in Fig. 10a, the higher the basic revenue from PS, the greater the government tends to actively promote shared recycling. When the basic revenue is less than the fiscal expenditure, the driving force for the government’s promotion will weaken, and it will eventually no longer intervene in shared recycling. This result is the same as in the analysis of \({U}_{g}+{\eta }_{2}{\mu }_{m}f\, <\, {C}_{g}+s({\sigma }_{2}-{\sigma }_{1})+e({\tau }_{2}-{\tau }_{0})\) in the Evolutionary Game Model section above. In addition, Fig. 10b, c reflect producers and manufacturers’ dependence on government support and financial subsidies during the developing stage of shared recycling.
Conclusion 8. Policy support and government supervision are essential prerequisites for shared recycling under the TRS, and PS requires a massive amount of labor, material resources, and financial investment. Nevertheless, as the representative of the public interest, the government should make improving the ecological environment and enhancing social welfare its goals rather than considering short-term gains and losses. Thus, actively promoting shared recycling to increase WEEE’s recycling volume and to accelerate the reuse of resources contributes to implementing the TRS, which is an efficient way for the government to fulfill its responsibilities and achieve the goal of carbon neutrality.
Mature stage: endogenous dynamic and symbiotic motivation
After entering the mature stage of shared recycling, the government withdraws from the market, and endogenous growth drives the development of shared recycling. In the mature stage, the number of recyclers participating in sharing increases, manufacturers and recyclers’ recycling volume increases with the enhancement of the overall channel competitiveness, and the scale effect of supply and economies of scope of demand is realized. To study shared recycling’s endogenous dynamics and participants’ motivations in the mature stage, we adjusted the parameter assignments based on Table 5 and conducted a new round of simulation analysis. Considering the stability conditions of the equilibrium point \({E}_{4}(0,1,1)\), we set the parameters as Ug = 10, \({\eta }_{1}=8\), \({\sigma_{2}}=8\), \({\tau_{2}}=12\), \({\mu }_{m}=0\), \({\mu }_{t}=1\), \(b=7\), \({r}_{m}=3\), \({C}_{s}=95\), \(\Delta {C}_{t}=20\), and adjusted other parameter assignments according to the specific situations.
(1) Scenario IV: Motivation of manufacturers to active performance
The TRS’s goal is for manufacturers to fulfill their responsibilities proactively. The key supply for shared recycling is that the manufacturer develops recycling systems and shares recycling resources. To analyze the impact of different factors on manufacturers’ motivation to build a shared recycling system, we adjusted the value of \({\eta }_{1},{r}_{m},{c}_{m}\), respectively, to obtain Fig. 11.

a The dynamic evolution strategy of the manufacturer when η1 = 5, 8, 13; b The dynamic evolution strategy of the manufacturer when rm = 2.5, 3, 3.5; c The dynamic evolution strategy of the manufacturer when cm = 1.7, 2, 2.3. Note: The x-axis represents time, while the y-axis depicts the share of the manufacturer opting for the “AP” strategy.
As shown in Fig. 11, the manufacturers’ intention to develop a shared recycling system increases with the number of recyclers participating in the sharing and the sharing fees charged to recyclers, and it increases with the decrease in unit recycling costs. However, Fig. 11a shows that when the number of recyclers participating in the sharing exceeds the carrying capacity of the recycling system, the system will experience oscillations in the later stage. In this case, manufacturers need to increase investment to improve recycling capacity. Figure 11b indicates that when the participation fee charged to recyclers is too high, in the absence of recycling subsidies, they will withdraw from shared recycling owing to their inability to pay the same charge as in the development stage. Conversely, manufacturers are demotivated to establish the shared recycling system when the fee setting is too low, such that expenses exceed income. Figure 11c illustrates that recycling cost is the main factor restricting manufacturers from building the shared recycling system. When the recycling cost per unit is too high, manufacturers will give up implementing shared recycling.
Based on the above analysis, manufacturers are supposed to optimize resource allocation by developing an information recycling platform to control marginal recycling costs. In addition, they should reduce sharing costs spontaneously to attract more recyclers to participate under the premise of balanced income and expenditure, instead of blindly pursuing the excess profits that shared recycling brings in the short term. By implementing the above measures, manufacturers can achieve the scale effect of shared recycling, thereby reducing the recycling cost of their own products.
Conclusion 9. For manufacturers, sharing the hardware and software resources required for WEEE recycling with recyclers could obtain excess returns. Specifically, pursuing the optimal allocation of resources could contribute to economies of scale and scope. That is the vital driver for manufacturers to build a recycling system and share logistics resources and services.
(2) Scenario V: Motivation of recyclers to participate in shared recycling
Recyclers’ participation plays a decisive role in the successful implementation of shared recycling. To analyze the impact of different factors on recyclers participating in shared recycling, we adjusted the values of \({\sigma }_{2},\Delta {C}_{t},{r}_{m}\), respectively, to obtain Fig. 12.

a The dynamic evolution strategy of the recycler when σ2 = 6, 8, 9; b The dynamic evolution strategy of the recycler when ∆Ct = 18, 20, 22; c The dynamic evolution strategy of the recycler when rm = 2, 3, 3.5. Note: The x-axis represents time, while the y-axis depicts the share of the recycler opting for the “P” strategy.
Figure 12a, b show that recyclers’ participation rises with the increase in recycling volume and recycling costs that participating in shared recycling saves. According to the conclusion of the analysis in the previous subsection, let cm = 1.7, then adjust the value of rm to obtain Fig. 12c, which shows recyclers’ participation continuously increases with the reduction of sharing costs. The reasonable explanation for the above situation is that saving costs and increasing profits is the fundamental motivation for recyclers to participate in sharing. Shared recycling can improve the overall competitiveness of the channel and increase the recycling volume for recyclers. At the same time, recyclers participating in shared recycling only need to pay a lower sharing fee to complete the recycling business, saving the recycling system’s construction cost and the business cost of the recycling.
Based on the above analysis, manufacturers leading the recycling system should strive to develop a complete and efficient recycling system to improve collection capacity and channel competitiveness after entering the mature stage. To mobilize recyclers’ enthusiasm for participation, manufacturers must scientifically formulate a cost-benefit sharing mechanism to transfer a certain amount of excess profit to recyclers. Meanwhile, recyclers should strengthen information and resource sharing and reduce unnecessary costs and expenditures that information asymmetry and speculative behavior cause.
Conclusion 10. For recyclers, compared with the self-operated recycling model of building and managing the recycling system on their own, shared recycling has the advantage of lower costs for WEEE collection and management. We conclude that improving channel competitiveness and increasing recycling efficiency are the primary motivation for recyclers’ participation in shared recycling.
(3) Scenario VI: The impact of opportunistic cost on the system
Opportunism gains through speculation also drive manufacturers and recyclers to implement shared recycling. According to the conclusion of opportunism cost during the mature stage in the Evolutionary Game Model section above, the values of \({\mu }_{t},b,{p}_{t}\), respectively, can be adjusted to obtain Fig. 13 and further analyze their impact on the game system of shared recycling.

a The dynamic evolution strategy of the manufacturer and recycler when μt = 0, 0.5, 1; b The dynamic evolution strategy of the manufacturer and recycler when b = 1, 4, 7; c The dynamic evolution strategy of the manufacturer and recycler when pt = 4, 6, 8. Note: The x-axis represents time, while the y-axis depicts the share of the population opting for “AP” and “P” strategies.
As shown in Fig. 13a, recyclers’ participation increases with their speculation probability, and the evolutionary trend of manufacturers’ intention to build the shared recycling system remains consistent with the recyclers’ participation. This indicates that the speculative behavior of participants in the business model of shared recycling is profitable and inevitable.
Figure 13b shows that when \(b\in [1,4]\), recyclers’ participation increases with the margin, but when \(b\in [4,7]\), their intention to participate shows a downward trend. However, when \(b\in [1,7]\), manufacturers’ intention to build a shared recycling system increases with the margin. This indicates the important role of the contract margin in limiting speculations among recyclers and preventing them from breaking away from sharing after violating regulations. As a credit deposit that recyclers pay to manufacturers in advance, the margin can effectively promote manufacturers to implement shared recycling. However, the margin can only play its role when it is at a certain threshold, which validates the conclusion of \({l}_{m}\, < \,b\, < \,{i}_{t}\) drawn in Proposition 4. Specifically, when it is too large, the recycler will give up sharing owing to the high sharing cost. Conversely, the manufacturer will not implement owing to the lack of protection for their interests.
Figure 13c shows that recyclers’ intention to participate decreases with the increase of liquidated damages paid to manufacturers, and the evolutionary trend of manufacturers’ strategic behavior remains consistent with the recyclers’ intention. This indicates that where the recycler has already paid the deposit, excessive breach of contract compensation will undermine the recycler’s enthusiasm to participate in sharing.
Conclusion 11. Participants’ speculative behavior in shared recycling exists objectively, and it is crucial to adopt effective regulatory and punitive measures to reduce the impact on the system’s development when speculative behavior occurs. The margin system and the penalty system for dishonesty are important institutional provisions for shared recycling. However, they can play an effective role only when the margin and penalty are at a certain threshold.
Conclusions
In this study, we construct an innovative WEEE recycling model based on the theory of the sharing economy, and we propose an incentive mechanism for manufacturers and recyclers to perform their responsibilities according to the TRS. We used evolutionary game theory and the SD approach to study the operating mechanism of the shared recycling model and the effectiveness of the incentive mechanism. We draw the following important conclusions.
First, the development of shared recycling evolves from the developing stage of the system equilibrium stable point \({E}_{8}(1,1,1)\) to the mature stage of equilibrium stable point \({E}_{4}(0,1,1)\). The developing stage relies on government support and subsidies, which is not conducive to realizing value creation for shared recycling; the mature stage promotes the development of shared recycling with the sharing economy’s internal operation mechanism, which is an ideal situation for implementing shared recycling.
Second, the combination strategy of reduction-penalty-subsidy has a significant incentive effect for the multi-agent to implement shared recycling collaboratively under the TRS. We found the penalty for not achieving the recycling target could better incentivize manufacturers to perform responsibilities compared with the fund reduction for achieving the target, whereas the subsidy could effectively increase recyclers’ participation in shared recycling.
Third, the economic benefits that the scale effect generates are the primary motivation for manufacturers to establish a shared recycling system, whereas the motive for recyclers’ participation in sharing is to save costs and improve recycling efficiency.
Fourth, the deposit system and penalty system for dishonesty can constrain stakeholders’ speculative behavior to a certain extent at different stages of shared recycling. Because participants’ opportunistic benefits in shared recycling are higher than costs, opportunistic behavior is objective and unavoidable; in this context, contractual deposits can effectively prevent recyclers from withdrawing from sharing after their speculation.
The above conclusions are good insights for realizing the high-quality development of recycling and reuse of WEEE and other recyclable resources.
First, the government should strengthen recycling target responsibility and innovate incentive mechanisms to promote the marketization of WEEE recycling. The development of WEEE recycling through fund subsidies is not a long-term solution, so it is essential for market mechanisms to play the role of value creation to realize the economy of scale and scope in the industry’s sustainable development. The government should clarify the responsible parties’ recycling goals and toughen the penalties for failure to achieve the goals. At the same time, the government should pay attention to the development of diversified recycling channels by encouraging collectors and processors to increase investment in the construction of recycling systems through subsidies.
Second, infrastructure and institutional safeguards should be improved, and the market environment for cooperation and sharing among stakeholders in the reverse supply chain should be optimized. At present, the main shortcoming that restricts the sustainable development of WEEE recycling in most developing countries, including China, is the lack of reverse logistics infrastructure. Therefore, the government should provide certain financial and policy support to infrastructure construction. The most urgent need is to support enterprises with the capacity to build a recycling network system either on their own or with assistance. In addition, the government should encourage innovative ways of resource sharing and cooperative recycling among recycling entities, and it should promote typical models that can be drawn upon in the industry. Further, the government should enhance the supervision of cooperation and sharing, creating a favorable market environment of healthy competition and win-win cooperation for the industry’s development.
Third, resource allocation should be optimized, and channel competitiveness should be improved. The worldwide lack of channel competitiveness has long been a major challenge for the formal recycling system. Therefore, to improve the channel’s overall recycling capacity, producers leading the recycling system need to integrate and optimize the allocation of all logistics resources within the reverse logistics supply chain and take the initiative to reduce the cost of sharing to mobilize recyclers’ participation. In addition, we recommend combining new recycling models, such as shared recycling, with the “Internet +” platform to improve the integration capacity of standardized recycling enterprises for individual collectors to give full play to the role of social resources in front-end recycling.
The shared recycling model established in this study focuses on addressing the challenges of China’s WEEE recycling practice, which is also of great practical significance for developing countries that aim to enhance recycling capacity. In addition, we have attempted to fill some research gaps and contribute to the theoretical study of WEEE recycling and EPR. We applied the theory of the sharing economy to reverse logistics and constructed a shared recycling model based on its theoretical foundation, enriching the theoretical research of logistics models. Our innovative model provides a theoretical basis for horizontal cooperation and resource sharing among the responsible parties of WEEE recycling. The margin system and dishonesty punishment mechanism proposed in the study provide not only an effective and feasible credit constraint mechanism for the business model of the sharing economy but also a new solution to speculative behavior in principal agencies. In addition, we explore the incentive mechanism of the TRS, and the fund policy of reduction-penalty-subsidy provides a decision-making reference for the implementation of EPR after subsidy reduction in China.
However, there are still some limitations to this research. Limited by the difficulty of modeling and constraints of methodology, we assume that all responsible entities such as producers and dismantling processors with no ability to build recycling systems independently are recyclers with recycling needs, which fails to analyze comprehensively the specific decision-making conditions of different entities. In the development of shared recycling, the above stakeholders may choose to build a recycling network system independently and evolve into a dominator of shared recycling that considers the dynamic changes of their own cost-benefit ratio, thus generating a new game behavior. Future research could establish a four-party evolutionary game model based on comprehensive consideration of the specific decision-making conditions of each stakeholder, and they will conduct deep research into the allocation of benefits and cost sharing among sharing participants.
Data availability
Data sharing is not applicable to this article as no datasets were generated or analyzed during the current study.
References
Acerbi F, Sassanelli C, Taisch M (2022) A conceptual data model promoting data-driven circular manufacturing. Operations Management Research 15(3-4):838–857
Anandh, G., PrasannaVenkatesan, S., Goh, M., Mathiyazhagan, K., 2021. Reuse assessment of WEEE: Systematic review of emerging themes and research directions. Journal of Environmental Management 287
Atasu A, Van Wassenhove LN, Sarvary M (2009) Efficient Take-Back Legislation. Production and Operations Management 18(3):243–258
Baidya R, Debnath B, Ghosh SK, Rhee SW (2020) Supply chain analysis of e-waste processing plants in developing countries. Waste Manag Res 38(2):173–183
Belk R (2014) Sharing Versus Pseudo-Sharing in Web 2.0. Anthropologist 18(1):7–23
Besiou M, Georgiadis P, Van Wassenhove LN (2012) Official recycling and scavengers: Symbiotic or conflicting? European Journal of Operational Research 218(2):563–576
Borner L, Hegger DLT (2018) Toward design principles for sound e-waste governance: A research approach illustrated with the case of the Netherlands. Resources Conservation and Recycling 134:271–281
Botsman R, Rogers R (2010) Beyond Zipcar: Collaborative Consumption Harvard Business Review 88(10):30
Cao J, Lu B, Chen Y, Zhang X, Zhai G, Zhou G, Jiang B, Schnoor JL (2016) Extended producer responsibility system in China improves e-waste recycling: Government policies, enterprise, and public awareness. Renewable & Sustainable Energy Reviews 62:882–894
CHEARI, 2019. White Paper on 2018 WEEE Recycling Industry in China. Beijing
CHEARI, 2023. White Paper on 2022 WEEE Recycling Industry in China. Beijing
Chu T, Zhong Y, Jia W (2023) Incorporating self-employed maintainers into WEEE formal recycling system: A system dynamic approach. Journal of Environmental Management 345:118777
Coase RH (2013) The Problem of Social Cost. Journal of Law & Economics 56(4):837–877
Compagnoni, M., 2022. Is Extended Producer Responsibility living up to expectations? A systematic literature review focusing on electronic waste. Journal of Cleaner Production 367
Dabbous A, Tarhini A (2021) Does sharing economy promote sustainable economic development and energy efficiency? Evidence from OECD countries. Journal of Innovation & Knowledge 6(1):58–68
Favot M, Grassetti L, Massarutto A, Veit R (2022) Regulation and competition in the extended producer responsibility models: Results in the WEEE sector in Europe. Waste Management 145:60–71
Forrester, J.W., 1958. Industrial Dynamics: A Major Breakthrough for Decision Makers. Harvard business review 36(4)
Friedman D (1998) On economic applications of evolutionary game theory. Journal of Evolutionary Economics 8(1):15–43
Fu J, Zhong J, Chen D, Liu Q (2020) Urban environmental governance, government intervention, and optimal strategies: A perspective on electronic waste management in China. Resources, Conservation and Recycling 154:104547
Gao M, Chen Y (2024) Multi-agent collaborative model of e-waste recycling. Journal of Environmental Management 349:119457
Geissinger, A., Laurell, C., Sandstrom, C., 2020. Digital Disruption beyond Uber and Airbnb-Tracking the long tail of the sharing economy. Technological Forecasting and Social Change 155
Gu F, Guo J, Hall P, Gu X (2019) An integrated architecture for implementing extended producer responsibility in the context of Industry 4.0. International Journal of Production Research 57(5):1458–1477
Gu Y, Wu Y, Xu M, Wang H, Zuo T (2017) To realize better extended producer responsibility: Redesign of WEEE fund mode in China. Journal of Cleaner Production 164:347–356
Gui L, Atasu A, Ergun Ö, Toktay LB (2016) Efficient Implementation of Collective Extended Producer Responsibility Legislation. Management Science 62(4):1098–1123
Gui L, Atasu A, Ergun O, Toktay LB (2018a) Design Incentives Under Collective Extended Producer Responsibility: A Network Perspective. Management Science 64(11):5083–5104
Gui LY (2020) Recycling Infrastructure Development under Extended Producer Responsibility in Developing Economies. Production and Operations Management 29(8):1858–1877
Gui LY, Atasu A, Ergun O, Toktay LB (2018b) Design Incentives Under Collective Extended Producer Responsibility: A Network Perspective. Management Science 64(11):5083–5104
Guo QX, Wang EC, Nie YY, Shen JY (2018) Profit or environment? A system dynamic model analysis of waste electrical and electronic equipment management system in China. JOURNAL OF CLEANER PRODUCTION 194:34–42
Habib, H., Wagner, M., Balde, C.P., Martinez, L.H., Huisman, J., Dewulf, J., 2022. What gets measured gets managed - does it? Uncovering the waste electrical and electronic equipment flows in the European Union. Resources Conservation and Recycling 181
He L, Sun B (2022) Exploring the EPR system for power battery recycling from a supply-side perspective: An evolutionary game analysis. Waste Management 140:204–212
Hou J, Zhang Q, Hu S, Chen D (2020) Evaluation of a new extended producer responsibility mode for WEEE based on a supply chain scheme. Sci Total Environ 726:138531
Ikhlayel M (2018) An integrated approach to establish e-waste management systems for developing countries. Journal of Cleaner Production 170:119–130
Jacobs BW, Subramanian R (2012) Sharing Responsibility for Product Recovery Across the Supply Chain. Production and Operations Management 21(1):85–100
Jager-Roschko, M., Petersen, M., 2022. Advancing the circular economy through information sharing: A systematic literature review. Journal of Cleaner Production 369
Jian, H., Xu, M., Zhou, L., 2019. Collaborative collection effort strategies based on the “Internet plus recycling” business model. Journal of Cleaner Production 241
Koshta, N., Patra, S., Singh, S.P., 2022. Sharing economic responsibility: Assessing end user’s willingness to support E-waste reverse logistics for circular economy. Journal of Cleaner Production 332
Li, B., Wang, Q., Chen, B., Sun, T., Wang, Z., Cheng, Y., 2022. Tripartite evolutionary game analysis of governance mechanism in Chinese WEEE recycling industry. Computers & Industrial Engineering 167
Lifset R (1993) Take it back: Extended Producer Responsibility as a form of incentive based environmental policy. Journal of Resource Management & Technology 21(4):163–175
Lindhqvist, T., 2000. Extended Producer Responsibility in Cleaner Production: Policy Principle to Promote Environmental Improvements of Product Systems. Iiiee Dissertations 175
Liu H, Lei M, Deng H, Leong GK, Huang T (2016) A dual channel, quality-based price competition model for the WEEE recycling market with government subsidy. Omega-International Journal of Management Science 59:290–302
Liu, H., Li, T., Leong, G.K., 2022. Choice of competitive strategy of formal and informal sectors in recycling WEEE with fund subsidies: Service or price? Journal of Cleaner Production 372
Liu, T., Cao, J., Wu, Y., Weng, Z., Senthil, R.A., Yu, L., 2021a. Exploring influencing factors of WEEE social recycling behavior: A Chinese perspective. Journal of Cleaner Production 312
Liu, X., Lin, K., Wang, L., 2021b. Stochastic evolutionary game analysis of e-waste recycling in environmental regulation from the perspective of dual governance system. Journal of Cleaner Production 319
Liu, Z., Li, K.W., Tang, J., Gong, B., Huang, J., 2021c. Optimal operations of a closed-loop supply chain under a dual regulation. International Journal of Production Economics 233
Lumpkin GT, Dess GG (2001) Linking two dimensions of entrepreneurial orientation to firm performance: The moderating role of environment and industry life cycle. Journal of Business Venturing 16(5):429–451
Lyapunov A (1992) The general problem of the stability of motion. International Journal of Control 55(3):531–534
Mair J, Reischauer G (2017) Capturing the dynamics of the sharing economy: Institutional research on the plural forms and practices of sharing economy organizations. Technological Forecasting and Social Change 125:11–20
Matusiewicz, M., Ksiazkiewicz, D., 2023. Shared Logistics-Literature Review. Applied Sciences-Basel 13(4)
Park J, Ahn C, Lee K, Choi W, Song HT, Choi SO, Han SW (2019) Analysis on public perception, user-satisfaction, and publicity for WEEE collecting system in South Korea: A case study for Door-to-Door Service. Resources Conservation and Recycling 144:90–99
Poles R (2013) System Dynamics modelling of a production and inventory system for remanufacturing to evaluate system improvement strategies. International Journal of Production Economics 144(1):189–199
Rafew SM, Rafizul IM (2021) Application of system dynamics model for municipal solid waste management in Khulna city of Bangladesh. Waste Management 129:1–19
Ritzberger K, Weibull JW (1995) Evolutionary Selection in Normal-Form Games. Econometrica 63(6):1371–1399
Rochet J-C, Tirole J (2006) Two-sided markets: a progress report. Rand Journal of Economics 37(3):645–667
Shan F, Xiao W, Yang F (2021) Comparison of three E-Waste take-back policies. International Journal of Production Economics 242:108287
Shang W, Ha AY, Tong S (2016) Information Sharing in a Supply Chain with a Common Retailer. Management Science 62(1):245–263
Shittu OS, Williams ID, Shaw PJ (2021a) Global E-waste management: Can WEEE make a difference? A review of e-waste trends, legislation, contemporary issues and future challenges. Waste Management 120:549–563
Shittu, O.S., Williams, I.D., Shaw, P.J., 2021b. The ‘WEEE’ challenge: Is reuse the “new recycling”? Resources Conservation and Recycling 174
Sterman, J.D., 2000. Business dynamics : systems thinking and modeling for a complex world. McGraw-Hill, Inc
Sun B, Schnoor JL, Zeng EY (2022) Decadal Journey of E-Waste Recycling: What Has It Achieved? Environmental Science & Technology 56(18):12785–12792
Taylor PD, Jonker LB (1978) Evolutionary stable strategies and game dynamics. Mathematical Biosciences 40(1):145–156
Tian F, Sosic G, Debo L (2019) Manufacturers’ Competition and Cooperation in Sustainability: Stable Recycling Alliances. Management Science 65(10):4733–4753
Tian F, Sosic G, Debo L (2020) Stable recycling networks under the Extended Producer Responsibility. European Journal of Operational Research 287(3):989–1002
Tu, Y., Peng, B., Wei, G., Wu, W., 2020. EPR system participants’ behavior: Evolutionary game and strategy simulation. Journal of Cleaner Production 271
Wang H, Gu Y, Li L, Liu T, Wu Y, Zuo T (2017) Operating models and development trends in the extended producer responsibility system for waste electrical and electronic equipment. Resources Conservation and Recycling 127:159–167
Wang J, Li W, Mishima N, Adachi T (2022a) Exploring the optimal reverse supply chain for e-waste treatment under Chinese government subsidy. Waste Manag 137:128–138
Wang W, Zhang Y, Zhang K, Bai T, Shang J (2015) Reward-penalty mechanism for closed-loop supply chains under responsibility-sharing and different power structures. International Journal of Production Economics 170:178–190
Wang Z, Huo J (2023) Do government intervention measures promote e-waste recycling in China? J Environ Manage 342:118138
Wang, Z., Duan, Y., Huo, J., 2022b. The impact of government intervention measures on recycling of waste electrical and electronic equipment in China considering consumer decision. Energy Policy 160
Wang, Z., Wang, Q.X., Chen, B.X., Wang, Y., 2020. Evolutionary game analysis on behavioral strategies of multiple stakeholders in E-waste recycling industry. Resources Conservation and Recycling 155
Wu, Z., Yang, K., Xue, H., Zuo, J., Li, S., 2022. Major barriers to information sharing in reverse logistics of construction and demolition waste. Journal of Cleaner Production 350
Xiong J, Wang SM, Ng TS (2021) Robust Bilevel Resource Recovery Planning. Production and Operations Management 30(9):2962–2992
Yu, Z., Khan, S.A.R., Zia-Ul-Haq, H.M., Ma, T., Sajid, M.J., 2022. An evolutionary game analysis on price competition in recycling industry between large and small enterprises of China. Waste Management & Research
Zeng X, Gong R, Chen WQ, Li J (2016) Uncovering the Recycling Potential of “New” WEEE in China. Environ Sci Technol 50(3):1347–1358
Zeng X, Duan H, Wang F, Li J (2017) Examining environmental management of e-waste: China’s experience and lessons. Renewable and Sustainable Energy Reviews 72:1076–1082
Zhang, D.Y., Cao, Y.S., Wang, Y.J., Ding, G.Y., 2020. Operational effectiveness of funding for waste electrical and electronic equipment disposal in China: An analysis based on game theory. Resources Conservation and Recycling 152
Zhang, S., Gu, Y., Tang, A., Li, B., Li, B., Pan, D., Wu, Y., 2021. Forecast of future yield for printed circuit board resin waste generated from major household electrical and electronic equipment in China. Journal of Cleaner Production 283
Zhao X, Bai X (2021) How to motivate the producers’ green innovation in WEEE recycling in China? - An analysis based on evolutionary game theory. Waste Manag 122:26–35
Zhao Y, Wang W, Ni Y (2020) EPR system based on a reward and punishment mechanism: Producer-led product recycling channels. Waste Management 103:198–207
Zhou W, Zheng Y, Huang W (2017) Competitive advantage of qualified WEEE recyclers through EPR legislation. European Journal of Operational Research 257(2):641–655
Zhu, X., Liu, K., 2021. A systematic review and future directions of the sharing economy: business models, operational insights and environment-based utilities. Journal of Cleaner Production 290
Zuo L, Wang C, Sun Q (2020) Sustaining WEEE collection business in China: The case of online to offline (O2O) development strategies. Waste Management 101:222–230
Acknowledgements
This work was supported by the National Natural Science Foundation of China (NSFC) (Grant numbers 71974104) and Shandong Provincial Natural Science Foundation (Grant numbers ZR2019BG009).
Author information
Authors and Affiliations
Contributions
Tao Chu: writing—original draft and writing—reviewing, validation, conceptualization, methodology, software. Jingai Ma: methodology, modeling, validation. Yongguang Zhong: conceptualization, methodology, funding acquisition. Hao Sun: supervision. Weiqiang Jia: methodology, supervision.
Corresponding author
Ethics declarations
Competing interests
The authors declare no competing interests.
Ethics approval
Ethical approval was not required as the study did not involve human participants.
Informed consent
Informed consent was not required as the study did not involve human participants.
Additional information
Publisher’s note Springer Nature remains neutral with regard to jurisdictional claims in published maps and institutional affiliations.
Rights and permissions
Open Access This article is licensed under a Creative Commons Attribution 4.0 International License, which permits use, sharing, adaptation, distribution and reproduction in any medium or format, as long as you give appropriate credit to the original author(s) and the source, provide a link to the Creative Commons licence, and indicate if changes were made. The images or other third party material in this article are included in the article’s Creative Commons licence, unless indicated otherwise in a credit line to the material. If material is not included in the article’s Creative Commons licence and your intended use is not permitted by statutory regulation or exceeds the permitted use, you will need to obtain permission directly from the copyright holder. To view a copy of this licence, visit http://creativecommons.org/licenses/by/4.0/.
About this article

Cite this article
Chu, T., Ma, J., Zhong, Y. et al. Shared recycling model for waste electrical and electronic equipment based on the targeted responsibility system in the context of China. Humanit Soc Sci Commun 11, 442 (2024). https://doi.org/10.1057/s41599-024-02901-0
Received:
Accepted:
Published:
DOI: https://doi.org/10.1057/s41599-024-02901-0
