
Abstract
Corruption and anti-corruption efforts are intertwined with political and economic concerns. From an economic and political perspective, as the government strives to enhance its governance capabilities, it becomes crucial to consider the costs of anti-corruption supervision and the losses incurred from corruption. This evaluation is essential for formulating a scientifically sound anti-corruption strategy that maximizes government benefits. To address this issue, the paper presents a model that incorporates levels of supervision and associated costs. The findings reveal that in the case of homogeneous officials, the optimal level of supervisory input, which maximizes government benefit, is nearly zero when per capita income is low due to budgetary constraints on anti-corruption control. However, as per capita income reaches a certain threshold, the optimal level of supervisory input suddenly rises to its maximum and decreases as per capita income increases. Alternatively, if the government adopts a zero-tolerance approach towards corruption and provides adequate remuneration to its employees, ensuring that all competent authorities can resist corruption, then corruption can be eliminated. Moreover, when officials exhibit heterogeneity in terms of their honesty levels, certain conditions give rise to a middle per capita income range, resulting in an optimal level of supervisory input that leads to a phenomenon known as “partial corruption.” During this phase, the wages paid by the government to its employees promote honesty, preventing them from engaging in corruption. However, they are unable to curb the corrupt activities of more dishonest officials. To some extent, this model also explains the challenges associated with eradicating corruption in several middle-income countries.
Introduction
Corruption accompanies power, as the British politician Lord Acton remarked, “Power tends to corrupt, and absolute power corrupts absolutely.” Corruption, as a misuse of power, is pervasive in all societies and is widely regarded as a major barrier to social and economic development. This is particularly true for developing countries, where the implications of corruption are the most damaging (UN, 2003). Shleifer and Vishny (1993) were among the first academics to define corruption as “the sale of government officials of government property for personal gain.” Similarly, Svensson (2005) defines corruption as “abuse of public office for private gain.” Later, Banerjee et al. (2013) defined corruption as a “violation of rules by officials for personal gain.” This includes not just overt corruption (officials accepting bribes), but also more subtle forms of bureaucratic corruption, such as nepotism. Corruption not only undermines fair competition and public trust, but it can also lead to resources misallocation ultimately reducing overall societal welfare. Consequently, identifying and effectively combating corruption is vital for every country or government.
Economic study on corruption has generally centered on two aspects: its causes and repercussions (Nie, 2014). Existing research on the causes of corruption typically discusses the roles of political systems, economic development levels, openness to foreign investment, legal traditions, education levels, culture, and religion (Acemoglu and Thierry, 2000; James et al., 2005; Šumah Š, 2018). Some studies also look into problems such as professional ethics, traditional customs, and demographics (Dollar et al., 2001; Rivas, 2013; Lee and Guven, 2013). In analyzing the repercussions of corruption, two extreme viewpoints have evolved (Aidt, 2009): those of the ‘sanders’ who believe corruption impedes progress, and those of the ‘greasers’ who believe corruption can (in certain cases) promote development. Given the multiplicity of causes of corruption and the fact that understanding these reasons can improve anti-corruption policy, there is significantly more research studying corruption’s causes than its economic impacts. For many developing countries, analyzing the fundamental mechanisms relating corruption, anti-corruption initiatives, and economic growth could provide insights into situations where high corruption coexists with high growth. A considerable amount of empirical analysis has been conducted on the causes and impacts of corruption (Adit, 2009; Dong and Torgler, 2010; Belgibayeva and Plekhanov, 2019). However, the principal-agent model, viewing corruption as an “agent violating the interests or preferences of the principal to benefit a third party,” provides a novel theoretical perspective that more effectively reveals the behavioral motivations and internal mechanisms underlying corruption.
Building on this foundation, the logical starting point of this study is that officials are motivated to engage in corruption to gain additional personal benefits when they have sufficient discretionary power, when economic rent exceeds salary levels, and when corruption detection and punishment are minimal (Yin and Nie, 2020). The government, on the other hand, has a similar reason to pass anti-corruption legislation. Anti-corruption actions, however, are not free; the government must invest significant human, physical, and financial resources in corruption surveillance and crackdowns. The relationship between such investment and government benefit is complex and varies depending on economic progress and governmental systems. Much of the existing research considers surveillance levels and costs from an exogenous perspective, assuming that they are determined by external variables rather than government decisions. However, in reality, when selecting anti-corruption strategies, governments must frequently evaluate monitoring levels and costs endogenously, incorporating these factors into their decision-making process. As a result, finding the best anti-corruption policy is a complex and critical topic.
Therefore, this study introduces a theoretical model that endogenizes the level of surveillance and costs to better understand how to balance corruption losses and the costs of anti-corruption surveillance investments, resulting in the optimal anti-corruption strategy under varying economic and political conditions. This study offers a fresh perspective on the coexistence of high corruption and high growth in certain developing countries. Furthermore, in many developing countries, such as those in East Asia, top-down supervision and incentives, rather than periodic elections, are the dominant influencers on official behavior. As a result, this research enriches the study of official behavior, which is ideally only influenced by the level of supervision.
The paper is divided into six sections. Following the introduction, the “Literature review” section provides a brief survey of the research on corruption and economic growth. The basic model’s construction is detailed in the “The basic model” section. The “Optimal choice of government supervision investment under homogeneous officials” section presents and discusses the government’s optimal choice. The “Optimum choice of government supervision investment under heterogeneous officials” section extends the problem to include a variety of corrupt officials. Finally, the “Conclusion and discussion” section provides research discussions and conclusions.
Literature review
Corruption and anti-corruption are both political issue and economic issue. The predominant focus of the economics community on the study of corruption is its impact on economic growth. However, consensus on this particular subject has yet to be established, with three prevailing opinions often voiced in the literature.
The first viewpoint is the “Harmful Corruption Hypothesis”. A group of scholars argue that rent-seeking activities not only cause inefficiencies but also lead to enormous unproductive waste (Krueger, 1974; Bhagwati and Srinivasan, 1982). Furthermore, corruption encourages talented individuals to engage in rent-seeking activities, which reduces economic growth (Shleifer and Vishny, 1993; Murphy et al., 1993). Shleifer and Vishny (1994) discovered that when the goals of politicians and enterprises do not align with those of maximization of social welfare, result of bribery mechanism is by no means optimal. Wei (1997, 2000) believes that corruption has a tax effect, which weakens foreign investment willingness. As for empirical research, Mauro (1995) analyzes relationship between corruption and economic growth using data from 58 countries. The result shows that corruption has a significant negative impact on investment and GDP growth. Mo (2001) examines transnational data from 1970 to 1985 and concludes that corruption directly causes a decrease in investment, a decline of human capital, and political instability, and therefore indirectly inhibits economic growth. Pellegrini and Gerlaph (2004) argue that corruption inhibits economic growth by affecting investment and trade policies. Some academics contend that corruption slows economic growth by affecting taxes (Blackburn et al., 2006, Imam and Jacobs, 2014, Ivanyna et al., 2016). After separating the indirect effects of corruption on economic growth, Swaleheen (2011) concludes that corruption has a direct negative impact on economic growth. Kunieda et al. (2014) argued that capital account liberalization would amplify the negative impact of corruption on economic growth. Gründler and Potrafke (2019) revisited the relationship between corruption and economic growth using the inverted Transparency International Perception of Corruption Index (CPI) from 2012 to 2018 across 175 countries/regions. Their study indicates that the impact of corruption on economic growth is most pronounced in autocratic countries and is transmitted to economic growth via a decline in FDI and an increase in inflation.
The second viewpoint is that “corruption leads to efficiencies”. In some countries, there are some ineffective and rigid regulations, and corruption can relieve or even circumvent those regulations that impede economic development, thereby enhancing market efficiency and economic development (Leff, 1964). The “queuing model” proposed by Lui (1985) describes a situation in which officials grant bribery enterprises priority when issuing business licenses, thereby accelerating approval process and improving market efficiency. The “auction model” proposed by Beck and Mayer (1986) is a concretization of the preceding model. They believe that companies that can afford to high bribes are the most likely to be the most productive. Therefore, the “auction” acquisition of operating rights will increase market efficiency. Acemoglu and Verdier (1998\2000) discovers that if anti-corruption is expensive and resource allocation is significantly distorted, then the level of corruption that maximizes output or social welfare might be greater than zero. Dzhumashev (2014) believes that when government size exceeds the optimal value, corruption can increase market efficiency and stimulate economic growth. Egger and Winner (2005) discovered that corruption could stimulate direct foreign investment based on empirical research with data from 73 countries. Through enterprise-level data analysis in China, Wang and You (2012), found that corruption can enhance a firm’s revenues at a micro level. Jiang and Nie (2014) demonstrated empirically that regional corruption in China has a positive impact on the profitability of private enterprises but has no effect on the profitability of state-owned enterprises. Furthermore, natural experiments arising from exogenous changes in trade policies imply that corruption may aid private enterprises in evading government supervision, thus explaining the paradox of China’s high growth and high corruption.
The third viewpoint is that “corruption depends on its environment”. This viewpoint is a synthesis of the first two. It argues that both viewpoints have their reasons and environments for existence. Whether corruption is beneficial or not depends on the environment and system in which it lies. After restricting their sample to highly liberalized countries and controlling for some economic variables, Méndez and Sepúlveda (2006) found that the relationship between corruption and economic growth is not constant. Under the maximization of economic growth, the level of corruption is significantly greater than zero. When the level of corruption is low, it promotes economic growth; when the level of corruption is high, it inhibits economic growth. Aidt et al. (2008) found that corruption hampers economic growth when the government’s management system is relatively perfect, but has no effect when the government’s management system is poor. According to empirical research conducted by Meon and Weill (2010), the impediment of corruption to economic growth diminishes as system deficiencies increase. When system deficiencies are so severe that they result in extreme inefficiency, corruption can actually promote economic growth. Aidt (2009) reached a similar conclusion, namely that corruption only positively affects economic growth when the system is defective. Dong and Torgler (2010) discovered through empirical research on China’s data that corruption can impact economic growth in many ways, both positively and negatively. Its overall effect is the sum of all its individual effects. Zheng (2015) determined, using theoretical models, that under certain conditions, society may benefit from a certain level of corruption and that anti-corruption measures may reduce the efforts of competent officials more than those of lower ability. Alfada (2019) evaluated the threshold value at which corruption inhibits economic growth. And Petersen (2021) employs corruption scandals to explain the inverted-U relationship between democracy and corruption.
Regardless of one’s position on the advantages and disadvantages of corruption, its negative impact on social welfare cannot be denied in certain aspects, as evidenced by the preceding literature review. Extensive studies have been conducted on the consequences of corruption, and some scholars have attempted to investigate the causes and countermeasures of corruption using novel perspectives and methodologies. Due to the secretive nature of corruption, available data are frequently limited, making it difficult to draw conclusions about corruption’s underlying mechanisms. In recent years, some scholars have started employing laboratory experiments to analyze individual corruption behaviors. For instance, Banerjee (2016) employed laboratory corruption games to elucidate bribery behavior and disclose the impactful role of moral cost. This research also highlighted the crucial role of social norms against the backdrop of corrupt behavior. To explain the relationship between corruption and economic development, Yin and Nie (2020) developed a three-tier agent model involving the central government, local government, and enterprises. They proposed that companies’ adoption of non-compliant technology could spur economic growth but also lead to corruption issues. Banerjee et al. (2022), in their public goods laboratory experiment, discovered that the propensity for public officials to embezzle increased the likelihood of tax evasion among citizens, and that tax evasion in turn increased the likelihood of embezzlement. Introducing a policy to detect and penalize public officials for embezzling taxes significantly reduced tax evasion among citizens.
In conclusion, examining corruption from the perspective of anti-corruption measures seems to be a more fruitful research topic. Existing literature typically externalizes the cost of anti-corruption efforts and seeks to explore the specific pathways of corruption via its various direct and indirect impacts. However, among the numerous ways corruption impacts economic development, we cannot overlook the influence of anti-corruption efforts on economic growth. The construction of anti-corruption measures has never ceased despite the escalating phenomenon of corruption over the 30 years since China’s reform and opening up. China’s anti-corruption expenditures have reached an unignorable level, necessitating an evaluation of corruption issues from the perspective of the cost of anti-corruption supervision. In light of this, this paper proposes a supervisory model that internalizes anti-corruption efforts and examines, through comparative static analysis, how the government can choose the optimal supervisory level that maximizes social welfare under various circumstances.
The basic model
The government’s resources are limited during a country’s economic development, so policymakers should make rational and scientific decisions in preventing, regulating, and combating corruption to maximize government benefit. In order to concretize this process, this model takes anti-corruption supervision as a factor of decision-makers’ consideration and endogenously internalizes the probability that officials will be found engaging in corruption.
Consider a static economy made up of citizens, governments, and their employees. All citizens are risk-neutral rational individuals with a total of \(\lambda\), their per capita income is \(y\), and they pay taxes to the government at average tax rate \(t\). The government is policymaker that seeks to maximize benefits. Government benefit is increased by gathering taxes and employing officials to implement infrastructure or public utilities projects. Obviously, the right to implement a project leaves space for official corruption, which can be detrimental to the government’s benefit. Therefore, a group of supervisors is hired to stop or prevent corruption. Thus, government employees are separated into two groups: officials and supervisors. The number of supervisors is \(n\), and the number of officials is \(1 - n\), for a grand total of 1. Per capita wage rate of government employees is \(w\). To ensure that people are willing to become government employees, a minimum wage constraint should be imposed, i.e., the wage of government employees should not be less than per capita income, then \(w\) should be satisfied \(w \ge y\). For the government, it is necessary to find an appropriate proportion of supervisors and a wage \(\left( {n,w} \right)\) for government employees satisfying the above constraints to maximize government benefit. Next, each object’s behavior will be analyzed.
Citizens
Since this model focuses on the level of supervision, the number of citizens defined as \(\lambda \left( {\lambda > 0} \right)\), per capita income \(y\left( {y > 0} \right)\), and average tax rate \(t\left( {t > 0} \right)\) are exogenous variables. The amount of tax paid by all citizens, i.e., government’s fiscal revenue f, is
where \(\gamma = t\lambda\).
Supervisors
The government hires supervisors to supervise the behavior of officials. Define that all supervisors are homogeneous and have two states: normal working state and abnormal working state(laziness). Assuming that the probability \(p\) found by a supervisor that an official is in an abnormal working state is a function of the number \(n_e\) of supervisors in a normal working state, that \(p\) should be an increasing function of \(n_e\), so we may define as
That is to say, \(p\) is exactly the proportion of the number of supervisors in normal work among government employees.
Because of the information asymmetry between the government and supervisors, the government does not know if supervisors are in an abnormal working state. In order to ensure their normal work, the government provides supervisors with an incentive on the basic wage \(w\), that is, the salaries of all officials found to have abnormal working behaviors will be confiscated and distributed equally to all supervisors as an additional incentive. Assuming that the additional benefit of laziness is zero, in addition to the normal wage \(w\), for each supervisor, the probability that an official in an abnormal working state will be found increases when he works normally compared with laziness, and there is a potentially higher possibility \(p\) of obtaining additional benefit, therefore, the benefit of each supervisor’s choice of normal work will not be lower than that of idleness. Thus, under government’s incentive policy, every supervisor will not choose to be lazy, so there are
Then, probability \(p\) that officials in abnormal working state will be found is
Officials
The government employs officials to operate infrastructure and public utility projects. Officials are fully aware of the number \(n\) of inspectors employed by the government, and the probability that officials will be discovered engaging in abnormal work is \(p(n) = n\). Due to officials’ participation in the implementation of specific projects, there is room for corruption. We use the concept of “corruption space” to quantify officials’ rights, which demonstrates that officials can maximize their rent-seeking benefits. Total corruption space for all officials is defined as \(b\), while the average corruption space per official is \(b/\left( {1 - n} \right)\). It shows that a corrupt official will receive additional benefits of \(b/\left( {1 - n} \right)\) without being discovered. At the same time, effort input in infrastructure and public utilities projects will reduce by \(b/\left( {1 - n} \right)\).
There are two states for all officials: the normal working state and the corrupt state. In a normal working state, officials will receive a basic wage \(w\); in a corrupt state, there is \(p(n)\) probability that they will be found corrupt. Once found, all wages and corrupt income will be confiscated, so the expected return of an official in a corrupt position is \(\left[ {1 - p\left( n \right)} \right]\left[ {w + b/\left( {1 - n} \right)} \right]\), and the expected return can be used to represent the officials’ utility,\(U = \max \left\{ {w,\left[ {1 - p\left( n \right)} \right]\left[ {w + b/\left( {1 - n} \right)} \right]} \right\}\). Since \(p(n) = n\), the formula of anticipated income can be converted to \(\left( {1 - n} \right)w + b\).
So, if there is
where the official’s income in the normal working state is not less than the anticipated income in the corrupt working state, the official will choose the normal working state.
Conversely, if
where the official’s income in the normal working state is less than the anticipated income in the corrupt state, then the official will choose to corrupt rather than work.
Government
The government’s objective is to maximize the government’s benefit function by choosing an appropriate proportion of supervisors and wages of government employees \(\left( {n,\,w} \right)\). Define the government benefit function \(G\left( {n,\,w} \right)\) as follows,
where \(B\left( {n,w} \right)\) is the total corruption benefit accrued by all officials without being detected by supervisors, both \(\alpha\) and \(\beta\) are coefficients.
The government benefit function \(G(n,w)\) is as follows: The government’s budget is total income tax \(f\), of which a portion is used to pay government employees’ wages and the rest is for infrastructure and public utilities projects. Since corruption of officials may result in loss of \(B\left( {n,w} \right)\) and proportion \(p(n)\) is recovered by supervisor, part of resources ultimately devoted to infrastructure and public utilities is \(f - w - (1 - p(n))B(n,w)\), which defined \(\alpha (\alpha > 0)\) as government benefit generated by investment of unit infrastructure and public utilities. Consequently, the government benefit from this part is \(\alpha [f - w - (1 - p(n))B(n,w)]\). In addition, the supervisor is only responsible for supervising the official, whereas the official contributes directly to the government benefit of the supervisor. At this level, it is evident that the larger the number of officials, the greater the government’s benefit. Assuming that, regardless of officials’ working status, their contribution to government benefit in the implementation of infrastructure and public utilities projects is \(\beta (\beta > 0)\), the additional government benefit generated by all officials is \(\beta \left( {1 - n} \right)\).
In light of the above model, government’s objective is to:
It shows that the goal of policymakers is to maximize the government benefit function \(G(n,w)\) within certain constraints.
Optimal choice of government supervision investment under homogeneous officials
The above-described basic model has one feature: all officials are homogeneous, and their corruption space is identical and \(b/\left( {1 - n} \right)\). Here, we will explore the optimal choice of government under the basic model of homogeneous officials.
The government makes decisions with the goal of maximizing the government benefit function \(G(n,w)\), which is accomplished by employing a certain number \(n\) of supervisors and setting a base wage \(w\) for each official. Individual officials, on the other hand, decide whether to engage in corruption with the goal of maximizing payoffs based on three factors: the level of wages offered by the government \(w\), the probability \(p(p(n) = n)\) that an official in a non-normal work situation will be detected, and the exogenously given corruption space \(b\). When the payoff \(w\) under normal work is comparable to the anticipated payoff \((1 - n)w + b\) under corrupt work, officials choose to work normally. Because government may lead to different behavior of officials when setting different wage levels, the total corruption benefit \(B\left( {n,w} \right)\) of officials will vary without being detected, thereby affecting the form of government benefit function. Therefore, it is necessary to analyze various situations to determine the optimal choice of government. The analysis is divided into three sections: first, government’s optimal choice when low wage is \(w < b/n\); second, government’s optimal choice when high wage is \(w \ge b/n\); third, government’s optimal choice \(\left( {n^ \ast ,w^ \ast } \right)\) when the first two situations are combined.
Prior to analysis, model parameters need to be constrained. Clearly, if the total corruption space B of all officials is large enough, it signifies an unlimited expansion of power, where no decision can prevent the occurrence of corruption; therefore, the total corruption space B should be controlled to a certain range. In addition, in order to reflect the informational and professional advantages of officials in the implementation of infrastructure or public utilities projects, the influence gap between unit officials and unit resources investment on government benefit should not be too large; otherwise, there would be no reason for the government to employ officials to carry out specific projects, so coefficient \(\beta /\alpha\) should be increased. In light of this, we apply the following assumptions to full text, unless otherwise specified:
Assumption 1. The parameters \(b\), \(\alpha\) and \(\beta\) satisfy the following condition
Optimal choice for low wage (\(w < b/n\))
When the wage \(w < b/n\) is low, rational officials will find that the expected income from corruption \(\left( {1 - n} \right)w + b\) exceeds that \(w\) of normal work. Under such conditions, every official would choose to engage in corrupt practices. Consequently, the subsequent discussion will be solely devoted to analyzing the optimal choices for the government to maximize the government benefit function \(G(n,w)\).
If each official’s corruption behavior will have additional benefits \(b/\left( {1 - n} \right)\) that not discovered by supervisor, then the total corruption benefit \(B\left( {n,w} \right)\) of each official is as follows:
and the government benefit function \(G(n,w)\) is reduced to
Thus, we have the following proposition.
Proposition 1. When wages \(w < b/n\) are lower, the optimal number of supervisors and their salaries are \(\left( {n_1^ \ast ,w_1^ \ast } \right) = \left( {0,y} \right)\), the value of government benefit function is
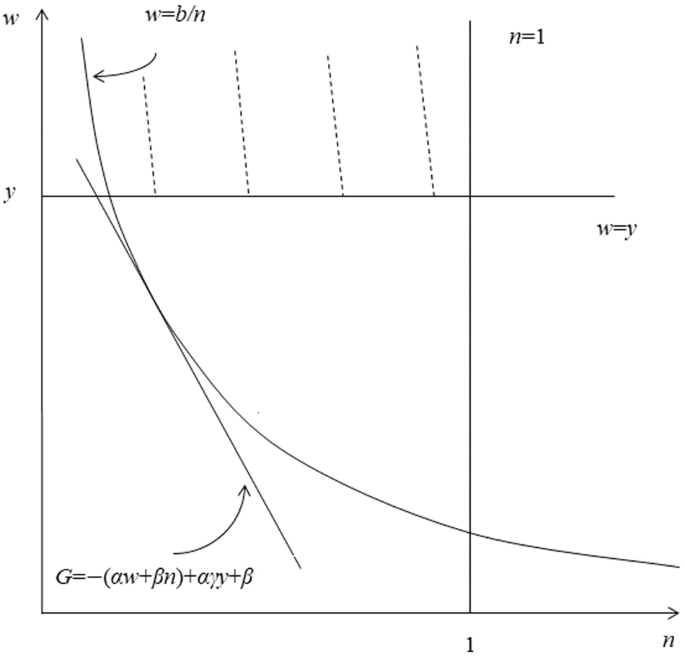
The conclusion of Proposition 1 is evident in Fig. 1. As shown in Fig. 1, shaded area between straight line \(w = y\), \(n = 0\), \(n = 1\) and curve \(w = b/n\) is value \(n\) and \(w\) can be obtained. Since the objective function \(G(n,w)\) is a linear function about \(n\) and \(w\), the indifference curve is a straight line. The closer it is to origin, greater is the objective function \(G(n,w)\). When the indifference curve is closest to the origin, when \(n\) and \(w\) are zero and \(y\) respectively, the government benefit function reaches its maximal value.
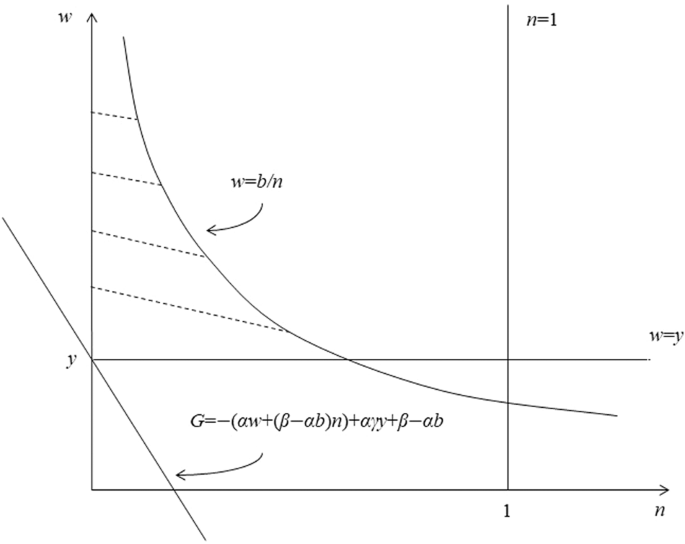
When wages are low (w), the optimal choice is at the intersection of w = y and n = 0.
If government does not provide sufficient wages, rational officials will engage in corruption at the risk of being caught. If the government also employs some supervisors, the contribution of illicit funds recovered by supervisors to government benefit cannot compensate for the loss of government benefit caused by wages paid to supervisors. In this case, the cost of combating corruption exceeds the societal loss induced by its acceptance. In order to maximize government benefit, a rational government will inevitably decide not to employ any supervisors, and to reduce the wages of government employees to the lowest level, that is, per capita income \(y\).
Optimal choice for high wage (\(w \ge b/n\))
When wage (\(w \ge b/n\)) is higher, rational officials will discover that the benefits \(w\) of normal work will not be less than the anticipated benefits of corruption \(\left( {1 - n} \right)w + b\), so all officials will choose to work normally. Similar to the previous scenario, the focus of this section will be on analyzing the government’s optimal choices to maximize the government benefit function G(n, w).
At this time, the total benefits of official corruption \(B\left( {n,w} \right)\) will be 0, and the government benefit function \(G(n,w)\) will be reduced to
Thus, we have the following proposition.
Proposition 2. When wage (\(w \ge b/n\)) is higher, the optimal number of supervisors and wages \(\left( {n_2^ \ast ,w_2^ \ast } \right)\) that the government should choose can be divided two situations:
i. If \(y < \sqrt {\beta b/\alpha }\), then
where value of government benefit function is
ii. If \(y \ge \sqrt {\beta b/\alpha }\), then
where value of government benefit function is
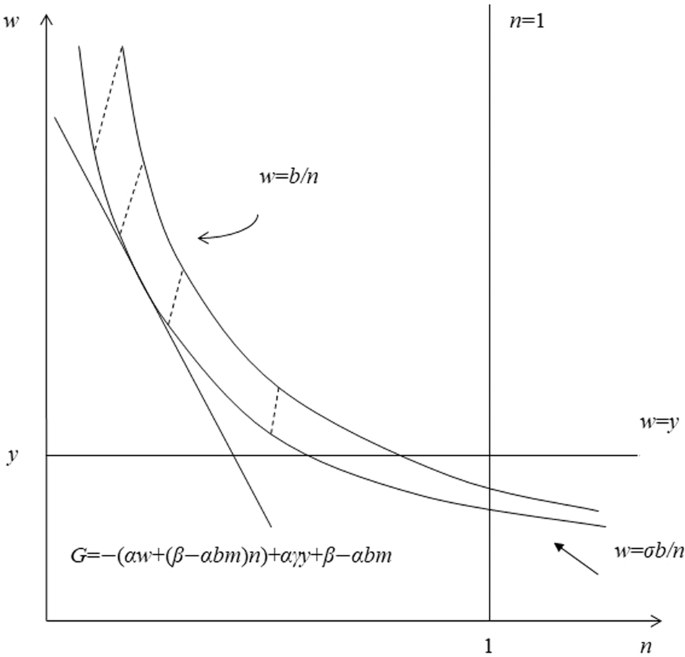
Graphically, if the government increases wages, the spectrum of values \(\left( {n,w} \right)\) in Fig. 1 will not fall below the curve \(w = b/n\). As shown in Fig. 2, shaded area between straight line \(w = y\), \(n = 1\) and curve \(w = b/n\) is value \(n\) and \(w\) can be obtained. Currently, the objective function \(G(n,w)\) is still a linear function with respect to \(n\) and \(w\), so the indifference curve is a straight line. Similarly, the closer to origin indifference curve represents, the greater value of objective function. Obviously, if the minimum wage constraint is small, i.e., \(y\) is small, then the optimal choice must be at the point where the indifference curve and \(w = b/n\) tangent; on the other hand, if the minimum wage constraint is large, optimal choice is at the point where \(w = y\) and \(w = b/n\) intersect, as shown in Fig. 3.
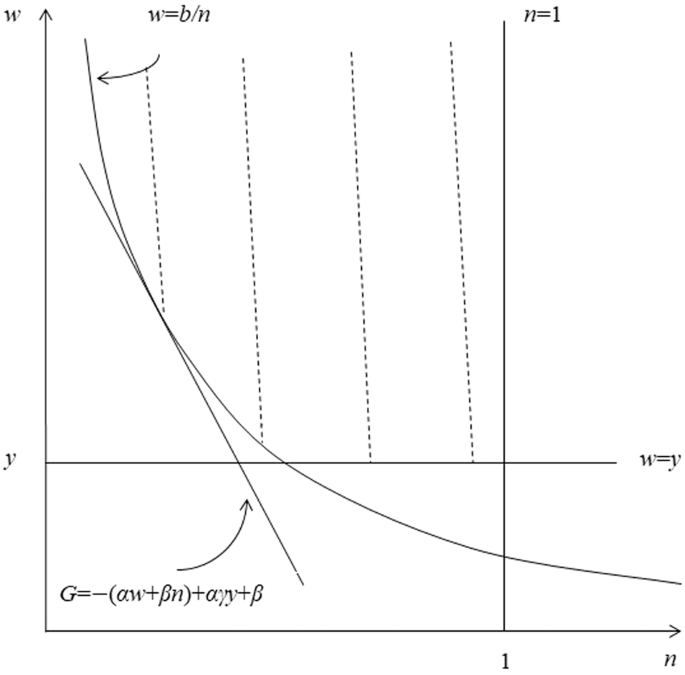
If the minimum wage constraint is small, the optimal choice is at the point where w = b/n is tangent to G(n, w).
If the minimum wage constraint is large, optimal choice is at the point where \(w = y\) and \(w = b/n\) intersect.
If the government implements a policy to “cultivate honesty and integrity through high pay”, that is, to ensure that wages are sufficiently high to persuade rational officials to abandon the idea of corruption, then Proposition 2 describes the optimal course of action. When per capita income is very low, the government is not concerned about the impact of the minimum wage on government expenditure or government benefit. In order to ensure that payment is appropriate to “cultivate honesty and integrity”, the government will carefully consider the relationship between investment in supervisors and improvements in government benefits. It will then determine the best amount of investment and pay for supervisors. The equilibrium pay level will be more than the per capita income, and the equilibrium supervisor input will also be greater than zero. On the other hand, the minimum wage restriction has an effect on government decision-making when per capita income is high. Maintaining a large number of supervisors will be more expensive due to the high expense of paying employees. Therefore, in an ideal case, government will set the minimum per capita wage, and the number of inspectors will remain at the level necessary to “cultivate honesty and integrity” even if officials are paid per capita. As shown by Proposition 2, as per capita income increases, the minimum wage restriction also ensures a sufficiently high wage, so the optimal number of supervisors decreases as per capita income increases. This shows that as a society becomes wealthier, on the one hand, the risk of corruption increases, reduces possibility of official corruption, and the cost of anti-corruption measures rises, causing the number of supervisors to decrease.
Optimum choice of comprehensive consideration of wages
If the government only requires a minimum wage (i.e., wage should not be less than per capita income) and does not impose a high or low wage, then when choosing optimal combination of supervisors and wages \(\left( {n,w} \right)\), the government will consider the first two situations comprehensively to maximize the government benefit function \(G(n,w)\) and get optimal choice \(\left( {n^ \ast ,w^ \ast } \right)\). In this way, the corollaries for proposition 1 and 2 are as follows (see appendix for proof).
Corollary 1. If the government only restricts its employees’ minimum wage, the optimal number of supervisors and wages \(\left( {n^ \ast ,w^ \ast } \right)\) that the government should choose can be divided into the two situations below.
i. If \(y < \beta /\alpha\), then
where value of government benefit function is
ii. If \(y \ge \beta /\alpha\), then
where value of government benefit function is
Corollary 1 indicates that the best option for government investment in supervisors is to invest in none if per capita income y is so low that it drops below a particular threshold. The government currently believes that the benefits of fighting corruption surpass the expenses, even if only a small amount of effort is made. All officials are employed by the government. The highest degree of governmental gain will still be realized despite the lack of oversight and corruption among all officials. Specifically, if an economic society is relatively poor and has a low per capita income \(y\), the government’s budget \(\gamma y\) will be quite limited. To improve government benefit, the government can only improve the quality of investment in infrastructure and public utilities. Therefore, government must employ sufficient officials with relevant information and expertize to operate specific infrastructure and public utilities projects. The government’s budget constrains its anti-corruption efforts. Considering that officials, whether corrupt or not, will contribute as much to government benefit as they do to the professionalism of project implementation, and that in order to obtain such “professional” benefits from officials, the government abandoned corruption supervision when the budget was limited, in such cases corruption will not offset an official’s contribution to government benefit in a “professional” way, even if the official is corrupt.
In addition, another portion of Corollary 1 states that if per capita income y exceeds a certain threshold value, the optimal choice of government investment in supervisors is greater than zero, and its value decreases as per capita income y rises. Specifically, when a society reaches a certain level of development, the per capita income is relatively high and the government will have relatively abundant budget γy. Therefore, in pursuit of high government benefit, the government does not rely entirely on officials to enhance the quality of implementation of infrastructure and public utilities projects. The government will consider officials more. Negative impact of staff corruption on government benefit maintains a team of supervisors greater than zero. Considering that when per capita income is higher than \(y \ge \beta /\alpha\), there is \(w^ \ast = b/n^ \ast\), the government has determined a reasonable proportion of supervisors and wage rate so that the expected income of officials in corrupt situations will not be higher than normal wage income; therefore, no rational official will participate in corruption activities under these conditions. It is worth mentioning that as a society becomes more affluent, the per capita income level y continues to rise, and the minimum wage constraint increases accordingly. As a result, the risk of corruption among officials rises, and an increase in their normal wages inhibits corruption to some extent, so the government needs fewer supervisors to ensure that a rational official is not corrupt.
Figure 4 shows the relationship between the optimal number of government supervisors \(n^ \ast\) and per capita income \(y\). As shown in Fig. 4, the optimal number of supervisors remains at zero as per capita income increases from zero until per capita income exceeds a critical value of \(\beta /\alpha\), which we refer to as the “ critical value of supervising input of income.”
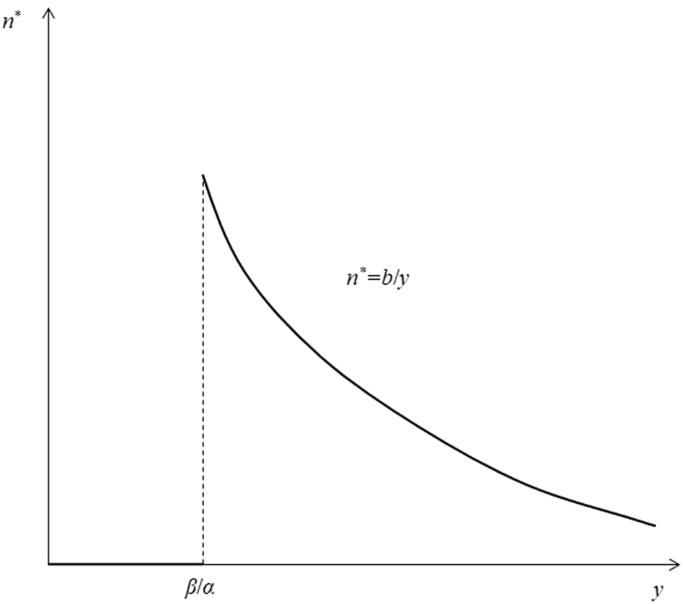
As per capita income y increases from 0, the optimal number of supervisors n undergoes a process of initially remaining at 0 level, then reaching a peak at b/y (when per capita income y reaches the critical value of β/α), and finally gradually decreasing to approach zero infinitely.
The number of optimal supervisors surged abruptly to \(b/y\) and peaked at the critical point of \(\alpha b/\beta\). As per capita income increased, the number of optimal supervisors began to decrease gradually. When per capita income approached infinity, that is, when \(y \to \infty\), the number of optimal supervisors was infinitely close to zero. Figure 4 is also in line with reality. In fact, often poorer countries frequently lack anti-corruption measures, and corruption levels are relatively high. On the contrary, the wealthier developed countries can maintain a low level of corruption while spending less on supervision. For developing countries like China, the per capita income is at a medium-level, so it is likely located close to \(\alpha b/\beta\) (the highest level of supervision).
In addition, according to the definition of \(\alpha\) and \(\beta\), if the influence of unit officials on government benefit is greater because of their own information or professional advantages, the impact of unit resources input on government benefit is relatively small. Then, the critical value of supervision input \(N\) will be larger, and the government will rely more on officials, so it will wait until a higher per capita income level to combat corruption. On the contrary, if the influence of unit officials on government benefit is relatively small due to their own information or professional advantages, and the impact of unit resource investment on government benefit is relatively large, then the critical value of supervision input \(N\) will be relatively small. Due to low capacity of officials, the government may take anti-corruption actions in advance to reduce losses.
Because we assume that all officials are homogeneous and confront the same size of corruption space, in this section of discussion, all officials will be in the same state, that is, all corrupt acts or all normal work. In the next section, we will introduce heterogeneous officials into the model and expand it to some extent.
Optimum choice of government supervision investment under heterogeneous officials
In reality, it is unlikely that all officials share the same “corruption preferences” or are completely homogeneous. Therefore, this section will discuss the optimal choice of government investment in supervision when officials have heterogeneous “corruption preferences”.
Assuming that only officials with a ratio \(m\left( {m \in \left( {0,1} \right)} \right)\) maintain original assumption, we refer to these Group \(A\) officials. The remaining officials with a ratio \(1 - m\) are more honest than the former. The “corruption space” has decreased due to their own reasons. We refer to them as Group \(B\) officials. Defining a “corruption preference coefficient” \(\sigma \left( {\sigma \in \left( {0,1} \right)} \right)\), which indicates officials’ inherent degree of corruption. We believe that Group \(B\) officials, due to their own integrity, will not fully use rights allocated to them to corrupt. Therefore, they impose restrictions on themselves to alter corruption space \(\sigma b/\left( {1 - n} \right)\). If corruption occurs with this official, he will receive additional benefit \(\sigma b/\left( {1 - n} \right)\) without being discovered, and investment in infrastructure or public utilities projects will decrease \(\sigma b/\left( {1 - n} \right)\). The smaller the “corruption preference coefficient” \(\sigma\), the more honest officials, and vice versa, the larger the corrupt officials. The “Corruption preference coefficient” of Group A officials are obviously 1.
Similarly, all officials may be in two states: normal work and corrupt state. Behavioral analysis of Group \(A\) officials can be found in the above model. For Group \(B\) officials, under normal working conditions, the benefit that each official will receive is basic wage \(w\). In a corrupt state, every official has the probability of \(p(n)\) being found to be corrupt. Once found, all wages and corrupt income will be confiscated.
Therefore, under corruption, the expected income of Group \(B\) officials is
Thus, the utility function of Group \(B\) officials can be written as
Substituting \(p(n) = n\), the formula becomes \(\left( {1 - n} \right)w + \sigma b\). So, if there is
where the benefit of Group B officials under normal work is not less than expected benefits under corrupt work, so Group B officials will choose normal work.
Conversely, if \(w < \sigma b/n\), where the benefit of Group \(B\) officials under normal work is less than the expected benefit under corrupt work, so Group \(B\) officials will choose corrupt work over normal work.
Obviously, the minimum wage to ensure that Group officials are not corrupt varies based on the varying levels of honesty of Group \(A\) officials and Group \(B\) officials themselves. In order to prevent corruption, the more honest Group \(B\) officials require a lower wage \(\sigma b/n\). The optimal choice for a government, as determined by homogeneity of officials, is either to tolerate the corruption of all officials or to have zero-tolerance for corruption, as determined by the conclusion of a previous analysis. If officials’ “corruption preference” is heterogeneous, will there be an optimal choice for the government to supervise input if some officials will choose to corrupt while others do not? Intuitively, this is possible because there is a wage range \(w \in \left[ {\sigma b/n,\,b/n} \right)\). When the wage is in this range, corruption will happen to Group \(A\) officials, but not Group \(B\) officials. If the cost of guaranteeing the non-corruption of Group \(B\) officials is less than the cost of guaranteeing non-corruption of all officials, then optimal choice of government supervision must be that wages are \(w \in \left[ {\sigma b/n,\,b/n} \right)\), where it will be a society with “partial corruption”. Next, we will confirm existence of “partial corruption” through analysis.
Similarly, when the government formulates different wage levels, it may lead to different official behavior, resulting in varying levels of corruption income \(B\left( {n,w} \right)\) of officials without detection, which will affect the form of government benefit function. Considering the inconsistent behavior of Group \(A\) officials and Group \(B\) officials, we will discuss it in three cases: the first is the optimal choice of supervision input when the wage is low, i.e., \(w < \sigma b/n\). The second is optimal choice of supervisory input when the medium wage is \(\sigma b < w < b/n\). The third is optimal choice of supervisory input when the wage is high, i.e., \(w \ge b/n\).
Optimal choice for low wage (\(w < \sigma b/n\))
When lower the wage \(w < \sigma b/n\), according to the previous analysis, both Group \(A\) and Group \(B\) officials will find that the expected benefits of corruption will be greater than those of their normal work, so all officials will choose to corrupt. Corruption of Group \(A\) officials will have additional benefits \(b/\left( {1 - n} \right)\) if it is not discovered by supervisor. Corruption of Group \(B\) officials will have additional benefits \(b/\left( {1 - n} \right)\) if it is not discovered by supervisor, then total corruption benefits of officials \(B\left( {n,w} \right)\) is
and government benefit function \(G(n,w)\) is reduced to
Thus, we have the following proposition.
Proposition 3. When the wage (\(w < \sigma b/n\)) is lower, the optimal number of supervisors and their salaries \(\left( {n_3^ \ast ,w_3^ \ast } \right)\) are \(\left( {n_3^ \ast ,w_3^ \ast } \right) = \left( {0,y} \right)\), the value of government benefit function is
Similar to Proposition 1, the conclusion of Proposition 3 can be obtained by making a slight modification to Fig. 1. As shown in Fig. 5, the shaded area enclosed between the line \(w = y,n = 0,n = 1\) and the curve \(w = \sigma b/n\) are the values that can be obtained for \(n\) and \(w\). The indifference curve remains a straight line. The closer it is to the origin, the larger the objective function \(G(n,w)\) becomes. Therefore, when the indifference curve is closest to the origin, the \(n\) and \(w\) are 0 and y, respectively, where the government benefit function reaches its maximum.
When the wage (w < σb/n) is low, the optimal number of supervisors and their salaries satisfy n = 0 and w = y.
If the salary is insufficient, then both Group \(A\) and Group \(B\) officials will choose to engage in corruption at the risk of being discovered. If government continues to employ some supervisors, even though corruption losses caused by more honest Group \(B\) officials will be less than in the previous model, the contribution of corrupt funds recovered by supervisors to government benefit still cannot make up for wages paid to supervisors. The loss, or in this case, the cost of curbing corruption for the entire society is greater than that of tolerating it. When wages are restricted by an upper limit, a reasonable government will inevitably choose not to employ any supervisors and reduce wages of government employees to the lowest level, that is, per capita income \(y\), so as to obtain the highest level of government benefit.
In addition, it is simple to find that the optimal value of the government benefit function is a decreasing function of both the proportion m of Group \(A\) officials and the corruption preference coefficient \(\sigma\) of Group \(B\) officials. This demonstrates that when proportion \(m\) of corrupt Group \(A\) officials m is smaller and proportion \(1 - m\) of honest Group \(B\) officials is larger, the value of optimal government benefit function is larger. At the same time, if the corruption preference coefficient \(\sigma\) of Group \(B\) officials is small, indicating that the level of honesty of Group \(B\) officials is higher, then the value of optimal government benefit function will be large. These conclusions are also in line with our intuitive understanding. The smaller \(m\) and \(\sigma\), the more honest a society is, the greater government benefit will obviously be.
Optimal choice for medium wage (\(\sigma b \le w < b/n\))
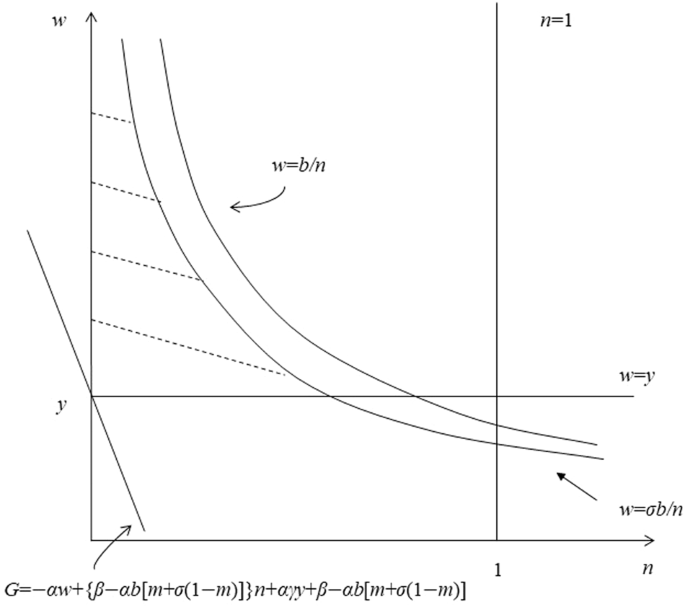
When wages are in a medium range \(\sigma b \le w < b/n\), rational Group \(A\) officials will find that the expected benefits of corruption \(\left( {1 - n} \right)w + b\) are greater than those w of normal work, while rational Group \(B\) officials will observe that the expected benefits of normal work will not be less than those of corruption \(\left( {1 - n} \right)w + \sigma b\) at this time, as all Group \(A\) officials will choose corruption work and all Group \(B\) officials will choose normal work. Currently, total revenue of corruption \(B\left( {n,w} \right)\) is as follows
and the government benefit function \(G\bf \left( {n,w} \right)\) is reduced to
Thus, we have the following proposition (proof omitted).
Proposition 4. When wages are within the medium-level range \(\sigma b \le w < b/n\), the optimal number of supervisors and their salaries \(\left( {n_4^ \ast ,w_4^ \ast } \right)\) depend on income per capital y.
i. If \(y < \sqrt {\sigma b\left( {\beta - \alpha bm} \right)/\alpha }\), then
where the value of government benefit function is
ii. If \(y \ge \sqrt {\sigma b\left( {\beta - \alpha bm} \right)/\alpha }\), then
where the value of government benefit function is
As depicted in Fig. 6, if the government sets wages at the mediate-level, the range \(\left( {n,w} \right)\) of values will be between curves \(w = b/n\), \(w = \sigma b/n\). Therefore, the value of the shadowed area surrounded by straight line \(w = y\), \(n = 1\) and curves \(w = b/n\), \(w = \sigma b/n\) can be obtained by \(n\) and \(w\), At this time, the objective function \(G(n,w)\) is still a linear function about \(n\) and \(w\), so the indifference curve is a straight line. Similarly, the closer to origin indifference curve represents, the greater value of objective function. Similar to previous results, if the minimum wage constraint is small, that is, \(y\) is small, then the optimal choice must be at the point where difference curve and \(w = \sigma b/n\) are tangent. If the minimum wage constraint is large, however, the optimal choice is the intersection of \(w = y\) and \(w = \sigma b/n\).
If the minimum wage constraint is small, the optimal choice must be at the point where difference curve and w < σb/n are tangent. If the minimum wage constraint is large, the optimal choice is the intersection of w = y and w < σb/n.
The situation described in Proposition 4 is a form of “partial corruption”, in which only a part of officials (Group \(A\) officials) will be corrupted while the rest will not. If the government can only set wages within a certain range, which may lead to “partial corruption” due to certain constraints, then the government’s optimal choice is as outlined in Proposition 4. When per capita income is very low, the government is unconcerned about the impact of the minimum wage on government expenditure or government benefits. Government will thoroughly evaluate the relationship between investment in supervisors and improvement in government benefits, and determine an optimal investment of supervisors and wage level. Since it cannot fundamentally restrain corruption of Group \(A\) officials, the government will employ a high proportion of supervisors to ensure investigation rate of corruption after an incident, and will also pay higher wages than the per capita income. On the other hand, when per capita income is high, however, the minimum wage constraint has a certain impact on government’s decision-making. Because the cost of paying wages is too high, maintaining a higher number of supervisors will incur additional cost. Therefore, in the optimal case, the government will establish a minimum per capita wage. As the government function cannot prevent the corruption of Group \(A\) officials, it will maintain the number of supervisors at a level that only the average salary of Group \(B\) officials can guarantee to “cultivate honesty and integrity”.
Optimal choice for high wage (\(w \ge b/n\))
When wages are higher \(w \ge b/n\), both Group \(A\) and Group \(B\) officials will find that the benefits of normal work will not be less than expected benefits of corruption. Therefore, all officials will opt to work normally. At this time, the total revenue from official corruption \(B\) is 0, and the government benefit function \(G(n,w)\) is reduced to
Consequently, we are in the same situation as in section 2 of the previous part, so Proposition 2 is the conclusion.
It can be seen that when the government sets a high enough wage, regardless of how different officials are, they will not engage in corruption, so the heterogeneity of officials will not influence government’s decision-making.
Optimal choice with comprehensive consideration of salary when corruption preference is heterogeneous
If only minimum wage is required (i.e., wages should be no less than per capita income) and there are no other interval constraints, the government will consider the first three situations to maximize the government benefit function \(G(n,w)\) and obtain the optimal choice \(\left( {n^ \ast ,w^ \ast } \right)\) when determining the optimal combination of supervisors and wages \(\left( {n,w} \right)\). It is noteworthy that the optimal choice of government lead to the emergence of “partial corruption” due to the heterogeneity of officials. We are concerned about whether it is possible for the government to consider all circumstances and choose the optimal wage to be set within an interval where “partial corruption” will occur if government’s wages are not constrained by interval. First, we argue that if per capita income is low, the optimal choice for government, similar to the case of homogeneous officials, is to maintain wages in per capita income without employing any supervisors. The following inferences are provided (see appendix for proof).
Corollary 2. If only the minimum wage is constrained, then when \(y < \sqrt {\beta b/\alpha }\), the value of the government benefit function is \(\left( {n^ \ast ,w^ \ast } \right) = \left( {0,y} \right)\), where the value of government benefit function is
Corollary 2 demonstrates that if the per capita income \(y\) is below a certain value, the optimal choice for government investment in supervisors is to not invest in any supervisors. Similar to the previous part of Corollary 1, Corollary 2 states that when per capita income is low, the government’s budget and limitations cannot support the cost of anti-corruption. Even if society is relatively honest, that is, there are smaller \(m\) and smaller \(\sigma\), the government will not raise wages to combat the corruption of the more honest Group \(B\) officials.
Obviously, we know from corollary 2 that if \(y < \sqrt {\beta b/\alpha }\), the optimal choice of government does not occur to be “partial corruption”. Then when \(y \ge \sqrt {\beta b/\alpha }\), is it possible for this situation to occur? The answer is yes; we provide lemma (see appendix for proof).
Lemma 1. Denote a function of \(m\):
where \(\delta = \beta /\alpha\). There exist \(\sigma \in \left( {0,1} \right)\) and \(m \in \left( {0,1} \right)\) such that \(\sigma < g\left( m \right)\).
In other words, set \(p = \left\{ {\left( {m,\sigma } \right)\left| {\sigma < g\left( m \right),m \in \left( {0,1} \right),\sigma \in \left( {0,1} \right)} \right.} \right\}\) satisfies \(P \ne \emptyset\).
As a result, we stipulate that government’s optimal choice may lead to “partial corruption”. Assuming that Assumption 2 is true, we provide Proposition 5 (See Appendix for proof).
Assumption 2. The ratio \(m\) of Group \(A\) officials and corruption preference coefficient \(\sigma\) of Group \(B\) officials satisfy the following constraints:
Proposition 5. If only the minimum wage of its employees is constrained, then, if and only if Assumption 2 holds, there exists a per capita income range that causes “partial corruption” if the optimal supervising input level chosen by the government is optimal. The government weighs the number of supervisors and wages \(\left( {n^ \ast ,w^ \ast } \right)\) that maximize government benefit in all cases into three categories.
i. If \(y < \frac{{\delta - bm}}{{1 - m}}\), then
at this time, the value of government benefit function is
ii. If \(\frac{{\delta - bm}}{{1 - m}} \le y < \frac{{\delta \left( {1 - \sigma } \right)}}{m} + \sigma b\), then
at this time, value of government benefit function is
iii. If \(y \ge \frac{{\delta \left( {1 - \sigma } \right)}}{m} + \sigma b\), then
where the value of government benefit function is
In the case of Assumption 2 being satisfied, cases i and ii in Proposition 5 are analogous to those of Corollary 1; that is, when per capita income \(y\) is very low and even lower than a certain critical value, the optimal choice for investing in supervisors is zero. Now, all officials will attempt to corrupt, but when the per capita income \(y\) is high enough and even higher than some critical value, the government will invest more in supervision to prevent corruption. Notably, in case ii of Proposition 5, when per capita income \(y\) is at a mediate-level, the optimal choice for the government is to invest a certain number of supervisors to prevent Group B officials from engaging in corruption. In other words, the government believes that only the most honest officials will not invest in corruption supervising costs. Relative to government benefit, benefits are relatively small. At the same time, the cost of investing so heavily in supervisors that no government officials will attempt to corrupt them is greater than the increase in government benefit. In this way, “partial corruption” results from the government’s optimal choice.
Proposition 5 reveals the existence of “partial corruption”, but its existence is contingent on the truth of Assumption 2. When ratio \(m\) of Group \(A\) officials and corruption preference coefficient \(\sigma\) of Group \(B\) officials are within set \(P\), it is conceivable for “partial corruption” to occur, noting definition of set \(P\), that is, when \(\sigma < g\left( m \right)\), there will be “partial corruption”. As far as we know, \(g\left( m \right)\) is the decreasing function of \(m\), so when bothσand m are smaller, it is easier to satisfy \(\sigma < g\left( m \right)\), and “partial corruption” is more likely to occur. Intuitively, the smaller the \(m\), the fewer corrupt Group \(A\) officials and the greater the number of honest Group \(B\) officials. Government chooses appropriate supervising input so that Group \(B\) officials will not attempt to corrupt benefits of situation will be greater than the larger m, and the cost of supervising input has not changed. Therefore, it is more likely that “partial corruption” will occur. In addition, the smaller the σ is, the more honest Group \(B\) officials are. Government selects appropriate supervising input and only makes the cost of Group \(B\) officials not attempting corruption smaller than that of the larger \(\sigma\), so “partial corruption” is also more likely to occur. To sum up, a smaller m means that stopping corruption of Group \(B\) officials will produce greater benefits, and a smaller σ means that stopping corruption of Group \(B\) officials will produce smaller costs, and the combination of the two makes the emergence of “partial corruption” possible. This also partially explains why it has always been difficult to eradicate corruption in some middle-income countries.
The result of Proposition 5 suggests a possible relationship between the optimal number of supervisors n* and per capita income y under heterogeneous officials. Figure 7 illustrates the relationship If Assumption 2. As shown in Fig. 7, the critical value of supervising input for income \(N\) is \(N\left( m \right) = \frac{{\delta - bm}}{{1 - m}}\).
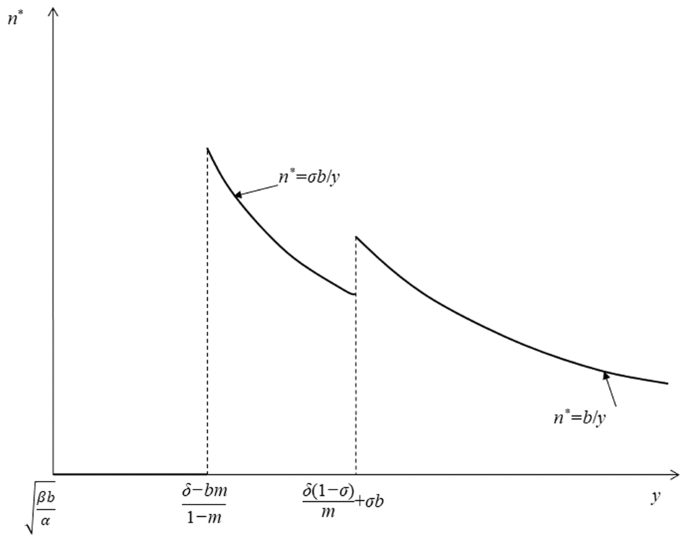
The critical value of supervising input for income is N(m) = (δ − bm)/(1 − m) in a period of “partial corruption”. Correspondingly, in the period of “comprehensive anti-corruption”, the critical value of comprehensive supervising of income can be denoted as L(m,σ) = δ(1 − σ)/(1 − m) + σb.
Since \(N\left( m \right)\) is an increasing function as to \(m\), therefore, when \(m\) is smaller, the critical value of supervising input is smaller, and the society will enter an anti-corruption period earlier as per capita income rises. Intuitively, the smaller \(m\) is, the more honest its officials, the greater the likelihood that the government will invest in proactive supervising. As the government knows that the cost of supervising honest officials is not excessively high, but because there are such officials, it will receive more government benefits.
Figure 7’s optimal supervising input exhibits two jumps compared to Fig. 4. Obviously, the first jump in critical value of supervision input ushers in a period of “partial corruption”, whereas the second jump ushers in a period of “comprehensive anti-corruption”, so the government will invest fully in inspectors so that no officials will attempt corruption. We will turn this jump point as “ critical value of comprehensive supervising of income”, and denote as \(L\), according to Proposition 5 and Fig. 7, we have
Since \(L\left( {m,\sigma } \right)\) is a decreasing function as to \(m\) and \(\sigma\), the larger \(m\) and \(\sigma\) are, the smaller \(L\left( {m,\sigma } \right)\) is, and the earlier the government will enter comprehensive anti-corruption period. Intuitively speaking, the larger \(m\) and \(\sigma\) indicates that Group \(A\) officials are more and Group \(B\) officials are less honest than Group \(A\) officials. Group \(B\) officials does not pay sufficient attention to Group \(A\) officials due to their small number and lack of difference from Group officials in terms of corruption. Therefore, the government will be more aware of anti-corruption’s flaws and will advance comprehensive anti-corruption. In addition, as shown in Fig. 5, when per capita income is close to the “critical value of overall supervising of income” \(L\left( {m,\sigma } \right)\), the optimal level of supervising input may be the same, but the economy and society before per capita income is \(L\left( {m,\sigma } \right)\) will produce “partial corruption”, whereas the economy and society after \(L\left( {m,\sigma } \right)\) will not. If \(L\left( {m,\sigma } \right)\) is regarded as demarcation point between middle-income countries and developed countries, then this model partially explains why poorer countries have more corruption than richer countries in terms of supervising investment at a lower level.
As shown in Fig. 7, the optimal level of government supervision input causes per capita income range of “partial corruption” occur between the critical value of supervising input of income \(N\) and the critical value of overall supervising of income \(L\). From the monotony of \(N\left( m \right)\) and \(L\left( {m,\sigma } \right)\), it can be deduced that the range enlarges with a decrease of \(m\) and \(\sigma\), and with the increase of \(m\) and \(\sigma\). When \(m\) and \(\sigma\) reaches a certain value, the area ceases to exist and degenerates to the situation depicted in Fig. 4, that is, “partial corruption” does not exist, as shown by Proposition 6 (see appendix for evidence).
Proposition 6. If Assumption 2 is false and the government only restricts its employees’ minimum wage, then the optimal level of supervision input chosen by government will not result in “partial corruption” regardless of the per capita income. To maximize government benefit in all circumstances, the government weighs the number of supervisors and their wages \(\left( {n^ \ast ,w^ \ast } \right)\). It can be divided into two cases:
i. If \(y < \frac{\delta }{{m + \left( {1 - m} \right)\sigma }}\), then
at this time, value of government benefit function is
ii. If \(y \ge \frac{\delta }{{m + \left( {1 - m} \right)\sigma }}\), then
at this time, value of government benefit function is
If Assumption 2 is invalid, then Proposition 6 gives relationship between the optimal level of supervising input level and per capita income. Its figure resembles Fig. 4. Only difference is that the critical value of supervising input of income \(N\) is
Since \(N\left( {m,\sigma } \right)\) is a decreasing function of \(m\) and \(\sigma\), the larger \(m\) and \(\sigma\) are, the smaller \(N\left( {m,\sigma } \right)\) is, and the earlier the government will enter a comprehensive anti-corruption period. Obviously, because \(m + \left( {1 - m} \right)\sigma < 1\), the critical value of input from income supervising is larger than that of homogeneous officials. This is due to the fact that existence of Group \(B\) officials make the whole society more honest than homogeneous officials. Therefore, under the same level of per capita income, if comprehensive anti-corruption measures are taken. Obviously, higher benefits can be obtained in societies with greater corruption. In other words, the existence of more honest Group \(B\) officials reduce the government’s concern about corruption, resulting in the government taking supervision inputs later.
Conclusion and discussion
Corruption has always been a worldwide issue, particularly in developing countries. In light of the fact that people do not yet have a clear understanding of how to balance the cost of corruption and anti-corruption supervision input, this paper has conducted a certain amount of theoretical research in this area.
Our research indicates that when per capita income is low, the optimal level of surveillance investment is virtually zero. Specifically, in a poorer socio-economic context where per capita income is below the “surveillance investment threshold,” government budgets are severely limited and unable to cover the costs of rigorous anti-corruption measures. Even minor efforts against corruption yield societal benefits that transcend the costs of such initiatives. Hence, governments can only enhance the quality of infrastructure and public service investment to advance government benefits. The chosen strategy entails hiring enough officers with relevant information and professional skills to implement specific infrastructure and public service projects with nearly zero investment in surveillance personnel. This choice is driven by the fact that officials, whether corrupt or not, can provide the same amount of government benefit due to their professional expertize in project implementation.
Secondly, when per capita income grows to a certain level, the optimal level of surveillance investment suddenly maximizes and declines as per capita income increases but always maintains a level greater than zero. In other words, as a society develops to a certain level, per capita income rises above the “surveillance investment threshold,” allowing the government a more flexible fiscal budget. At this stage, the government’s pursuit of high government benefits does not rely solely on improving project implementation quality by officers. The government also considers the negative impact of official corruption on societal welfare, therefore maintaining a positive level of supervision, reaching a maximum when per capita income is at the “surveillance investment threshold.” Furthermore, when per capita income is relatively high, the government determines a reasonable proportion and wage rate for surveillance personnel so that officials’ expected benefits from corruption do not exceed their normal wage income. In such a scenario, no rational official would participate in corrupt activities.
Finally, when officials’ corruption levels are heterogeneous, the proportion of more honest officials is larger, and their degree of honesty is higher. There may exist a middle per capita income range where an optimal level of supervising input results in “partial corruption.” In this scenario, the government only needs to maintain supervision input at a level that prevents honest officials from engaging in corruption. This conclusion also partly explains why poorer countries have higher corruption levels compared to wealthier countries when supervising investment is at a lower level. Additionally, this paper sheds light on the persistent challenge of eradicating corruption in certain middle-income countries.
The findings of this research provide a new perspective for understanding and addressing the corruption problem. However, it is worth noting the limitations of our study. First, our model is based on idealized assumptions and does not fully consider other potential factors affecting corruption, such as cultural factors, political environment, legal system, etc. The omission of these factors may impose certain restrictions on the practical application of our model. Second, our model is theoretically driven but lacks sufficient empirical data for validation, which could lead to potential bias in our conclusions. Third, our study assumes that the government’s budget allocation is solely based on economic efficiency considerations without considering the realities of political trade-offs and societal pressures. These factors can play a crucial role in the actual decision-making process. Moreover, our study predominantly features a static model without fully considering the time factor. For instance, as socio-economic development progresses, public tolerance of corruption may change, affecting the optimal level of corruption and anti-corruption surveillance investment. Future research could build a dynamic model to examine the influence of temporal variations and multiple factors on corruption and anti-corruption surveillance investment. In addition, laboratory experiments involving corruption games provide a more intuitive and operational method to assess and understand corruption decision-making behavior, presenting another area for continued development and refinement in future studies.
Data availability
Data sharing is not applicable to this article as no datasets were generated or analyzed during the current study.
References
Acemoglu D, Verdier T (1998) Property rights, corruption and the allocation of talent: a general equilibrium approach. Econ J 108(450):1381–1403. https://doi.org/10.1111/1468-0297.00347
Acemoglu D, Verdier T (2000) The choice between market failures and corruption. Am Econ Rev 90(1):194–211. https://doi.org/10.1257/aer.90.1.194
Aidt T (2009) Corruption, institutions and economic development. Oxf Rev Econ Policy 25(2):271–291. https://doi.org/10.1093/oxrep/grp012
Aidt T, Dutta J, Sena V (2008) Governance regimes, corruption and growth: theory and evidence. J Comp Econ 36(2):195–220. https://doi.org/10.1016/j.jce.2007.11.004
Alfada A (2019) The destructive effect of corruption on economic growth in Indonesia: a threshold model. Heliyon 5(10):e02649. https://doi.org/10.1016/j.heliyon.2019.e02649
Banerjee A, Hanna R, Mullainathan S (2013) “Corruption”. In: Gibbons R, Robert J eds. Handbook of organizational economics. Princeton University, Ch. 27, New Jersey
Banerjee R (2016) On the interpretation of bribery in a laboratory corruption game: moral frames and social norms. Exp Econ 19:240–267. https://doi.org/10.1007/s10683-015-9436-1
Banerjee R, Boly A, Gillanders R (2022) Anti-tax evasion, anti-corruption and public good provision: An experimental analysis of policy spillovers. J Econ Behav Organ 197:179–194. https://doi.org/10.1016/j.jebo.2022.03.006
Beck PJ, Maher MW (1986) A comparison of bribery and bidding in thin markets. Econ Lett 20(86):1–5. https://doi.org/10.1016/0165-1765(86)90068-6
Belgibayeva A, Plekhanov A (2019) Does corruption matter for sources of foreign direct investment? Rev World Econ 155(3):487–510. https://doi.org/10.1007/s10290-019-00354-1
Bhagwati JN, Srinivasan TN (1982) The welfare consequences of directly-unproductive profit-seeking (DUP) lobbying activities: price versus quantity distortions. J Int Econ 13(1-2):33–44. https://doi.org/10.1016/0022-1996(82)90004-6
Blackburn K, Bose N, Haque ME (2006) The incidence and persistence of corruption in economic development. J Econ Dyn Control 39(12):2447–2467. https://doi.org/10.1016/j.jedc.2005.07.007
Dollar D, Fisman R, Gatti R (2001) Are women really the “fairer” sex? Corruption and women in government. J Econ Behav Organ 46(4):423–429. https://doi.org/10.1016/S0167-2681(01)00169-X
Dong B, Torgler B (2010) The consequences of corruption: evidences from China. Fondazione Eni Enrico Mattei (FEEM), Institutions and Markets Papers No. 91006. https://doi.org/10.22004/ag.econ.91006
Dzhumashev R (2014) Corruption and growth: the role of governance, public spending, and economic development. Econ Model 37(574):202–215. https://doi.org/10.1016/j.econmod.2013.11.007
Egger P, Winner H (2005) Evidence on corruption as an incentive for foreign direct investment. Eur J Polit Econ 21(4):932–952. https://doi.org/10.1016/j.ejpoleco.2005.01.002
Gründler K, Potrafke N (2019) Corruption and economic growth: new empirical evidence. Eur J Polit Econ 60:101810. https://doi.org/10.1016/j.ejpoleco.2019.08.001
Imam PA, Jacobs D (2014) Effect of corruption on tax revenues in the Middle East. Rev Middle East Econ Financ 10(1):1–24. https://doi.org/10.1515/rmeef-2014-0001
Ivanyna M, Moumouras A, Rangazas P (2016) The culture of corruption, tax evasion, and economic growth. Econ Inq 54(1):520–542. https://doi.org/10.1111/ecin.12228
James AR, Acemoglu D, Johnson S (2005) Institutions as a fundamental cause of long-run growth. Handbook of economic growth 1A:386–472. https://EconPapers.repec.org/RePEc:col:000089:002889
Jiang T, Nie H (2014) The stained China miracle: corruption, regulation, and firm performance. Econ Lett 123(3):366–369. https://doi.org/10.1016/j.econlet.2014.03.026
Krueger AO (1974) The political economy of the rent-seeking society. Am Econ Rev 64(3):291–303
Kunieda T, Okada K, Shibata A (2014) Corruption, capital account liberalization, and economic growth: theory and evidence. Int Econ 139:80–108. https://doi.org/10.1016/j.inteco.2014.03.001
Lee WS, Guven C (2013) Engaging in corruption: the influence of cultural values and contagion effects at the microlevel. J Econ Psychol 39:287–300. https://doi.org/10.1016/j.joep.2013.09.006
Leff NH (1964) Economic development through bureaucratic corruption. Am Behav Sci 8(3):8–14. https://doi.org/10.1177/000276426400800303
Lui FT (1985) An equilibrium queuing model of bribery. J Polit Econ 93(4):760–781. https://doi.org/10.1086/261329
Mauro P (1995) Corruption and growth. Q J Econ 110(3):681–712. https://doi.org/10.2307/2946696
Méndez F, Sepúlveda F (2006) Corruption, growth and political regimes: cross country evidence. Eur J Polit Econ 22(1):82–98. https://doi.org/10.1016/j.ejpoleco.2005.04.005
Méon PG, Weill L (2010) Is corruption an efficient grease? World Dev 38(3):244–259. https://doi.org/10.1016/j.worlddev.2009.06.004
Mo PH (2001) Corruption and economic growth. J Comp Econ 29(1):66–79. https://doi.org/10.1006/jcec.2000.1703
Murphy KM, Shleifer A, Vishny RW (1993) Why is rent-seeking so costly to growth? Am Econ Rev 83(2):409–414
Nie HH (2014) The impact of corruption on economic efficiency: a survey. Chin Rev Financ Stud 6(1):13–23
Pellegrini L, Gerlagh R (2004) Corruption’s effect on growth and its transmission channels. Kyklos 57(3):429–456. https://doi.org/10.1111/j.0023-5962.2004.00261.x
Petersen G (2021) Early democratization, corruption scandals and perceptions of corruption: evidence from Mexico. Democratization 28(2):333–352. https://doi.org/10.1080/13510347.2020.1819246
Rivas MF (2013) An experiment on corruption and gender. B Econ Res 65(1):10–42. https://doi.org/10.1111/j.1467-8586.2012.00450.x
Shleifer A, Vishny RW (1993) Corruption. Q J Econ 108(3):599–617. https://doi.org/10.2307/2118402
Shleifer A, Vishny RW (1994) Politicians and firms. Q J Econ 109(4):995–1025. https://doi.org/10.2307/2118354
Šumah Š (2018) Corruption, causes and consequences. In: Bobek V (ed.) Trade and global market, InTech, Austria. https://doi.org/10.5772/intechopen.72953
Svensson J (2005) Eight questions about corruption. J Econ Perspect 19(3):19–42. https://doi.org/10.1257/089533005774357860
Swaleheen M (2011) Economic growth with endogenous corruption: an empirical study. Public Choice 146(1):23–41. https://doi.org/10.1007/s11127-009-9581-1
United Nations (2003) United Nations Convention against Corruption https://www.unodc.org/unodc/en/corruption/uncac.html. Accessed 20 Feb 2007
Wang Y, You J (2012) Corruption and firm growth: evidence from China. China Econ Rev 23(2):415–433. https://EconPapers.repec.org/RePEc:see:wpaper:118
Wei SJ (2000) How taxing is corruption on international investors? Rev Econ Stat 82(1):1–11. https://www.jstor.org/stable/2646667
Wei SJ (1997) Why is corruption so much more taxing than tax? NBER Working Paper No. 6255. https://EconPapers.repec.org/RePEc:nbr:nberwo:6255
Yin ZD, Nie HH (2020) Corruption, officials governance and economic development. China Econ Q 19(2):411–432. https://doi.org/10.13821/j.cnki.ceq.2020.01.02
Zheng B (2015) Bureaucratic corruption and economic development. SSRN Electron J. https://ssrn.com/abstract=2456895
Acknowledgements
We would like to thank He Huang for her proofreading work on this manuscript.
Author information
Authors and Affiliations
Contributions
All authors have contributed to the research and manuscript. SY and MZ conceptualized the overall study scope, design, and methodology. MZ, HZ, and LZ conducted the analyses, and interpreted the results. The corresponding author, XP, JZ, and DL supervise the study. MZ and HZ prepared the draft of the manuscript. MZ, HZ, DL, XP, and JZ reviewed the draft. All authors have approved the final version.
Corresponding author
Ethics declarations
Competing interests
The authors declare no competing interests.
Ethical approval
This article does not contain any studies with human participants performed by any of the authors.
Informed consent
This article does not contain any studies with human participants performed by any of the authors.
Additional information
Publisher’s note Springer Nature remains neutral with regard to jurisdictional claims in published maps and institutional affiliations.
Supplementary information
Rights and permissions
Open Access This article is licensed under a Creative Commons Attribution 4.0 International License, which permits use, sharing, adaptation, distribution and reproduction in any medium or format, as long as you give appropriate credit to the original author(s) and the source, provide a link to the Creative Commons license, and indicate if changes were made. The images or other third party material in this article are included in the article’s Creative Commons license, unless indicated otherwise in a credit line to the material. If material is not included in the article’s Creative Commons license and your intended use is not permitted by statutory regulation or exceeds the permitted use, you will need to obtain permission directly from the copyright holder. To view a copy of this license, visit http://creativecommons.org/licenses/by/4.0/.
About this article

Cite this article
Zhang, M., Zhang, H., Zhang, L. et al. Corruption, anti-corruption, and economic development. Humanit Soc Sci Commun 10, 434 (2023). https://doi.org/10.1057/s41599-023-01930-5
Received:
Accepted:
Published:
DOI: https://doi.org/10.1057/s41599-023-01930-5
