
Abstract
Many undergraduate business students in the United Kingdom (UK) find themselves during the initial stages of their degree programmes required to study numerical subjects which, for many, have not been encountered since completing compulsory education. This paper considers the utilisation of a technology-based approach in order to support first-year undergraduate students engage with and achieve in the business numeracy subject area. The purpose of this paper is providing background introduction to new pedagogy through the use of technology. Through a longitudinal study conducted within a modern university in the UK over a 11-year period (2006–2017), this paper qualifies the impact of a video-based learning (VBL) approach on the achievement profiles of first-year undergraduate students within a modern business school. Results indicate that the use of a VBL approach such as that adopted within this study supports not only improvement in the number of students gaining an overall pass, but also an overall improvement amongst higher achieving students within business numeracy. Findings also demonstrate those characteristics of a VBL approach that support continuation of student engagement with the subject matter throughout their studies. Whilst such findings offer a range of benefits to both students and educators in enhancing student achievement, these also serve to introduce a new learning model which will be explored in subsequent research.
Introduction
A fundamental concept tested within this research is that engagement with learning materials outside of the formal classroom setting promotes more positive interaction between the subject matter and the student learner. The expansion of the environment for learning (particularly in response to the Covid19 pandemic) beyond the physical infrastructure of a typical university setting requires new thinking in respect of engaging the learner as not only recipient of information, but as an active participant in the learning process. The application of video-based learning (VBL) is considered to be an approachable medium through which continued engagement is encouraged, thereby empowering students to engage with subject material in a manner befitting their personal circumstances. It is acknowledged that the current climate of the UK university sector is one in which students measure their “return on investment” in higher education not only in the value of qualifications, but also the employability focus of the degree. The achievement of graduate employability is often linked to the graduate’s ability to demonstrate a range of competencies of which numeracy and numerical analysis are a constant feature (Lee, 2016). In achieving Teaching Excellence Framework (TEF) goals, both mathematics and statistical subjects require more attention than had previously been afforded, placing an increasing emphasis on universities keeping up with the rapid growth of technology developments (Davies et al., 2017; Hussein, 2017).
As technology has become increasingly integrated in the lives of young people (Ofcom, 2017), a constant demand is placed upon them to interact with changing technologies for communication, transaction, pleasure etc. (Office of Education Technology, 2017). It is undeniable that access to social media, gaming technology and “on demand” entertainment platforms have fundamentally altered the broader context of human/technology interaction. As this technological environment has (and continues to evolve) it must be acknowledged that learners will have an expectation that support for learning will be available through a technology-driven media. Against these wider social “backdrops” there is therefore, a clear role for technology enhanced learning within the academic context. These in turn may take a number of formats such as problem solving through such encounters as game platforms, acquisition of information (knowledge and skill acquisition) and media platforms such as “YouTube” (Lewis, 2019). For many students today, their initial and continued engagement within higher education is often shaped by their experiences of teaching and learning within the first year of their programme of study (Lewis, 2019).
The aim of this research is therefore, to evaluate the effectiveness of a VBL environment as a means of improving the teaching and learning experiences of first-year undergraduate business students within the area of statistics (measured by achievement under examination and assessment conditions). Whilst students themselves achieve course entry thresholds, university admissions policies offer limited or no consistency in respect of mathematics as an entry requirement for Business Schools (Darlington and Bowyer, 2016; McAlinden and Noyes, 2019). This therefore presents a number of opportunities to explore the potential relationships between media-enhanced learning encounters, student learning experience and student achievement in the mathematics subject areas within the context of the business disciplines (Lewis, 2019). Research objectives centre on a comparative, longitudinal study of academic achievements as a means of determining the potential application of VBL within the academic environment. An analysis of students’ assessments marks, students’ engagement and feedback via VBL in respect of the impact on achievement within structured assessment tasks will lead to a greater understanding of the preferences for learning through VBL.
A key aspect of this research is the longitudinal nature of the study in which student achievement data has been analysed over a period of 11 years (Lewis, 2019). This research enables not only a demonstration of the immediate impact of video-based technology but also reviews the inclusion of a technology-driven approach to learning in supporting student attainment and achievement.
Mathematics for non-specialists in higher education
The scope of this research is limited to those students within the broader spectrum of the business disciplines in which there is no expectation or entry requirement upon students to have studied mathematics at a post-compulsory level (Lewis, 2019).
In addressing perceived and actual limitations of mathematics understanding amongst applicants, a number of UK universities include mathematics and statistics classes within their curriculum (Croft et al., 2016). Whilst there are numerous research papers demonstrating the success of mathematics support groups, these papers also recognised that the number of students engaging in support activities is significantly less than the total number of student enrolments, potentially contributing to the persistence of lower levels of mathematics competence throughout their degree studies (Lewis, 2019). Lewis (2019) also identified that continued engagement with business statistics is often influenced by students’ negative perception of the subject itself. Such perceptions can also result in “mathematics anxiety” leading to students avoiding classes, learning activities and support mechanisms resulting in limited or nil engagement with the subject.
The interrelationships between technology within the teaching and learning environment has become commonplace within the higher education sector. However, the approach adopted by universities and individuals in respect of learning technologies is inconsistent across the sector thereby limiting the opportunity to determine impact upon the learning and teaching environments (Lewis, 2019).
Video-based learning (VBL)
VBL has been acknowledged as a widely used online learning resource, and has proved to be an effective, dynamic, learning tool (Giannakos et al., 2016; Nagy, 2018). However, VBL has also been identified as offering limited or no effectiveness in supporting teaching and learning due to the limited investment made by Higher Education Institutes (HEIs) coupled with the technical limitations of tutors to develop video-based material in support of their teaching and learning environment (Lewis, 2019).
Whilst a range of freely available online learning videos through the Internet exist and are accessible, many are not suitable for higher education often as a consequence of their generic nature and limitation in respect of achieving prescribed learning outcomes of those programmes or courses designed by individual HEIs. Additionally, the development of learning platforms, their content and academic rigour must be in line with the quality standards requirements as prescribed by the Office for Students (Lewis, 2019; OfS, 2022). A significant opportunity exists therefore to further investigate those characteristics of VBL that can enhance student engagement and improve academic performance of students engaging with mathematical subjects within HE business studies courses. It should be noted that to support learners’ engagement and achievement, a range of features are required to create effective educational video applications. In acknowledging such requirements, it is recognised that the efficacy of VBL often requires educators to create their own videos to fit the specific purpose of their learning activities and desired academic outcomes (Wang and Antonenko, 2017; Lewis, 2019).
A review of the literature undertaken as part of a doctoral thesis entitled Pedagogy through technology: investigating different technology approaches to the pedagogic environment of undergraduate education (Lewis, 2019) has revealed a number of gaps in knowledge, specifically the effective application of video-based learning to mathematics/statistics within a university business school learning environment.
Given this background, this paper seeks to answer the research questions as following:
-
To what extent has video-based technology enhanced the achievements of first-year undergraduate students undertaking a compulsory Business Statistics module?
-
How the utilisation of the VBL application was developed overtime through Business Statistics module within the university setting.
-
How the VBL application raises the attainment and achievement of students in the statistics subject area.
Methods
Data collection
This research initially presented as part of a doctoral thesis by Lewis (2019) centres upon first-year undergraduate students within a Business School of a modern UK university located within the Southeast of England. Published entry requirements to undergraduate business programmes have remained consistent during the period of the study and as such require applicants to achieve:
-
An entry threshold of 96 UCAS points (equivalent to three A level grade C in any subjects) or equivalent academic qualifications combine with two to three GCSE grade C including English Language and Maths (either Foundation Maths or Higher Maths) or equivalent academic qualifications. These admissions criteria therefore highlight a wide spectrum of expectations of students’ abilities in mathematics/statistics reflecting the fact that many students do not encounter mathematics/statistics after compulsory education, therefore, creating a 2 years period with potentially nil or limited mathematics/statistics experience.
-
Applicants from mature students and applicants offering other qualifications are considered on an individual basis
The module examined within this research is “Business Statistics” a compulsory module for all first-year undergraduate students on all Business based courses (~350–400 students per each academic year). The Business School employs no restrictions in terms of pre-requisites, co-requisites or exemptions on the basis of prior learning for this module. The structure of the Business School enables students to study the same qualifications at different campus locations. Once a location of study has been assigned through the university admissions process, this location is designated as the student’s home campus and for the purposes of all learning activities the student’s cohort. Within this study (initially presented by Lewis, 2019), students were identified as two separate cohorts; each cohort being taught at different campus locations (Location A and Location B). Throughout this study the module was managed by the same module leader, who in turn assures that all tutors are fully aware of module learning outcomes and teaching expectations. The module structure, curriculum, assessment strategy, learning and teaching materials for this module have remained constant over the period of the data analysis (11 years from academic year 2006/7–2016/17) at both locations. Students at both locations received the same classroom instructions, learning and teaching materials, plus examples of summative assessments including instructions sheets for Microsoft Excel, seminar questions and mock exam papers for both elements. All students (irrespective of location) are required to undertake the same assessments, which are identical in structure, questions and duration.
Historical datasets from academic years 2006/7 to 2012/13 were collected to investigate student achievement prior to the inclusion of VBL, datasets collected from academic year 2013/14, to 2016/17 supported the investigation of student achievement after exposure to VBL.
Throughout the primary data gathering exercises (undertaken as part of a doctoral thesis by Lewis, 2019) student consent was requested as required by the ethics approval process of the University. As such, students were aware of their participation in a programme of research. The mechanisms by which feedback on student perceptions of the VBL (questionnaire and semi-structured interview) are commonly employed across the UK Higher Education sector to gauge effectiveness of learning and teaching methods and so the gathering of data as part of this research study would not be considered by students to be unusual and therefore limits the opportunity for bias within received feedback.
Video-based learning context
The structure of the module involves direct engagement between tutors and students. Each teaching session was designed to build up knowledge and skills for the next and future sessions. Each week (total of 12 weeks) includes:
-
One-hour formal lecture. The lecture provides, on a weekly basis, an environment where new subject material is introduced and in turn, builds upon subject areas introduced in previous weeks. The lecture series begins with a rudimentary examination of forms of data, data compilation and finally ordering data into meaningful sets for further interpretation; subject complexity and the complexity of statistical techniques increase throughout the duration of the module. Tutors demonstrate the underlying principles of calculation and application to the business setting. No assumptions of competence within the student population are made. Subject topics include: Data Presentations, Frequency Distributions, Measures of Central Location, Measures of Dispersion, Investment Appraisal, Simple Linear Regression, Additive Forecasting, Normal Distribution, Hypothesis Testing (T-test, Z-test and Chi-squared test)
-
One-hour seminar where students undertake data analysis and resolution of statistical problems through the use of scientific calculators.
-
One-hour computer workshop. During computer workshops students were presented with a series of step-by-step instructions in order to complete tasks relating to specific syllabus topics. Each workshop therefore provides opportunities to apply data techniques to business situations and to gain experience in solving problem scenarios. Proficiency in the use of software to resolve statistical problems would be tested under examination conditions at the end of the module thereby contributing to the overall grade awarded for the module.
-
Students were expected to spend at least 114 h of study outside the classroom environment using learning resources provided by module leader.
At the end of week 12, students were expected to use their knowledge to select statistical methods, perform calculations and interpret results in response to questions within a formal examination setting. Two element assessments (computer-based examination (COM) and desk-based examination (MCQ)), each of weighting 50%, were required to pass the module. The MCQ element consists of a multiple-choice examination requiring use of statistical tables and scientific calculator. Within the COM element, students were required to select 3 out of 5 main questions to examine, analyse and interpret raw data through the use of Microsoft Excel. Each main assessment question requires different statistical treatments to answer sub-questions. To achieve high marks in COM, students must be able to:
-
(1)
Apply the correct quantitative method to each selected question using appropriate raw data.
-
(2)
Demonstrate analytical skills through the use of Excel formulae and graphical representations where applicable.
-
(3)
Explain how these results achieved (through analysis) within the questions can be applied to business activities and to better inform business decision making.
Whilst overall success in the module is not dependent upon the computer-based examination, it was identified through historical data (academic achievement results) that for many, the challenge of applying knowledge gained in the classroom under time constrained conditions represented a significant barrier to overall success in this module. The module structure, curriculum, assessment strategy, learning and teaching materials for this module have remained constant over the period of the data analysis (11 years from academic year 2006/7–2016/17) at both locations.
A review of longitudinal, historic data relating to student achievement within the module (assessment results) during the time period of academic years 2006/07 to 2012/13 (Fig. 1) indicates that the achievement of students within the computer-based assessment (COM) in comparison to the multiple-choice-based assessment (MCQ) demonstrates an average difference of ≈20 ± 11%; the maximum difference was as high as 31%. Whilst it can be identified that all students had access to relevant lecture notes, textbooks and static online resources, students struggled to demonstrate proficiency in the application of underlying principles during a time constrained, skills-based assessment. Therefore, there is a need for the mechanisms to support student achievement in this skills-based assessment to improve the overall achievement in the module. Overall failure rate between academic year 2006/2007 to 2012/13 urged the adaptation of new way of learning and teaching business statistics; almost 40% of students failed the COM element in academic year 2012/13.

Results from analysis of student failure rates for computational assessment.
In academic year 2013/14 the video-based learning support approach was introduced as a pilot study to students in location A (experimental group) whilst no VBL was introduced to students in location B (control group). The total population of students for both location A and B was 350 students. The purpose of this study was therefore, to identify potential relationships between video learning opportunities through the VBL approach and subsequent student achievement within summative assessments. Data outputs from this initial experiment were analysed in respect of the existing historic achievement records of students undertaking this module, consideration was given only to the first sitting of any examination (re-sit results were not included).
A set of twenty bespoke videos were developed specifically to test whether a VBL approach helps improve students’ assessment outcomes. Each video was itself an integral part of the learning and teaching materials experienced by students during weekly classes and tutorials. Video content aligns exactly with instruction sheets provided for computer-based classes and mock exam papers for the COM assessment element. Five videos were also created to offer specific support to students undertaking examination (mock examination videos); each mock examination video demonstrated the methodological approach to be adopted in answering examination questions. During this pilot study, videos were accessible only to students at location A and were available through the module’s Virtual Learning Environment (VLE). Students at location A were taught by the module leader who is responsible for the creation of the videos, whilst students at location B were taught by other members of the module delivery team. This study aimed to establish whether or not a demonstrable improvement could be achieved by using VBL with discrete student groups. All videos were created and uploaded on the university’s server as an aid to students’ learning during weekly computer workshops and as revision aids for the COM examination. These videos were designed following the approach detailed below:
-
1.
Step-by-step instructions for completion of tasks provided to students
-
2.
Illustration of the tasks and their relationship to class contents
-
3.
Provision of concise explanations and appropriate narrative underpinning the video content
-
4.
Maintenance of logical structure within video to promote continue engagement
-
5.
Time constraint overall duration of video was limited to 15 min or less.
“Figure 2” indicates the VBL implementation timeline, the experimental year began (location A only) in academic year 2013/14 (students at Location A were identified as the experimental group whilst students at location B were identified as the control group). From academic year 2014/15 VBL resources and support became wholly integrated into the module curriculum at both locations A and B.

Stages of introduction and integration of Video Based Learning into the taught curriculum.
All primary and secondary data gathered and utilised within this study was treated as anonymous. These data included students’ achievement marks (COM & MCQ marks), quantitative and qualitative data from an online questionnaire and individual semi-structured interviews. The design of the online questionnaire permitted self-completion and was administered to students at both locations (A and B) during the academic years 2015/16 and 2016/17.
Statistical analyses
In this study (initially presented within a doctoral thesis by Lewis, 2019) we used descriptive statistics to describe the data analysed. Inferential statistics were employed to make comparisons between the two selected independent student groups; Independent sample T-Test (T) is used for data that are normally distributed and Mann–Whitney U-Test (U) is used for non-normal data. Effect size Eta Squared (ES) was also used to detect effect size between the two groups. Correlation tests were utilised to describe the characteristics and understanding the casual relationships between variables of the samples (Bordens and Abbott, 2018). To visualise research findings, graphical methods such as tables, graphs, charts, diagrams and models are employed.
Results and discussion
Data within Table 1 presents descriptive statistics in terms of the Mean and Median marks achieved by students at Location A and Location B.
-
A Normality test was applied to the student achievement data (Table 1) to determine whether or not the data was normally or non-normally distributed; this in turn, enabled an identification of whether parametric or non-parametric statistical methods would be applied. T/U represents the mean comparison test (T-test is used for normal distribution and U is used for non-parametric test) between both campuses within the same academic year. Results indicate as follows:
-
Academic year 2012/2013 (Table 1) was the year before the experiment year, the data demonstrated no significant of the mean marks between location A and B. This indicated that data are normally distributed and there is no significant difference between students’ achievement in COM mark between both locations.
-
During the experiment year in academic year 2013/14, assessment results achieved by students at location A (experimental group) showed a significant improvement in respect of previous years (as measured by Mean and Median values) demonstrating a significant higher level of achievement when compared to the profiles of students at location B (control group). It is noted that the mean value increased by 8% and the median value increased by 11% when compared to the previous year. The mean comparisons (U-test) further confirm a significant difference in assessment marks when student profiles at location A and B are compared. The additional U-test for the COM assessment marks at location A confirmed that assessment profiles prior to and after the implementation of the VBL are not normally distributed and therefore confirm significant differences in achievement after the introduction of the VBL (U = 6875, p = 0.021).
-
Students at location B in academic year 2014/15 (after implementation of VBL) achieved higher marks than students in academic year 2013/14 (before implementing VBL) in respect of the average and median mark profile (the mean and median marks were increased by 6%). Additional mean comparison U tests in the COM assessment mark at Location B prior to and after the implementation of the VBL confirmed the changes in student assessment profile; demonstrate a significant difference (U = 23219.5, p = 0.023).
-
The overall achievement profile of students at location A continued to improve in subsequent academic years, whilst at location B there was also a significantly increase in achievement from academic year 2014/15 (after implementing VBL).
-
After implementation of VBL (academic year 2014/15), the means comparison (U-test) between students at both locations in academic year 2014/15 and 2015/16 were significantly different.
-
The significant increase in the arithmetic mean mark at Location B between academic years 2014/15 and 2015/16 (57% in 2014/15 to 67% in 2015/16) is as a result of a higher proportion of students achieving marks significantly above the threshold for a First Class (>=70%), which in turn directly impacts upon the mean mark for the cohort.
-
There was no significant difference in the marks profile of students between both Location A and B in 2016/17. The decrease in the mean value of achievement for Group A during 2016/17 (Figs. 3 and 4) is explained as a result of a decline in the number of visits to the VLE, resulting in an increase of student assessment outcomes within the lower achieving grades of C, D or F (Failure).
Fig. 3: Percentage of students’ achieved grades for COM & MCQ assessments for academic years 2013/14 to 2016/17. 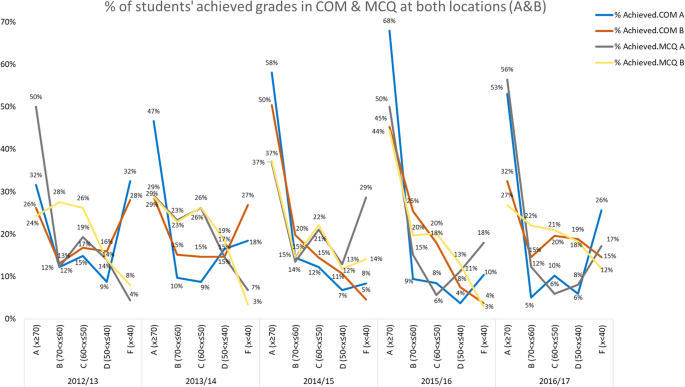
Note: “% Achieved” in Figure represents the proportion of students’ achievements within each grade in each element (COM and MCQ) at each location (A and B). Academic year 2013/14 served as a pilot study in which Location A engaged with the VBL (experimental group) and Location B acted as a control group with no VBL engagement. “Good degrees” are represented by 2:1 and First-Class honours where First Class is represented as A whilst 2:1 represented as B.
Fig. 4: Engagement VLE and assessment outcome (2013–2017). 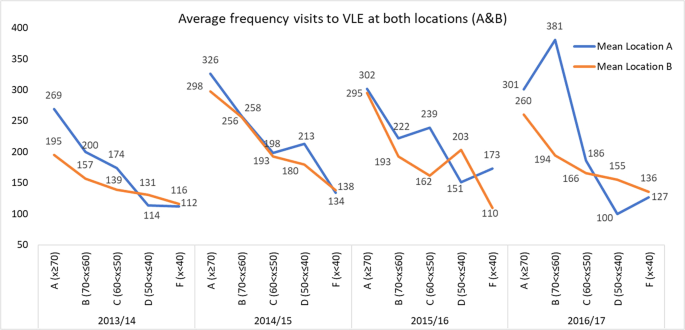
Results from an analysis of average learner engagement with VLE as related to assessment achievement.
-
Overall, the data in Table 1 indicates a continual improvement of students’ achievements in the COM assessment at both campus locations.


Results from Table 1 therefore indicate ongoing assessment success by students after the implementation of VBL, which are typified by consistent increases in marks achieved by students at location A. Student marks at location B also demonstrated a significant and sustained increase after the introduction of the VBL approach. From the data observations it is possible to report that the utilisation of VBL made a significant contribution to students’ overall learning and relevant academic achievement.
The same data from Table 1 was used to created detailed comparison between grades in Fig. 3 and the average frequency of visits to virtual Learning platform related to grades achieved by students in Fig. 4. The descriptive statistics presented in Fig. 3 itself illustrates the accompanying improvement in the percentage of students gaining outcomes commensurate with “good degrees” (2:1 represented as B and First represented A) as a consequence of the introduction of VBL. The improvement in good degrees at location B can, in part, be explained as a consequence of those students wishing to not merely pass the module but gain overall improvement in their academic performance.
Figure 4 highlights the relationship between student’s marks and frequency data. Location A engaged with the VBL (experimental group) and Location B acted as a control group with no VBL engagement. The frequency of visits to VLE highlighted that the VBL was useful to the experimental group especially in raising student achievements in the grade A band (academic year 2013/14). The overall results from Figs. 3 and 4 can be summarised as below:
-
Academic year 2013/14 (the experimental year):
-
o
Approx. 47% of students within the experimental group achieved grade A in COM (62% higher than the control group) with ~38% higher in visits to VLE when compared to the control group. The number of students in the experimental group that achieved grade A in COM was ~62% higher than the number of students that achieved MCQ.
-
o
The number of students that achieved grade F in COM (x < 40) within the control group was 50% higher than the experimental group, whilst the number visits to VLE for both groups were not different; this suggested that VBL might be helpful to the control group.
-
o
-
The data from academic year 2014/15 onwards indicates that the frequency of visits by students to the VLE at Location B is higher than the number of visits recorded during the experimental year (2013/2014). This itself serves to highlight the inclusion of videos is raising interests in the learning resources available through the VLE.
-
The frequency in the number visits to the VLE platform increased in both location A and B, however, the number of visits to the VLE at Location A were higher than Location B.
-
Examination of the achievement data (Figs. 3 and 4 above) indicates that amongst those students in the lower achievement range (C-F) the number of student visits to the VLE has reduced significantly (Mean percentage decrease number of VLE engagement between academic year 2015/16 and 2016/17 = 28%). A significant proportion 26% of those in the lower achievement bracket failed the COM assessment (Fig. 3), which has in turn distorted the overall achievement profile of the cohort at location A for academic year 2016/17.
-
The results of students that achieved grade A were much higher than during the time in which the VBL was not implemented.
Data gathered and analysed within Figs. 3 and 4 highlights that VBL engagement amongst student learners leads to a demonstration of enhanced student competence within the subject areas when assessed through formal examination conditions.
To build upon historic data (as presented in Table 1, Figs. 3 & 4) additional, contemporary data was gathered from students via an online questionnaire and semi-structured interview during academic years 2015/16 and 2016/17. Students from both locations (A and B) were invited to participate in an online questionnaire survey. The total of students for each academic year (2015/16 and 2016/17) was 350 students. The required number of responses to achieve statistical significance for the online questionnaire from students at both locations (A and B) as per academic year (with 95% confidence and 10% margin error) was 78. Responses to the questionnaire for both academic years under consideration were above this threshold. Figure 5 indicates that in academic year 2015/16, 35% of the population responded to the survey (N = 335, n = 117) whilst in academic year 2016/17 indicates 23% of population responded to the survey (N = 352, n = 80)

Results from an analysis of the response rates by learners to an online questionnaire.
Questionnaire responses demonstrate students were less engaged with more traditional learning support resources (books and eBooks) in comparison to the virtual learning environment developed and implemented by the tutor (Fig. 6).

An analysis of learners expressed preferences in respect of the form and source of learner support materials.
Results (initially presented within a doctoral thesis by Lewis, 2019) indicate that ~97% of students used the virtual learning environment (VLE) in their learning and ~90% of students used videos (VBL) to support them to gain proficiency in the practical element of the module. Students also provided qualitative feedback (Supplementary Appendix A and B) in respect of their preferences of learning support, which highlights the role of continued engagement with the tutor as part of the learning process and as an integral part of the overall learner experience. It appears that although both VLE and VBL offer a degree of autonomy in learning, many students value a direct or indirect relationship with the tutor who is ultimately recognised as central in the support of their learning and in turn their overall achievement. Verbatim quotes (Supplementary Appendix B), indicate that a number of features of the VBL are of significant importance to students. Such responses relate to:
-
(1)
access, availability and ease of use
-
(2)
pace of learning, video content and navigational structure
-
(3)
video integrated in lessons
It is noted that student engagement with the videos (by their own choice) occurred at different times, locations and devices depending upon each individual’s preferences. Relationships between the student and video support are summarised thus:
-
The quotation: “It’s private, if you do it wrong no one knows!” may serve to indicate that the opportunity for the student to take a degree of personalised ownership for their learning through the video will, in turn, help reduced intimidation with subject matter.
-
The step-by-step instructions were most often quoted within the responses as a positive feature of the videos. This indicates that students prefer simplicity in respect of the task and contents portrayed within the video which they can then follow. A clear example of this is the ability to “rewind” the videos, enabling students to gain confidence before moving to the next aspect of the lesson content.
-
The duration of the video was also quoted as a positive feature and highlighted that a single video’s duration should be no longer than 15 min. Limiting the overall length of the video to 15 min or less was reported as enhancing acceptability of the video encounter and increased student enjoyment of the experience of working with a “step-by-step” instructional video.
-
It was further reported that the inclusion of vocal instructions made by the course tutor also represented a positive addition to the video environment. It helped to reinforce the relevance of the video to the student whilst providing a degree of familiarity as the tutor (and therefore the voice) is known to the student.
-
The videos also supported student confidence to follow and replicate the tasks, reinforcing their ability to undertake the formal assessment for the module.
The Spearman’s Rho correlation matrix (Table 2) also indicates that the VLE and video-based learning resources were significantly and positively correlated. We therefore conclude that:
-
Students that used the VLE also used videos as learning support. The VLE itself acts as a portal providing access to the videos. All learning resources (including all lesson/tutorial materials) provided to students by the module leaders were located via VLE. Within the VLE videos and learning materials are intertwined thereby enabling the learner to identify the relevance between the classroom materials and videos.
-
Students that used VLE and videos had significantly less reliance and engagement on traditional textbook resources; the results were negatively correlated between “VLE and Book” and “Video and Book”. Students mostly relied on tutor resources rather than a prescribed textbook.
-
Students that preferred a physical, “hard copy” text appeared to be less interested in technology-based resources such as eBooks, VLE, videos and game learning platforms
Figure 7 indicates the number of video views in the academic years 2014/15, 2015/16 and 2016/17 and the number of views for the first question of the mock exam paper for the computer-based element “Mock examinationQ1” was the most viewed video clip within the university’s website.

Results from an analysis of the learner viewing frequency of videos during curriculum delivery and assessment.
The popularity of the video clips for the mock examinations was such that the most watched video clips on the University website were videos related to the mock examination questions. The repeating views of the video by students indicate their willingness to adopt this approach as part of their preparatory studies for assessment. The average view for the Mock examQ1 was ~2000 views (for a cohort of 350 students) per academic year indicating students watched the video repeatedly as part of their revision. We can conclude that students are demonstrating a preference and therefore engagement with videos that are directly related to their assessments.
Conclusion
Our study (undertaken as part of a doctoral thesis by Lewis, 2019) proves that the application of video-based learning is an effective approach in enhancing students’ learning experiences and in turn, their overall achievement within formal assessment conditions. However, the integration of the VBL in the learners’ study activities must be truly reflective of the initial (classroom) learning experience and not used only as a substitute for tutor led engagement. It is acknowledged that the cohorts participating in this study are at the initial stage of their higher education journey and are to an extent reliant upon conspicuous tutor leadership within their pedagogic setting. The introduction of the VBL environment demonstrated a significant overall improvement in the achievement profile of students during skills-based assessments within the business statistics module. Throughout this longitudinal study, it can be identified that a video-based learning approach provides a degree of consistency in respect of successful learning outcomes for students in different cohorts.
A key conclusion after evaluating the use of the VBL is that it is a significant tool for supporting student engagement and interaction within the subject area. The VBL empowers students that are intimidated by mathematics-based subjects. We identified that both accessibility and repeatability of VBL are remarkable in their contribution to increased student ownership of their learning process. Such ownership of learning overcomes the limitations of a classroom- bound environment to one in which students themselves are able to determine when, where and how they engage with their learning.
The inclusion of VBL in the learning “diet” requires an approach in which relevant video content and skills are integrated into the curriculum. This approach promotes an understanding amongst students of the role of VBL within both the classroom setting and personal learning time whilst encouraging the tutor to pay attention to details such as structure, duration and the ease of navigation during video creation.
We can conclude that it is simply not sufficient to create video content and host it on a virtual learning environment for the students to find; there is an onus on the tutor to ensure that VBL resources are actively promoted and linked to both learning and assessment. Consideration must be given as to how the VBL environment can reassure the student that the time spent with the VBL will add value to their learner experience and not simply add additional “learning overhead”. Enhancement of student engagement with the subject area and ultimately achievement within assessment conditions is directly attributable to the creation and delivery of a functioning VBL environment. Such an environment has its greatest impact when it is both unconditionally accessible and sufficiently flexible to accommodate learner needs. This in turn will enhance subject knowledge through repetition and reinforcement of the subject area whilst at the same time promoting personalised experiential learning.
Limitation of this study
Whilst there is significant evidence provided within this study to support the benefits gained from the use of a video-based learning approach as part of a taught curriculum it is acknowledged that there are limitations within this study. A primary limitation is that the data capture and analysis has not conclusively established a defining link between student achievement in the statistics module and individual student profiles at the point of application. It is therefore not possible to eliminate fully the possibility that those students that had studied mathematics/statistics at further education (A Level) achieved a better grade in the module on the basis of prior knowledge.
A further limitation is that it is not possible to determine the identity of the individual student and therefore, not possible to identify the number of repeat views of video material, the overall time spent watching videos and the overall level of achievement in the assessments. Had this approach been possible, it would have enabled the researcher to determine the average number of repeated view activities necessary to initiate the success point (mark equal to or more than 40), additionally, the determination of the average repeated activities that relate to the range of marks.
The anonymity of responses to the questionnaire survey is in itself limiting as this removes the potential of linking each online questionnaire response to an individual student’s assessment profile (activities through VBL) and subsequent assessment achievement. Whilst acknowledging the need to maintain anonymity as part of the experimental design the identification of individual respondents would have enabled greater examination of the student learning characteristics, the influence learning preferences, assessment performance and ultimately student achievement.
Data availability
Quantitative dataset is not publicly available due to privacy reason; however, some qualitative datasets are available in the appendix section.
References
Bordens KS, Abbott BB (2018) Research design and methods: a process approach, 10th edn. McGrawHill Education, New York
Croft T, Grove M, Lawson D (2016) The oversight of mathematics, statistics and numeracy support provision at university level-A guide for Pro-Vice-Chancellors. Sigma Network, http://www.sigma-network.ac.uk/wp-content/uploads/2016/10/66141-Senior-Management-Handbook-AWK-WEB.pdf
Darlington E, Bowyer J (2016) Accounting for students’ mathematical preparedness for Finance and Business degrees Res Matter: Camb Assess Publ 22:9–16. http://www.cambridgeassessment.org.uk/Images/374624-accounting-for-students-mathematical-preparedness-for-finance-and-business-degrees.pdf
Davies S, Mullan J, Feldman P (2017) Rebooting learning for the digital age: What next for technology-enhanced higher education? (Report No. HEPI Report 93). Higher Education Policy Institute (HEPI). https://www.hepi.ac.uk/wp-content/uploads/2017/02/Hepi_Rebooting-learning-for-the-digital-age-Report-93-20_01_17Web.pdf Accessed 15 Oct 2017
Giannakos M, Krogstie J, Aalberg T (2016) Video-based learning ecosystem to support active learning: application to an introductory computer science course. Smart Learn Environ 3(1):1–13. https://doi.org/10.1186/s40561-016-0036-0
Hussein Z (2017) Leading to Intention: The Role of Attitude in Relation to Technology Acceptance Model in E-Learning. Proced Comput Sci 105:159–164. https://doi.org/10.1016/j.procs.2017.01.196
Lee S (2016) Understanding the UK Mathematics Curriculum Pre-Higher Education, A Guide for Academic Members of Staff 2016 Edition. Mathematics Education Innovation (MEI). http://mei.org.uk/files/pdf/pre-university-maths-guide-2016.pdf Accessed 29 Jan 2017
Lewis N (2019) Pedagogy through technology: investigating different technology approaches to the pedagogic environment of undergraduate education. https://arro.anglia.ac.uk/id/eprint/705531/
McAlinden MT, Noyes A (2019) Mathematics in the disciplines at the transition to university. Teaching mathematics and its applications. Int J IMA 38:61–73. https://doi.org/10.1093/teamat/hry004
Nagy JT (2018) Evaluation of online video usage and learning satisfaction: an extension of the technology acceptance model. Int Rev Res Open Distrib Learn 19 (1). https://doi.org/10.19173/irrodl.v19i1.2886
Ofcom (2017) Adults’ media use attitudes. Ofcom https://www.ofcom.org.uk/__data/assets/pdf_file/0020/102755/adults-media-use-attitudes-2017.pdf Accessed 9 Nov 2017
Office for Students (2022) How we regulate quality and standards https://www.officeforstudents.org.uk/advice-and-guidance/quality-and-standards/how-we-regulate-quality-and-standards/ Accessed 25 Jun 2022
Office of Education Technology (2017) Re-imagining the Role of Technology in Higher Education. Available through: Office of Educational Technology (tech.ed.gov) https://tech.ed.gov/files/2017/01/Higher-Ed-NETP.pdf Accessed 9 Nov 2017
Wang J, Antonenko PD (2017) Instructor presence in instructional video: effects on visual attention, recall, and perceived learning. Comput Hum Behav 71:79–89. https://doi.org/10.1016/j.chb.2017.01.049
Acknowledgements
A number of background references and source materials contained within the doctoral thesis entitled Pedagogy through technology: investigating different technology approaches to the pedagogic environment of undergraduate education by Lewis (2019) have been utilised in the development of this article.
Author information
Authors and Affiliations
Contributions
Highlighting a clear mandate for the role of VBL in supplementing tutor led learning. Recognising the impact of video resources when they are designed, developed and created in a manner, which creates explicit links between videos themselves and the taught sessions to which they relate. Acknowledging that videos created by tutors are of greatest relevance to students and provide a degree of contextualisation that cannot be established through third party providers or those in the public domain. Identifying that the construction of videos requires careful planning to ensure the videos are accessible, of limited time duration and convey an explicit learning purpose. Demonstrating that videos must be readily accessible to students throughout the duration of their studies as they act as not only a reference point but a student’s learning archive.
Corresponding author
Ethics declarations
Competing interests
The authors declare no competing interests.
Consent to publish
I give consent for this manuscript to be published and can confirm that the contents of this manuscript have not been previously published.
Ethical approval
Ethical approval was obtained from the ethics committee of Anglia Ruskin University. The procedures used in this study adhere to the tenets of the Declaration of Helsinki.
Informed consent
Informed consent was obtained from all participants. All qualitative and quantitative data have been anonymised. Raw data was kept private and confidential and destroyed after it has been analysed.
Additional information
Publisher’s note Springer Nature remains neutral with regard to jurisdictional claims in published maps and institutional affiliations.
Supplementary information
Rights and permissions
Open Access This article is licensed under a Creative Commons Attribution 4.0 International License, which permits use, sharing, adaptation, distribution and reproduction in any medium or format, as long as you give appropriate credit to the original author(s) and the source, provide a link to the Creative Commons license, and indicate if changes were made. The images or other third party material in this article are included in the article’s Creative Commons license, unless indicated otherwise in a credit line to the material. If material is not included in the article’s Creative Commons license and your intended use is not permitted by statutory regulation or exceeds the permitted use, you will need to obtain permission directly from the copyright holder. To view a copy of this license, visit http://creativecommons.org/licenses/by/4.0/.
About this article

Cite this article
Lewis, N., Lewis, R. & Luca, C. Impact of video-based learning in business statistics: a longitudinal study. Humanit Soc Sci Commun 10, 146 (2023). https://doi.org/10.1057/s41599-023-01634-w
Received:
Accepted:
Published:
DOI: https://doi.org/10.1057/s41599-023-01634-w
