Abstract
The digitization of music has changed how we consume, produce, and distribute music. In this paper, we explore the effects of digitization and streaming on the globalization of popular music. While some argue that digitization has led to more diverse cultural markets, others consider that the increasing accessibility to international music would result in a globalized market where a few artists garner all the attention. We tackle this debate by looking at how cross-country diversity in music charts has evolved over 4 years in 39 countries. We analyze two large-scale datasets from Spotify, the most popular streaming platform at the moment, and iTunes, one of the pioneers in digital music distribution. Our analysis reveals an upward trend in music consumption diversity that started in 2017 and spans across platforms. There are now significantly more songs, artists, and record labels populating the top charts than just a few years ago, making national charts more diverse from a global perspective. Furthermore, this process started at the peaks of countries’ charts, where diversity increased at a faster pace than at their bases. We characterize these changes as a process of Cultural Divergence, in which countries are increasingly distinct in terms of the music populating their music charts.
Introduction
Digitization is arguably the biggest change the music market has undergone over the last decades. In 2016, digital sales already accounted for more than half of the revenues of the music industry (Coelho and Mendes, 2019). There are innumerable aspects on which digitization has impacted how we listen, produce, and commercialize music. For example, digital music is distributed at a null marginal cost, meaning that digital audio can be reproduced ad infinitum without an extra cost on the side of the record label. For the consumer, streaming has had homologous effects. In streaming platforms, listening to new music does not carry an extra monetary cost, as a listener only pays a flat monthly fee to subscribe to a platform like SpotifyFootnote 1. This way, time and search costs are the only ones remaining in the way of music exploration. On the distribution side, online catalogs of music are orders of magnitude larger than those of physical stores due to the lack of space constraints, making a more diverse offer of music (Anderson, 2006). There is evidence that the increased availability of music has been accompanied by an enhanced diversity and quantity of music consumption (Datta et al., 2018). In this paper, we explore the evolution of global diversity in the past years and find a clear trend towards global diversity in the music market.
Concerns of Cultural Convergence have been part of the public debate for decades. European governments, in particular, have made attempts to protect national cultural industries either directly (e.g. radio quotas) or indirectly (e.g. subsidizing national film production) (Ferreira and Waldfogel, 2010; Waldfogel, 2018). Because digitization granted easier access to imported goods, predictions were that national cultural products were doomed, especially in smaller countries. Nonetheless, scientific research has not yet provided a definitive answer to whether this fear was well-grounded or not. There is evidence that digitization might have accelerated cultural convergence across countries in popular music (Gomez-Herrera et al., 2014; Verboord and Brandellero, 2018) while others find an increasing interest in national artists (Achterberg et al., 2011; Ferreira and Waldfogel, 2010). Discrepancies most likely stem from the inconsistency in the sample of countries included in these studies and the limited granularity of data available. Therefore, the question of whether digitization and streaming are currently propelling cultural convergence is open for debate. For similar cultural products, such as YouTube videos, global convergence is limited by cultural values (Park et al., 2017).
The recent availability of datasets on music consumption across large numbers of countries has provided a way of overcoming some limitations of previous studies. In a recent example, Way and his collaborators, look at Spotify users’ listening behavior and find that “home bias”—the preference towards national artists—is on the rise globally (Way et al., 2020). A source of concern is the possible influence of a platform’s endogenous processes on the behavior of its users. For instance, what appears as an enhanced preference for national artists could be the result of changes in the recommendation algorithm. Alternatively, increased popularity of playlists like the New Music Friday, which are biased towards national artists (Aguiar and Waldfogel, 2018a) could produce a similar effect. Although far from common, major changes in the recommendation system of Spotify happen, the latest one being announced in March of 2019 (Spotify, 2019). As a result, recommendations are now more personalized, which, if the nationality of a user is taken into account, could generate increasing divergence between countries by feeding users with national music. According to Spotify, up to one-fifth of their streams can be attributed to algorithmic recommendations (Anderson et al., 2020), which may be enough to sway macro-level trends in music consumption.
We deal with platform-specific confounders by supplementing our analysis of Spotify data with a dataset from iTunes. It must be noted, however, that changes similarly affecting both platforms may exist, such as the increasing use of recommendation systems or catalog expansions, as well as the mutual influence that would make these observations non-independent. Another caveat of using platform-specific data is the fact that users of such platforms might not be representative of the entire population. Spotify users are disproportionately young and male when compared to their countries’ population (Datta et al., 2018). Furthermore, the composition of users of a platform is in constant change and the timing of adoption correlates with individual listening habits. For instance, in Spotify, late adopters have a stronger preference for local music than those who joined the platform early on (Way et al., 2020). To minimize the impact of these issues, we reduce the sample of countries from the 59 available to 39, keeping those in which Spotify is strongly established. Therefore, we expect the population of users in these countries to be more stable than in recently incorporated ones such as India, in which market penetration is quickly expanding. Additionally, this can be considered as a within-sample comparison (Salganik, 2019), which, given the large user base of Spotify, is of interest in and on itself.
In this paper, we tackle the question of whether digitized music consumption is globalizing or not by looking at the ecology of the national music charts of Spotify and iTunes in the past few years. In other words, by observing the global diversity in the charts we can discern whether popular music is converging or diverging across countries. More diversity across countries would be a sign of Cultural Divergence. On the other hand, a decrease in diversity would be indicative of a process of Cultural Convergence across countries. We utilize the Rao-Stirling measure of diversity and its components (Stirling, 2007) to describe these trends. We find upward trends in the cross-national diversity of songs, artists, and labels, starting in 2017 in Spotify as well as in iTunes and ending in 2020 for Spotify. Popular music is thus diverging across countries in what we define as Cultural Divergence. To complement previous studies, we also look at the diversity of artists and labels and find that these have increased in parallel. Ultimately, this paper describes trends in popular music across a large sample of countries, giving a more clear perspective of the cultural dynamics in the digital era.
Research background
Winner-takes-all
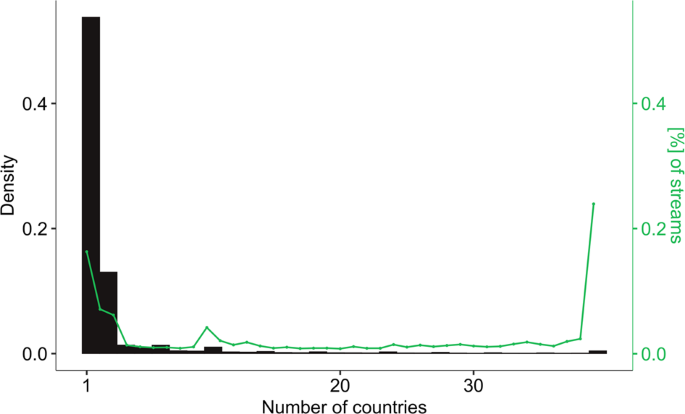
Cultural markets often exhibit a highly skewed distribution of success (e.g. Keuschnigg, 2015, Salganik et al., 2006). In the music market in particular, a few hits expand across the globe while the majority of popular songs only hoard local success (see Fig. 1). Such inequalities are partly due to the scalability of cultural products, a property that refers to the fact that most of their cost is fixed – although this property does not apply to all cultural markets, being the art field an exception – while marginal costs are relatively low. For instance, once a song is recorded or a book is written, the cost of making another copy is insignificant when compared to the initial cost of producing it, measured in time, creativity, or money, making these products scalable to large audiences. As a result, demand is highly concentrated on the best alternatives, even when they are only marginally better than the rest (Rosen, 1981).
Oftentimes this is an oversimplified view, since quality in cultural products is hard to define, and it is perceived (between others) as a function of previous success, thus creating path dependencies in the popularity of cultural products and artists. This process can be viewed as one in which information is accumulated, with consumers relying on it to moderate the quality uncertainty of their selection of cultural products (Giles, 2007). Information is aggregated in the form of consumer reviews, sales rankings, or top charts. In a pathbreaking experimental study, Salganik et al. (2006) found that information on other listener’s musical preferences results in an amplified inequality of popularity when compared to a world of independent listeners. Using social cues in the form of aggregated information might be beneficial for individuals in cultural markets in which preference is a matter of taste, but there are multiple strategies to leverage such information and its fit varies between individuals (Analytis et al., 2018). In the case of artists, during their careers, “small differences in talent become magnified in larger earning differences” (Rosen, 1981). This “superstar effect”—defined as the previous success of an artist—is the most important predictor of the popularity of a song, even when controlling for other factors (Interiano et al., 2018). Thus, the huge inequalities of success stemming from the scalability of cultural products and the social influence mechanisms intervening in their spread allows for the possibility of a few songs and artists to dominate the charts across the globe.
In principle, both scalability, as well as social influence processes, may have gained bearing after digitization and streaming. On the one hand, digitization reduced the marginal costs of music production by eliminating the need to manufacture an album. Some transaction costs for digital music remain, such as copyrights and distributing platform fees, but overall, the barriers for music to flow across countries are substantially lower than in the pre-digital era. On the other hand, information is more abundant than ever before. Users can get near-real-time data on the listening decisions of millions of other users. On Spotify, anyone can search through the Top 50 playlists tailored for every country. Each of them contains the most popular songs on the platform, which are updated daily. These playlists are extremely popular among users, for instance, the Top 50 Global has over 15 million followers. This deluge of information is complemented with second-order feedback effects (Easley and Kleinberg, 2010) such as recommender systems, which might be luring listeners towards the most popular songs. For Spotify, there is evidence that users who rely more heavily on algorithmic recommendations listen to less diverse music and podcasts than those who discover music for themselves (Anderson et al., 2020, Holtz et al., 2020). In short, there are arguments to think that the winner-takes-all effects characteristic of the music market might be gaining bearing under the digital regime, decreasing the diversity and increasing the concentration of the market in the hands of a few hit songs, superstar artists, and major labels.
The long tail
The idea of the long tail, first proposed by Anderson (2004) in a widely circulated press article sustains that online retailing has led to increased diversity in the consumption of music. This happened because online retailers do not have the limitations of shelf space that traditional brick-and-mortar stores have, and so their catalogs can be virtually unlimited in size. The unlimited digital space can be filled with niche products that do not attract huge audiences but, bit by bit, make a difference in terms of profits generated. In the book following his article, Anderson (2006) goes beyond the original argument, suggesting that the Internet has a carrying capacity for cultural products previously unattainable and its impact on cultural markets has been broader than initially expected. Not only the distribution but also the production of cultural goods has thrived as a result of the new technologies for distribution (e.g. online retailers), production (e.g. cheaper software), and consumption (e.g. flat fees). Some have even qualified these changes as a renaissance of cultural markets (Waldfogel, 2018).
More recently, Aguiar and Waldfogel have argued that the idea of the long tail fails to account for the unpredictability of success in cultural markets (Aguiar and Waldfogel, 2018b; Waldfogel, 2017, 2020). When confronted with new artists, for instance, record labels have a scant capacity to assess what will be the success of those artists. Under such uncertainty, producers strive to pick those with better prospects but there will inevitably be miscalculations (e.g. the infamous Decca audition of The Beatles) and artists that were deemed unworthy of being promoted will end up reaping huge success, and the same in the opposite direction. In other words, before digitization, market intermediaries held most of the decision power over which products or artists were worthy of being produced and which ones did not, the inevitable result of which was that some hits were lost. The reduced costs of production and promotion of digital cultural goods have made possible the production of these products. Unlike what the original idea of the long tail proposed, not all of them will be niche products and some will end up achieving unexpected popularity. The same goes for independent record labels, which now have better opportunities to promote their artists even with small budgets. There is evidence that indie artists and labels have gained relevance under the digital music regime (Coelho and Mendes, 2019). For instance, top-selling albums in the US produced by independent labels increased from 12% in 2000 to 35% in 2010 (Waldfogel, 2015).
Waldfogel and Aguiar refer to this phenomenon as the random long tail of music production. The random long tail contains those cultural goods that despite not being attractive to traditional intermediaries can be brought into production and, due to the inherent unpredictability of cultural markets, sometimes reach unexpected success. Accordingly, the more unpredictable a cultural market is, the greater the number of unexpected hits. For instance, the success of songs is more difficult to predict than that of movies, whose box-office earnings heavily depend on the budget and cast of the film (Aguiar and Waldfogel, 2018b). In summary, these studies put forward a vision of the music market in the digital era as more diverse and unpredictable.
Methods and data
Although there are multiple approaches to the study of diversity in social phenomena, Stirling’s (2007) is one of the most influential and widely applied. More importantly, the Rao–Stirling diversity index has already been used to study diversity in music taste, although at a different level of analysis than here (Park et al., 2015; Way et al., 2019). The Rao–Stirling index consists of three components: variety, balance, and disparity.
Variety is a function of the number of distinct units (songs, artists, or labels) in the charts on a given day. The more unique units the more variety there is in the charts. Naturally, in the case of songs variety is bounded by the fact that the same song cannot occupy more than one chart position per country so changes in variety should be interpreted, rather than the absolute size of the indicators (which also applies to the other measures of song diversity). We measure variety as the number of distinct units divided by the total number of chart positions. Balance refers to how evenly distributed the system is across units. Here we measure balance as 1−Gini, a common measure of the inequality of a distribution. In this case, it is the distribution of chart positions across songs, artists, or labels. The more equally distributed positions are the higher the balance in the system. Importantly, balance does not give any information about the number of units in the charts (variety). For instance, label balance would be highest if two labels produce all the songs in the charts with equal shares as well as if every song in the charts was produced by a different label (and there were no songs in more than one chart-country). The disparity is defined not by categories themselves but by the qualities of such categories or elements. In other words, the disparity is a measure of how different the elements of a system are. We define the qualities of a song by its acoustic featuresFootnote 2 and then calculate the euclidean distance between songs. In the case of artists, we define them by the central tendency of the acoustic features of their songs on the charts. The Rao–Stirling index combines variety, balance, and disparity into a single indicator of diversityFootnote 3.
Additionally, we introduce Zeta diversity, a measure from biology. Zeta diversity was developed by Hui and McGeoch (2014) to tackle the issues with pairwise measures of diversity. Aggregated pairwise distance measures are consistently biased (Baselga, 2013) and, when the number of sites (countries) is large, they approximate their upper limit (Hui and McGeoch, 2014). More importantly, Zeta diversity gives a more nuanced view of the interplay between global and local hits. The distribution of the number of countries in which a song reaches the charts is right-skewed, as shown in Fig. 1, meaning that most songs enter the charts of just one or two countries. As a consequence, what aggregated measures such as Rao–Stirling mainly capture is the effect of local hits. The influence of global hits is mostly null in such measures because of their paucity. Zeta diversity, on the other hand, measures distances at multiple orders. For instance, Zeta of order 3 (ζ3) represents the expected number of songs shared by groups of three countries. It is calculated by looking at all possible combinations of three countries and calculating the number of songs that each group shares. Higher orders or Zeta (e.g. songs shared by groups of 10 or more countries) capture the prevalence of more global hits. Here, we characterize Zeta by its central tendency, but other options are possible. As the order of Zeta increases its value decreases monotonically since there are always fewer songs charting in groups of three countries than in groups of two. In short, Zeta diversity gives us a more nuanced view of the distribution of success of songs across the charts compared to other diversity measures.
The data for the study comes from Spotify’s top 200 charts and iTunes’ top 100. We illustrate the analysis focusing on Spotify’s data because of the larger sample of countries (39 vs. 19). The entire list of countries can be found in Supplementary Table S1 online. Because iTunes data could not be retrieved from an official source (instead we obtained it through Kworb.com), the results are reported only as a means of externally validating our main findings. Spotify’s data covers the period from 2017-01-01 to 2020-06-20, iTunes top 100 daily charts for the period 2013-08-14 to 2020-07-16.
Results
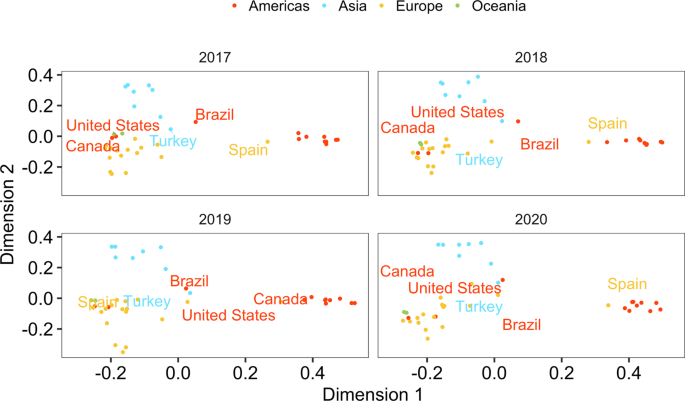
Figure 2 shows distances between countries as a function of the songs shared between their charts within a year. Countries appear geographically clustered. One cluster is formed by Western countries of which Spain is the exception, being part of a different cluster, together with the Latin American countries. The third cluster encapsulates the Asian countries and Brazil. There are some noticeable anomalies, such as the closeness between Turkey and Brazil. Upon closer examination, most of the songs shared between them are produced in the United States. This is likely the result of the small market penetration of Spotify, making for a user base of early adopters more internationally oriented. Alternatively, it could be the result of a small catalog of local music. In any case, the observable consequence is an over-representation of international (and mainly US) hits in both countries’ charts.
Although positions are fairly stable over the years, if anything, clusters of countries seem to consolidate, being these three groups more clearly discernible in 2020 than in 2017. Following Park et al. (2017) we also look at the relationship between countries as a projection of the two-mode network between countries and songs. The modularity of the network indicates the degree to which countries are clustered into modules beyond what would be expected on a random network. Modularity increased consistently from 2017 up to 2020 (see Supplementary Fig. S4) indicating that countries within clusters are becoming more similar in their music charts and, at the same time, drifting away from other clusters. These results are consistent with general notions of cultural, geographical, and linguistic distance which elsewhere have been proved to be the main determinants of music taste similarities between countries (Moore et al., 2014; Pichl et al., 2017; Schedl et al., 2017) although with a few exceptions such as the above-mentioned.
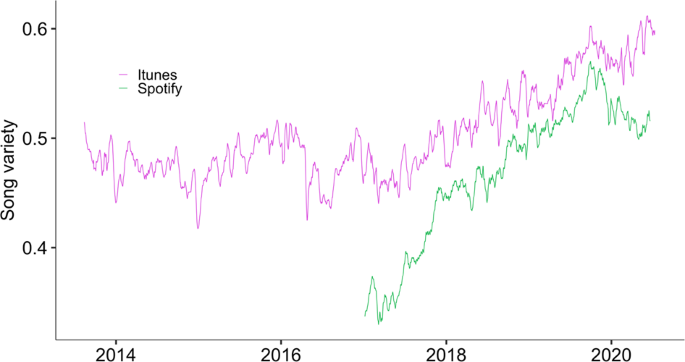
Seen as a whole, the diversity of songs, artists, and labels has increased during this period. Variety has grown not only on Spotify but on iTunes as well (Fig. 3). The resemblance between the two trends is startling, especially if we consider how different these platforms are, one being a streaming platform with growing popularity (Spotify) while the other (iTunes) is a digital music shop whose user base is in decay. The resemblance between the trends points to the external validity of the observations, although there could be some degree of influence between the platforms and thus they cannot be regarded as completely independent observations. The upward tendency in variety starts in 2017 and plateaus at the end of 2019 on Spotify while it keeps increasing in iTunes.
Values range from 0 (same set of songs in every country) to 1 (no overlap between the charts). Calculated for countries in both datasets (16 countries) and the same chart size (100 positions). Time series are calculated with daily frequency and smoothed over a 10-day window. Both Spotify and iTunes display consistent trends of increasing variety over time.
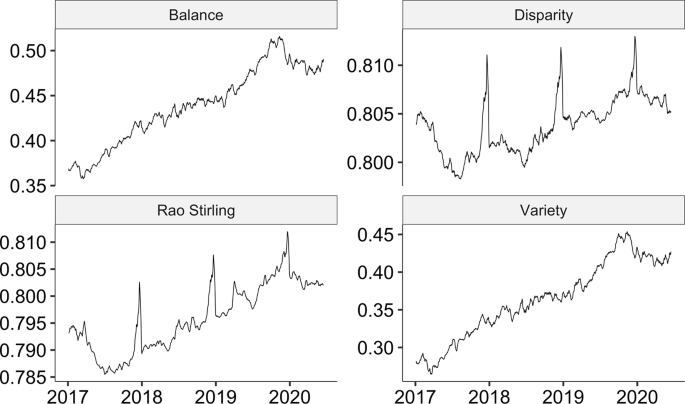
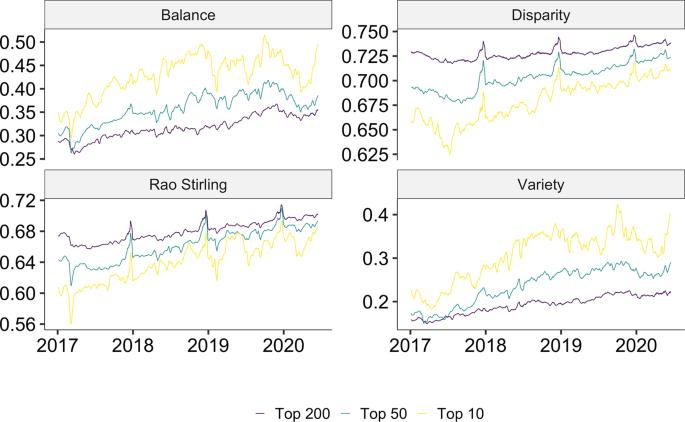
The increase in song diversity can be observed in Fig. 4. Balance, disparity, and variety have all increased during the period. The disparity indicator also shows a strong seasonal burst around Christmas. This is consistent with other findings, suggesting that in countries in the Northern Hemisphere musical intensity declines around Christmas while the opposite is true for the Southern Hemisphere (Park et al., 2019). Overall diversity (Rao–Stirling index) rises from 2017 up to 2020 and then plateaus. Hence, not only there are more distinct songs in the charts (variety) but these are acoustically more dissimilar (disparity) and their distribution over the chart slots is more equal (balance) than at the beginning of the period.
As for songs, the diversity of artists has also grown. However, the trend is distinct at the head of the charts than at the bottom. By slicing charts at certain ranking positions we create a top 10, top 50, and top 200 for each country. When it comes to balance and variety, the increase has been more pronounced at the head of the charts, which already presented a higher level at the beginning of the observed period. However, disparity is lowest within the top 10, indicating that the group of artists with songs on the head of the charts are stylistically more similar than those who just make it to the charts (a group that subsumes the former). What we can derive from these trends is that, while there are proportionally more unique artists at the top of the charts, the music that those artists produce is relatively similar, as if there was an acoustic “recipe” for reaching the peak of the charts. In general, artist diversity as a whole has increased at a similar pace across strata of the charts (Fig. 5c).
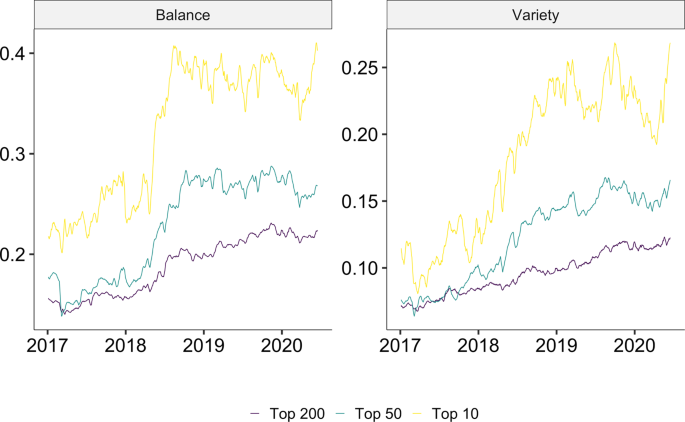
The increasing diversity of songs and artists in the charts has been accompanied by a more equally distributed market for record labels (Fig. 6a). Again, the trend is steeper if we look only at the head of the charts. The number of distinct labels with at least one song in the charts has also increased in a stratified manner (Fig. 6b). In general, labels had on average fewer artists and songs on the charts at the end of the period. While in the first 6 months of 2017 labels had on average 5.88 songs on the charts (and 2.19 artists), for the first half of 2020 it was one less song (and only 1.66 artists). Interestingly, the number of songs that each artist got on the charts has increased slightly, going from 2.67 in 2017 to 2.96 in 2020 (comparing the first half of each year).
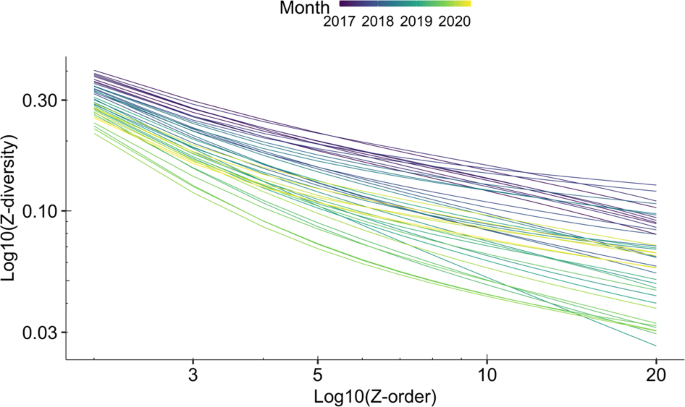
We can take a closer look at the interplay between local and global hits through the Zeta diversity measure. Figure 7 presents the results for monthly Zeta diversity measures of orders 2—which is equivalent to pairwise distances—up to 20—the mean number of common songs shared by groups of 20 countries. We observe that across all orders of Zeta the mean diversity tends to decrease with time (brighter colors) which is consistent with the previous resultsFootnote 4. When we look at the decay of Z-values along orders of Zeta (x-axis) we observe that it gets steeper over time. In other words, the slope of the regression with Z-values (y-axis) as a dependent variable and Z-order (x-axis) as a predictor gets greater with time. Table 1 presents the results of a linear regression model that shows the increase in steepness over time. The substantive interpretation is that global hits have taken the lion’s share of the increase in diversity, becoming an increasingly rare phenomenon.
Discussion
By analyzing 4 years of data of music charts in 39 countries, we find clear evidence of increased diversity in the music charts across countries. In the short period covered by this study, the number of unique songs, artists, and labels on the charts in our sample of countries has grown considerably. Despite the concerns expressed by several governments, particularly in Europe (Waldfogel, 2018, p. 220), popular music is not increasingly globalized. Instead, countries’ popular music was amidst a process of Cultural Divergence that seemed to have come to a halt at the end of the observed period. The increase in diversity seems to be driven by a segmentation of the music market rather than an evenly heightened idiosyncrasy of music consumption. In other words, countries that were already close to one another in taste are becoming more similar but increasingly different from other clusters of countries. Such clusters appear strongly determined, but not only, by geographical and cultural distance. Research shows that regional clusters also differ in the acoustic properties of the music that their populations listen to (Park et al., 2019). Therefore, although diversity is usually taken as a positive trait of a system, the segmentation which is driving the increase in diversity can be a source of concern.
We also show that diversity has been on the rise in terms of artists and record labels. Particularly, the rise of label diversity rules out the possibility that the big labels are producing pop music fitted to different markets, as the proponents of glocalization would argue. As a consequence of these trends, not only songs might be increasingly distinct across countries, but also their production and distribution.
Whether it is the preferences of users or shifts in the production and distribution of music that are driving these changes is not clear. The possibility that Cultural Divergence is the result of a random long tail in music production is more consistent with the pace and ubiquity of these changes than preference-based accounts of the same phenomenon. Therefore, as an alternative to preference-based explanations of the increase in home bias (Way et al., 2020) and global diversity, we propose that these observations could be explained by changes in music production. One first source of concern with the preference-based explanation stems from the speed and ubiquity of the observed changes. Cultural shifts of this scale are generally slow, comparable in speed to the evolution of traits in animal populations (Lambert et al., 2020). Also, there is evidence that changes in the aggregated preferences of a population are mostly driven by generational replacement (Vaisey and Lizardo, 2016). Instead, we argue that field configurations can more rapidly sway macro-patterns by conditioning the opportunities of individuals. In the case of music, the random long tail of music production may have increased the available options of users to express their idiosyncratic preferences, which, being to some extent geographically determined (Ferreira and Waldfogel, 2010; Gomez-Herrera et al., 2014; Way et al., 2020), would likely result in national music charts drifting away from each other.
Methodologically, this research shows the potential of Zeta diversity, a measure devised for the study of biodiversity, to gauge the globalization of cultural products at different levels. Since truly global hits are extremely rare phenomena when compared to songs that reach in small groups of culturally similar countries, they carry very low weight when calculating pairwise distances, which is a common way of looking at cross-national diversity. National charts could drift apart without affecting the likelihood of the eventual hit to spread globally and conventional pairwise measures would not pick this dynamic. As we show, this has not been the case for the music market, in which the positive trend in diversity has been accompanied by a significant decrease in the spread of global hits. The application of Zeta diversity is not without issues, one of them being that its calculation is computationally demanding when compared with the other measures of diversity presented here, because of its combinatorial nature. In return, it offers relatively stable estimates of rare events, a useful feature when studying heavy-tailed distributions in general, and cultural markets in particular, in which global hits are highly unlikely but more consequential in terms of collective attention than the more common local hits. More broadly, our analysis applies mathematical methods from ecology to analyze the consumption of cultural content. This interface between disciplines has other applications, for example, to understand the dynamical reorganization of user activity on social media (Palazzi et al., 2020). Furthermore, our work builds on existing literature utilizing methods from ecology to study musical taste and consumption (Park et al., 2015; Way et al., 2019).
To conclude, our results run counter to the notion of an unbounded market that can be distilled from the idea of globalization. It also challenges the expectations of the winner-takes-all set of theories that predict heightened inequality in the distribution of success under decreased restrictions to global expansion. Instead, the music market has become, in this short period, more hostile to the spread of hits across the globe. From a positive perspective, this means that “national cultures” are not disappearing, although this might come at the expense of a more segmented market in bundles of culturally similar countries, and the risks associated with such segmentation if spread, for instance, from esthetic to normative judgments.
Data availability
Data and code for the analyses are available at https://github.com/PabloBelloDelpon/Spotify_paper.
Notes
Users also have the option to get free access to a limited version of the platform, which is ad-supported.
Spotify measures the acoustic features of each song and groups them into the followingcategories, all of which we include in the analysis: danceability, energy, key, loudness, mode,speechiness, acousticness, instrumentalness, liveness, valence, tempo, and duration.
More precisely, Rao–Stirling is calculated as in Stirling (2007): D = ∑it(i≠j)dij ⋅ pi ⋅ pj, where pi and pj are the proportions of elements i and j in the system and did is the euclidean distance between their respective acoustic representations.
Zeta diversity is measured in the opposite direction than the previous indicators of diversity. Higher values indicate more overlap of songs across charts and smaller values indicate less overlap.
References
Achterberg P, Heilbron J, Houtman D, Aupers S (2011) A cultural globalization of popular music? American, Dutch, French, and German popular music charts (1965 to 2006). Am Behav Sci 55(5):589–608
Aguiar L, Waldfogel J (2018a) Platforms, promotion, and product discovery: Evidence from spotify playlists. JRC digital economy working paper, 2018/04
Aguiar L, Waldfogel J (2018b) Quality predictability and the welfare benefits from new products: evidence from the digitization of recorded music. J Polit Econ. https://doi.org/10.1086/696229
Analytis PP, Barkoczi D, Herzog SM (2018) Social learning strategies for matters of taste. Nat Hum Behav 2(6):415–424
Anderson A, Maystre L, Anderson I, Mehrotra R, Lalmas M (2020) Algorithmic effects on the diversity of consumption on spotify. In: Proceedings of the web conference 2020, Taipei, Taiwan. ACM, pp. 2155–2165
Anderson C (2004) The long tail. Wired. https://www.wired.com/2004/10/tail. Accessed 20 Jul 2021
Anderson C (2006) The long tail: why the future of business is selling less of more. Hachette
Baselga A (2013) Multiple site dissimilarity quantifies compositional heterogeneity among several sites, while average pairwise dissimilarity may be misleading. Ecography 36(2):124–128
Coelho MP, Mendes JZ (2019) Digital music and the death of the long tail. J Bus Res 101:454–460
Datta H, Knox G, Bronnenberg BJ (2018) Changing their tune: how consumers’ adoption of online streaming affects music consumption and discovery. Market Sci 37(1):5–21
Easley D, Kleinberg J (2010) Networks, crowds, and markets: reasoning about a highly connected world. Cambridge University Press
Ferreira F, Waldfogel J (2010) Pop internationalism: has a half century of world music trade displaced local culture? Technical Report w15964. National Bureau of Economic Research, Cambridge
Giles DE (2007) Increasing returns to information in the US popular music industry. Appl Econ Lett 14(5):327–331
Gomez-Herrera E, Martens B, Waldfogel J (2014) What’s going on? Digitization and global music trade patterns since 2006. SSRN Scholarly Paper ID 2535803. Social Science Research Network, Rochester
Holtz D, Carterette B, Chandar P, Nazari Z, Cramer H, Aral S (2020) The engagement-diversity connection: evidence from a field experiment on spotify. SSRN Scholarly Paper ID 3555927, Social Science Research Network, Rochester, NY
Hui C, McGeoch MA (2014) Zeta diversity as a concept and metric that unifies incidence-based biodiversity patterns. Am Nat 184(5):684–694
Interiano M, Kazemi K, Wang L, Yang J, Yu Z, Komarova NL (2018) Musical trends and predictability of success in contemporary songs in and out of the top charts. R Soc Open Sci 5(5):171274
Keuschnigg M (2015) Product success in cultural markets: the mediating role of familiarity, peers, and experts. Poetics 51:17–36
Lambert B, Kontonatsios G, Mauch M, Kokkoris T, Jockers M, Ananiadou S, Leroi AM (2020) The pace of modern culture. Nat Hum Behav 4(4):352–360
Moore JL, Joachims T, Turnbull D (2014) Taste space versus the world: an embedding analysis of listening habits and geography. In: Proceedings of the 15th International Society for Music information retrieval conference, Taipei, Taiwan
Palazzi MJ, Solé-Ribalta A, Calleja-Solanas V, Meloni S, Plata CA, Suweis S, Borge-Holthoefer J (2020) Resilience and elasticity of co-evolving information ecosystems. Preprint at https://arxiv.org/abs/2005.07005
Park M, Park J, Baek YM, Macy M (2017) Cultural values and cross-cultural video consumption on YouTube. PLoS ONE 12(5). https://doi.org/10.1371/journal.pone.0177865
Park M, Thom J, Mennicken S, Cramer H, Macy M (2019) Global music streaming data reveal diurnal and seasonal patterns of affective preference. Nat Hum Behav 3(3):230–236
Park M, Weber I, Naaman M, Vieweg S (2015) Understanding musical diversity via online social media. In: Proceedings of the ninth international AAAI conference on web and social media, Oxford, UK
Pichl M, Zangerle E, Specht G, Schedl M (2017) Mining culture-specific music listening behavior from social media data. In: 2017 IEEE International Symposium on Multimedia (ISM), Taichung. IEEE, pp. 208–215
Rosen S (1981) The economics of superstars. Am Econ Rev 71:845–858
Salganik MJ (2019) Bit by bit: social research in the digital age. Princeton University Press, Princeton
Salganik MJ, Dodds PS, Watts DJ (2006) Experimental study of inequality and unpredictability in an artificial cultural market Science 311(5762):854–856 https://doi.org/10.1126/science.1121066 American Association for the Advancement of Science Section: Report
Schedl M, Lemmerich F, Ferwerda B, Skowron M, Knees P (2017) Indicators of country similarity in terms of music taste, cultural, and socio-economic factors. In: 2017 IEEE International Symposium on Multimedia (ISM), Taichung. IEEE, pp. 308–311
Spotify (2019) Our playlist ecosystem is evolving: here’s what it means for artists & their teams—news—spotify for artists. https://artists.spotify.com/blog/our-playlist-ecosystem-is-evolving. Accessed 10 Nov 2020
Stirling A (2007) A general framework for analysing diversity in science, technology and society. J R Soc Interface 4(15):707–719
Vaisey S, Lizardo O (2016) Cultural fragmentation or acquired dispositions? a new approach to accounting for patterns of cultural change. Socius 2:1–15
Verboord M, Brandellero A (2018) The globalization of popular music, 1960–2010: a multilevel analysis of music flows. Commun Res 45(4):603–627
Waldfogel J (2015) Digitization and the quality of new media products: the case of music. In Economic analysis of the digital economy. The University of Chicago Press, pp. 407–442
Waldfogel J (2017) The random long tail and the golden age of television. Innov Policy Econ 17:1–25
Waldfogel J (2018) Digital renaissance: what data and economics tell us about the future of popular culture. Princeton University Press, Princeton
Waldfogel J (2020) Digitization and its consequences for creative-industry product and labor markets. In: The role of innovation and entrepreneurship in economic growth. The University of Chicago Press, p. 42
Way SF, Garcia-Gathright J, Cramer H (2020) Local trends in global music streaming. In: Proceedings of the international AAAI conference on web and social media, vol. 14. pp. 705–714
Way SF, Gil S, Anderson I, Clauset A (2019) Environmental changes and the dynamics of musical identity. In: Proceedings of the 13th international AAAI conference on web and social media, vol. 13. pp. 527–536
Acknowledgements
D.G. acknowledges funding from the Vienna Science and Technology Fund (WWTF) through project VRG16-005. We thank Marc Keuschnigg and Paul Schuler for their insightful comments on previous versions of this article.
Funding
Open access funding provided by Linköping University.
Author information
Authors and Affiliations
Corresponding author
Ethics declarations
Competing interests
The authors declare no competing interests.
Additional information
Publisher’s note Springer Nature remains neutral with regard to jurisdictional claims in published maps and institutional affiliations.
Supplementary information
Rights and permissions
Open Access This article is licensed under a Creative Commons Attribution 4.0 International License, which permits use, sharing, adaptation, distribution and reproduction in any medium or format, as long as you give appropriate credit to the original author(s) and the source, provide a link to the Creative Commons license, and indicate if changes were made. The images or other third party material in this article are included in the article’s Creative Commons license, unless indicated otherwise in a credit line to the material. If material is not included in the article’s Creative Commons license and your intended use is not permitted by statutory regulation or exceeds the permitted use, you will need to obtain permission directly from the copyright holder. To view a copy of this license, visit http://creativecommons.org/licenses/by/4.0/.
About this article
Cite this article
Bello, P., Garcia, D. Cultural Divergence in popular music: the increasing diversity of music consumption on Spotify across countries. Humanit Soc Sci Commun 8, 182 (2021). https://doi.org/10.1057/s41599-021-00855-1
Received:
Accepted:
Published:
DOI: https://doi.org/10.1057/s41599-021-00855-1
This article is cited by
-
The Soundtrack of a Crisis: More Positive Music Preferences During Economic and Social Adversity
Journal of Happiness Studies (2024)
-
A simple cognitive method to improve the prediction of matters of taste by exploiting the within-person wisdom-of-crowd effect
Scientific Reports (2022)


