
Abstract
Since Benoit Mandelbrot (1924–2010) coined the term “fractal” in 1975, mathematical theories of fractal geometry have deeply influenced the fields of landscape perception, architecture, and technology. Indeed, their ability to describe complex forms nested within each other, and repeated towards infinity, has allowed the modeling of chaotic phenomena such as weather patterns or plant growth. Some human-designed patterns such as the ones developed by Islamic cultures have been found to follow similar principles of hierarchy, symmetry, and repetition. However, the application of these principles in the design of gardens is an underexplored field. This paper presents a comparative exploration of the four-fold garden design model—the chahár-bágh—typical of Persian and Islamic garden design by analyzing two case studies: Taj Mahal and Isfahan’s city plan. This four-fold pattern is known to not only have a religious reading but to be also linked with ideals of fair distribution. Using an innovative compositional fractal analysis inspired by architecture, our results demonstrate that these gardens contain a high level of self-replication and scale invariance and that they exhibit a high fractal dimension. The novel application of this method of analysis to historical landscape plans allows us to assess to what extent fractal concepts were already in use before the European Renaissance and Mandelbrot’s explorations, and to speculate on their symbolism in the context of Islamic and Persian garden design. Specifically, we conclude that the fractal characteristics of these gardens might be intended as a representation of the infinite divine but also of principles of fairness and equality. Moving forward, this approach could be applied to design spaces, namely in the infrastructural design of the urban fabric, which are both meaningful and environmentally just.
Introduction
Fractal geometry is a theoretical framework formulated to unite forms and patterns previously considered too complex to be described (Mandelbrot, 1975). Specifically, the framework can be used to model natural forms such as coastlines and mountain ranges but also blood vessels. It is sometimes considered a universal pattern language as the forms it describes can be found in every living thing (Di Leva, 2016). Based on principles of self-similar symmetry and scale invariance, it is currently used in biological sciences such as medicine and ecology (Kenkel and Walker, 1996) as a way to understand complexity and structure chaos. Modern artists and designers have also been seduced by the approach’s innovative ability to create realistic organic patterns both in analog and digital platforms. However, there is no doubt that much like the shapes it describes, “fractal geometry dates back to centuries before the emergence of the fractal theory by Mandelbrot” (Abdelsalam and Ibrahim, 2019, p. 27).
Similarly, Islamic artistic expression follows three main modes: floral designs, calligraphy, and geometric patterns (Bonner, 2003; Khamjane and Benslimane, 2017). Out of these, at least the first and last of these modes echo elements of fractal geometry. Islamic patterns have also been found to exhibit high levels of self-similarity (Redies and Brachmann, 2017; Djibril and Thami, 2008; Aljamal and Banissi, 2003). In fact, “Iranian geometry using plant and geometric forms in Islamic buildings seeks to prove a special continuity in the life to plant and the human world” (Pudine, 2016, p. 257), similar to the unification of fractal patterns under one comprehensive framework. In addition, it has often been suggested that Islamic patterns are not merely intended as esthetic ornamentations but that behind each of them there is “a deep and subtle underlying spiritual philosophical message that has to be properly understood against the backdrop of the holy revelations of the Quran” (Aljamal and Banissi, 2003, p. 1). This principle extends to the design of gardens, such as the traditional chahár-bágh gardens which are rich in religious symbolism. Can the same be said about the use of fractal patterns within this cultural and artistic context?
Identifying these patterns in real-life data has proven problematic (Sun et al., 2006, Chen et al., 1993; Gonzato et al., 2000). Specifically, there has been little consensus as to how methods of fractal analysis, such as the box-counting method, should be used in design sciences such as architecture and landscape architecture (Ostwald, 2013) and how to interpret its results (Perry et al., 2008).
In this paper, a new method of compositional fractal analysis, combining visual analysis of spatial structures and the box-counting method is proposed and applied to historical plans of Islamic and Persian gardens. Indeed, although the box-counting method is widely used, it is rarely combined with visual analysis and the application of these two methods together has so far never been applied to historical garden designs. The objectives are twofold: first to discuss the efficacy and applicability of a new quantitative method of spatial analysis; and then to explore the implications of such patterns within the historical, religious, and philosophical Islamic and Persian context.
Firstly, some necessary notions of fractal mathematics are presented, followed by a description of the chahár-bágh gardens and the particular examples of Taj Mahal and Isfahan’s city plan. The new methodology is then also described and applied to our case-studies. The results obtained are finally discussed for their potential methodological and semantic interpretation.
Fractal geometry, definitions, and principles
Although Polish-born French mathematician Benoît Mandelbrot is often considered the Father of Fractal geometry (Kian and Amiriparyan, 2016), by his own admission he merely joined the dots of pre-existing mathematical research, the so-called “mathematical monsters”. While solving a different problem, the assessment of the length of the coastline of Britain, he realized the potential of these impossible shapes and devised an overarching theory to unite those previous contributions (Mandelbrot, 1975).
Mandelbrot’s process of aligning previous mathematical knowledge resulted in fractal geometry being more “a collection of examples linked by a common point of view, [than] an organized theory” (Lorimer et al., 1994, p. 1). Indeed, Mandelbrot was careful to restrict his definitions of fractal theory to empirical rules, namely self-similarity and scale invariance, meaning that a fractal must display similar structures or irregularities at different scales and the repetition of a distinct pattern replicated at every scale. Successive magnifications of a fractal should reveal perfectly identical structures, sharing properties like angles and proportions, theoretically ad infinitum (Mandelbrot, 1975).
Specifically, Mandelbrot revisited the work of Lewis Fry Richardson, another mathematician who had explored coastlines and formulated equations to model the geographical problem into mathematical terms, defining a constant, noted D, whose root was proportional to the estimated length of the observed coastline. Through his examination of Richardson’s equations, Mandelbrot found that D was intrinsically dependent on the observed coastline and decided to use it as a descriptor for the natural forms to be studied: the “fractal dimension” (Mandelbrot, 1975).
Fractal dimension
Following the work of Richardson, Mandelbrot unearthed the work of another mathematician, Félix Hausdorff, who in 1919 had worked on defining a similar indicator, called the Hausdorff dimension. This new dimension was based on scaling rather than defining location the way topological dimensions do in Euclidean space. Indeed, Euclidean dimensions are typically related to the number of coordinates needed to identify a point within a designated object: 1 for the line, 2 for a plane, 3 for a cube. Instead, Hausdorff defined a value to describe the content of an object based on its reaction to scalar operations. For example, a line divided into three equal segments can be defined as 3 × 1/3 of the original shape, which equals 1. Comparatively, a cube whose edges are each divided in 3 will eventually look like an assemblage of 9 cubes each 1/3 of the original shape, which equals 3. Soon, Mandelbrot realized that the D described by Richardson was in fact an approximation of the Hausdorff dimension (Mandelbrot, 1975).
The particularity of D is that unlike topological dimensions in Euclidean geometry it is not an integer and can be anything from a simple fraction to an irrational number. It’s clear from the definition above that all Euclidean shapes have a Hausdorff dimension which equals their topological dimension. Fractal patterns, by contrast, do not. Theoretically, a fractal can be described as an object whose Hausdorff dimension strictly exceeds its topological dimension (Mandelbrot, 1975). Practically, or visually, D is thought to estimate “the object’s degree of irregularity and break” (Mandelbrot, 1975, p. 6). It also characterizes the ratio of change in detail to change in scale and therefore the self-similarity of a pattern (Di Ieva, 2016). If the object is fractal, as one zooms in, the quantity of detail grows constantly, tending towards infinity and the slope of the curve representing that growth is the fractal dimension. It is widely used as a measure of complexity (Theiler, 1990; Sun et al., 2006), visual variety (Cooper and Oskrochi, 2008), and sometimes of naturalness (Perry et al., 2008).
There exists a lingering confusion between fractal geometry and fractal dimension whereby it is expected that any object which exhibits a fractal dimension is considered fractal (Ostwald, 2013). However, according to Mandelbrot, any pattern may have a fractal dimension, but only sets with a defined scaling pattern can be described as fractal objects (Mandelbrot, 1975). Specifically, the observed power relationship of scale and content must be constant across the pattern. Therefore, it is not sufficient to just estimate the D value of a pattern to determine its fractal nature, but one should also conduct a visual interpretation of the scaling relationship within its components (Shishin and Aldeen Ismail, 2016).
Fractals and infinity
Another mathematician whose work was essential for the conception of fractals and fractal dimension is Georg Cantor (1845–1918): considered the first scientist to define mathematical infinity. which until then was a strictly philosophical topic. Infinity or even an “infinity of infinities” (Drozdek, 1995, p. 132) became an integral part of Cantor’s work on mathematical set theory (Drozdek, 1995).
A remarkable example of fractal infinity is the Koch snowflake, also unearthed by Mandelbrot and originally derived from the work of Helge von Koch in 1904 (Fig. 1). The outside of the snowflake, or its “skin”, is theoretically infinite although bounded in space (Mandelbrot, 1989). Indeed, the outline would never exceed the boundary of a circle traced around the original triangle.

The snowflake is created on the basis of an equilateral triangle, then by dividing each side of the triangle into three equal segments and replacing the middle segment with a smaller equilateral triangle. The process is repeated, theoretically to infinity but in practice until the sides can no longer be divided. Source: Image adapted from Wikimedia-Koch snowflake. This figure is covered by the Creative Commons Attribution-Share Alike 3.0 Unported (CC BY-SA 3.0). https://commons.wikimedia.org/wiki/File:KochFlake.svg [Accessed: February 2021].
Many centuries before Cantor and Koch’s work, in the field of Philosophy, Zeno of Elea (495–430 BC) devised “paradoxes”, or conundrums, such as his description of the physical distance one wishes to travel as infinite, by breaking it into an infinite number of smaller distances. Moore (1995) writes: “In this conundrum [Achilles] challenges the slow tortoise to a race and grants her a head start. Before he can overtake her, he must reach the point at which she began, by which time she will have advanced a little. Achilles must now make up the new distance separating them, but by the time he does so, she will have advanced again. And so on, ad infinitum. It seems that Achilles can never overtake the tortoise. In like manner, Zeno argued that it is impossible to complete a racecourse. To do so, it is necessary to reach the halfway point, then the three-quarters point, then the seven-eighths point, and so on” (p. 21). By this logic, no motion is ever possible, and all distances are theoretically infinite. This is closely related to fractals, namely though its seminal exploration of the infinite length of coastline; and to Cantor’s explorations of infinities within infinities, some 2000 years before either of these mathematical constructs were formulated (Moore, 1995).
Persian gardens and the importance of sharing waters
“Making the Desert Bloom” is Fairchild Ruggles’ (2008) expression to describe the essence of the Islamic garden design tradition; an essence based on the constant struggle to capture permanent and life-giving water supplies capable of sustaining bounded productive settlements in deserted landscapes. The knowledge collected from Ancient hydrological traditions like those of Mesopotamia, Persia, Egypt, Rome, and Byzantium was co-opted to allow these communities to excel in their water management skills (Fairchild Ruggles, 2008), and by doing so, also to incorporate the concept of water in Islam which is often associated with that of God himself. The Ocean is a metaphor for the infinity, grace, and unity of the Almighty, as also for his rage and mercifulness. The word rahmet, which literally means mercy, is also used to signify rain in everyday language in Turkey, and the prophet Muhammad is often metaphorized by the idea of the flowing rivers that journey from a small isolated fountain until the divinity of the Ocean (Schimmel, 1985).
The boundness of the “fabricated” oases amid the desert is inextricably linked with the idea of paradise, a concept incorporated from the old Persian word pairidaéza translating the idea of “surrounding walls” (pairi, meaning around; and daeza meaning wall) (Moynihan, 1979; Clark, 2004) later enmeshed with the physical reality of a garden and the metaphysical idea of the afterlife. In the Qur’an, these two ideas are often represented by the Arabic word “Jannáh”, or “Jannát” (plural) that appears 147 times in the text (Wescoat, 1995; Clark, 1996) within expressions like: ‘Jannát al-má’ w’a’ or “garden of shelter”; ‘Jannát al-naím’ or “garden of delight”; ‘Jannát al-khuld’ or “garden of eternity”; but also ‘Jannát tajrí min tahtiha al-anhár’ meaning “gardens underneath which rivers flow” being Q’uran’s most common garden-related expression (Clark, 1996).
These “gardens underneath which rivers flow” resonate with the underground water supplies which make most of the water sources in the desert (Cressey, 1958; Clark, 1996). Devices such as the Saqiva and the Na’uara were developed to elevate deep underground water via animal traction, just like the Persian water collection system qanat was developed to extract water from the purest sources and transport it underground through long distances (Cressey, 1958; Fairchild Ruggles, 2008). The physical point where the surfacing water could be collected by the communities is where the water is cleanest and freshest and the farther away from a house or a field is from that main point of distribution, less water quality it will have, imprinting desert cities, and field ownership with a particular spatial/social hierarchy, where wealthier communities live closer to the main mouth of the water source, and the poorest farther away (Schimmel, 1985). The exercise of fair water distribution should have been one of the main concerns of these communities and the structure of gardens seems inextricably linked with it.
In a traditional society strongly influenced by religion, the distinction between practical needs and meanings, human achievements and blessings, or knowledge and divine enlightenment, is often dismissed. In the case of garden design, the same difficulty to disentangle the driving forces for a particular design is present. Is it rooted in belief and theological principles or simply in practical needs, efficiency, and craftsmanship (Wescoat, 1995)?
A good example to explore this unsolved question is the chahár-bágh (Pinder-Wilson, 1976): a garden layout composed of four equal parts separated by water passages and centered by a pavilion in the intersection of the two main canals that traverse the garden space (Pinder-Wilson, 1976).
“The figure of the chahár-bágh has been interpreted to denote the four quarters or directions of the universe. The orthogonal waterways have been seen to symbolize the four rivers of Eden; the water as the Christian and Muslim symbol of moral and sacred purification, the fish as an unequivocal symbol of life, the towering cypress trees, pointing to the metaphysical after-life, as a symbol of death, and lastly, the garden as a universal metaphor for the positive and symbiotic relationship between man and nature, where water channels give replenishment, green trees render comforting shade, and fruit orchards extend pleasure and nourishment.” (Walcher, 1998, p. 333).
The first archeological evidence of such a geometric pattern used in gardens dates back to Cyrus the Great’s Pasargadae (559–530 BC) where a quadripartite garden is believed to steam from a Zoroastrian’s view of the Universe as formed on the basis of four principal elements: water, wind, soil, and fire (Faghih and Sadeghy, 2012). At a much later period, the four water channels that divide the four main plots will be associated in the Qu’ran with the elements of water, honey, milk, and wine (Clark, 2004). For the Pythagoreans – 6th century BC—the number four represented Justice, as the first square number (Flegg, 1983). Justice is also a key idea for the much later written Qur’an where it has two different main dimensions: the Adl and the Qist. Whereas the former—Adl—relates to the inner and individual path towards righteousness conducive to moral, behavioral, and spiritual balance, the latter—Qist—translates as the fair relationship of human beings amongst each other and human beings and God, which is closely associated with ideals of social justice. Sharing fairly or equitably is key for the idea of Justice in Islam, translated by the word Kasf, literally meaning the division of something in two equal portions (Afzal, Zaman and Barazangi, 1943). When a distribution is not fair and equitable, then Zulm is established, translating as “opacity, darkness, confusion” or “gloom” (Afzal, Zaman and Barazangi, 1943). Politically, the establishment of Adl relies on a fair, balanced, and righteous leader capable of establishing the “rule of law”.
In several European languages, the number four, often equivalent to the square and to the cross, has been associated with righteousness and order (Menninger, 1958) (Fig. 2).

(Adapted from Menninger, 1958).
Fair division, good governance, and good leadership are according to Walcher (1998) and Pinder-Wilson (1976) at the heart of the four folding garden layout—chahár-bágh—and not surprisingly these particular gardens are most of the times annexed to royal houses with the central pavilion, at the canal intersection, often being the throne room (Pinder-Wilson, 1976). Kings as God’s envoys practiced the justice exercise of good governance, but the greatest Good and the greatest Justice was still to come.
According to Schimmel (1976), the presence of the chahár-bágh layout might have additional meanings, namely related to a layered spiritual, reserved, and interior life with the theosophist Ibn ‘Arabi (d.1240) presenting paradise as being composed of eight distinct gardens, wherein each there are 100 different levels to be journeyed in the approximation to Allah, meaning simply ‘God’ in Arabic. Schimmels’ presentation of a more spiritual interpretation of the chahár-bágh resonate with the first dimension of Justice – the Adl or inner journey towards righteousness and balanced life, that is most profoundly associated with a self-replicating hierarchy that geometrically leads to the concept of Infinity and personally to inner concealment leading to the Divine.
Besides its symbolic meaning, a more practical idea of effective water and land distribution could be underlying this particular widespread garden layout. and the ideal of a perfected geometry of distribution might have been at the heart of these gardens. In life’s distributary systems, it seems that the number four is known to equally be of crucial importance. In the 1930s, Kleiber stated that the metabolic rate of a living animal is a ¾ power of its mass (MR ~ Mass ¾). Following this law, around fifty others were found, all showing multiples of ¼ exponents. For example, growth rates have a ¾ exponent, lengths of aortas have a ¼ exponent, heights of trees have ¼ exponent, brain sizes have a ¾ exponent, and heart rates a minus ¼ exponent. In collaboration with James Brown and Brian Enquist, Geoffrey West hypothesized that this common feature of life was related to the pervasiveness of quasi-perfect hierarchical branching networks in living organisms, from trees to mammals (West, 2018). In their words, it is “the magic number four that controls life” (West, 2018, p. 93).
Scope of the research
Applications of methods of fractal analysis to Islamic and Persian art
At the time of writing, several studies had already been carried out to explore the links between fractal geometry and Islamic and Persian art. Through a non-exhaustive literature review carried out using both Google Scholar and Web of Science,15 studies were selected using the search terms “fractal” and “Islam” or “Islamic”. Studies were selected based on the disciplines (art, architecture, urbanism), language (English only) and availability.
Specifically, several studies were found to have analyzed the type of symmetries exhibited by some Islamic Geometric Patterns (IGP) and how to harness these to construct new patterns in the same style (Khamjane and Benslimane, 2017; Djibril and Thami, 2008; Aljamal and Banissi, 2003; Bonner, 2003). Although both Djibril and Thami (2008) and Aljamali and Banissi (2003) focus on the self-similar aspects of these patterns rather than their scale invariance, artist Phil Webster created a method based on fractal geometry to generate self-similar and scale-invariant IGP (Webster, 2013). Similarly, when comparing the fractal dimension and self-similarity of 238 Islamic traditional illustrations to those of other visual art pieces, Redies and Brachman (2017) found that they had the highest self-similarity of all images. However, they noted that to some extent, traditional artworks of Western, Islamic, and Chinese origin all shared a specific pattern of statistical image properties.
At a larger scale, Islamic and Persian architecture, from the ornamentations to the arrangement of buildings with each other, was also found to exhibit fractal properties (Pudine, 2016). Recently, Abdelsalam and Ibrahim (2019) showed the Mameluke Mosque-madrassa Al-sultan in Cairo (Egypt) was a living example of the fractal geometry of this traditional architecture, not only through the apparent symmetry of its structure but also through the seemingly iterative process which generated it. Principles of fractal geometry have eventually been found to appear at three different scales: from the micro (building and motifs) through the medium (neighborhood) and to the macro (city) of Iranian architecture, particularly in the cities of Isfahan and Yazd (Kian and Amiriparyan, 2016). The fractal-like nature of Islamic and Persian buildings has been so consistently observed that new methodologies of compositional fractal analysis, combining design analysis and applied mathematics, have been proposed specifically for the study of Islamic architectural ensembles (Shishin and Aldeen Ismail, 2016).
Finally, at the city scale, these same principles of fractal geometry were also successfully analyzed to extract patterns within the complex urban fabric of traditional Muslim cities (Ben Hamouche, 2009; Ben-Hamouche, 2011; Ashrafi, 2017). In this context, self-organized developments, succession laws and incremental growth periods were some of the factors cited as able to generate scale-invariant and self-similar urban patterns.
However, in both the city and the garden there seem to be self-replicating patterns which, although spatially and symbolically different, can be considered as fractal patterns.
Applications of fractal methodologies to garden and landscape design
Although fractal geometry has been very useful for disciplines keen to model chaotic and natural processes, “practical applications of the geometrical principles themselves in the context of Landscape Design are yet to be explored” (Patuano and Tara, 2020, p. 72). Indeed, although fractal principles have already successfully been applied to urban patterns analysis (ie: patterns formed by chaotic, bottom-up processes) (Ben Hamouche, 2011, 2009; Kian and Amiriparyan, 2016), this work proposes the application of these principles to the artistic practice of garden design (ie: patterns consciously formed through a top-down process). Within this practice, fractal analysis has for the moment mostly been applied within the context of landscape visual assessments and for the purpose of exploring the visual perceptions of landscape scenes (Patuano and Tara, 2020).
There are notable exceptions, such as the attempt of Perry et al. (2008) to create a new ecological esthetic based on fractal geometry. Although it successfully applied methods of fractal analysis to several parks, this study, like many others, restricted their analysis to point-of-view photographs of scenes rather than considering the layout of the sites on a plan.
This is not the case, however, of a set of studies carried out on traditional Chinese gardens. In the first one, Lu (2010) analyzed the spatial structures, walkways, and waterways of Yuyuan, a typical 16th century garden near Shanghai, and identified the generative iterations which they associated with the principles of the I Ching. The second one extends the results of the first by including two other traditional gardens, Zhuozhengyuan (Suzhou) and Liuyuan (Suzhou), and by devising a parametric system capable of generating garden plans which replicate their complex socio-spatial characteristics and esthetic properties (Yu et al., 2015). However, this type of analysis has yet to be applied to the study of Islamic and Persian gardens.
Therefore, this study is primarily interested in exploring the application of a compositional fractal analysis method, based on visual analysis coupled with the box-counting method of determining the fractal dimension, as a new approach to the spatial analysis of traditional gardens.
Although Islamic patterns (Djibril and Thami, 2008), architectural ensembles (Shishin and Aldeen Ismail, 2016), and cities (Ben Hamouche, 2009) have all been investigated for their fractal characteristics, no similar study could be found regarding the case of traditional Islamic gardens. Therefore, the four-folding designs of traditional chahár-bágh gardens are a good case study to explore the potential of this new methodology.
Furthermore, there is currently a growing realization that scientific analysis can reveal unexpected structural features hidden in works of art, including gardens, and that these implicit structures and hidden patterns can influence our unconscious perceptions (Van Tonder et al., 2002). In the case of the chahár-bágh garden, already loaded with symbolism and meaning by its function, the repeating square pattern could also carry a specific philosophical message.
Research questions
Based on the identified gaps in knowledge, the main research question considers whether a new methodological approach based on fractal analysis could reveal hidden structures in Islamic and Persian traditional chahár-bágh gardens. In doing so, this study also tackles sub-questions such as:
-
What is the fractal dimension of traditional Islamic and Persian gardens?
-
What might be the symbolic meaning of this value in the context of these gardens?
The base hypothesis is that traditional chahár-bágh gardens exhibit fractal properties that can be explored via a compositional fractal analysis. Indeed, it is likely that these gardens exhibit fractal characteristics such as self-similarity and scale invariance, which might be assessed with the box-counting method; and that these characteristics might be based on an eighth-layered composition which might be observed through visual analysis. These characteristics can then also be examined in order to determine the link between design choices and the evocation of the infinite divine.
Methodology
In order to assess the fractal characteristics of Islamic and Persian gardens, two case studies of classic examples of chahár-bágh were chosen: Isfahan city plan and the Taj Mahal garden. Although these two design examples have vastly different scales, the principles of scale-invariance which underlies fractal theory, and according to which branching structures in trees and blood vessels have comparable statistical properties, allow them to be seen as one general four-folding layout. Indeed, in the Isfahan city plan, the four-folding pattern first occurs at the scale of the city, with the intersection of the river and the main street being considered as the first four parts division (Walcher, 1998).
Case studies
Isfahan
The 17th century Shah Abbas I’s plan for the city and gardens of Isfahan is one of the most emblematic examples of a composed chahár-bágh layout (Welch, 1974; Hunar, 1976). Already in the 11th century AD, this city had been recognized as one of the richest and densest Persian agglomerations according to Naser Khosrow’s journey accounts (Hunar, 1976). Its strategic position within the Silk route made it an important national trade point, besides being in a fertile plain with good water sources – the Zayendeh river - and a qanat that extracted water from the mountains (Welch, 1974; Hunar, 1976).
This already important city was established as the capital of the Persian empire in 1597 by Shah Abbas I (1587–1629) (Welch, 1974), who envisaged a garden extension and a new palatial complex anchored on the old city through the Naqsh-i Jahan Square with its four hallmarks: the main Masjid-i Shah public mosque, the Imperial Bazaar, the Ali Qapu Palace and the royal private Masjid-i Shaykh Lutf Allah mosque (Walcher, 1998). This new city addition and palatial complex elevated the city’s image to its new position and the development of its great plan later became the footprint of the contemporary city itself (Shankland, 1967).
According to Walcher (1998), the use of the east-west river linear direction, orthogonal to the north-south chahár-bágh avenue, composes the first hierarchical layer of Shah Abbas I’ plan for his garden-city. This great crossing avenue was composed of alleys of great plane trees and sided by thirty wall-partitioned gardens offered to high ranked officials, as described by Kaempfer, the German physician who visited the city around the 1680s (Walcher, 1998). The design of these thirty gardens was determined by the Shah himself and his counselors, among which Sheikh Bahai (1547–1621) (Faghih and Sadeghy, 2012), who based the dimensions of the new city plan and corresponding gardens on the pressure and reach of the Zayendeh river’s waters (Faghih and Sadeghy, 2012). Most gardens follow a four-folded structure although not always in strictly conventional terms. However, this is probably the most extensive agglomeration of juxtaposed chahár-bághs. Amongst these gardens is the Bagh-i Hasht Behesht, literally meaning “The Garden of the Eighth Paradise”, a reference to the symbolic significance of the number eight that pervades the whole notion of the subdivisions of the numbers two and four. The chahár-bágh avenue would link directly to the Allahverdi Khan bridge which in turn would give access to the grand royal garden of Hizar Jarib which has unfortunately disappeared (Ahmadi, 2016).
Taj Mahal
The Taj Mahal is one of the most emblematic buildings of Islamic tradition and the tomb of Mumtaz Mahal, the second wife of Shah Jahan who reigned as Moghul Emperor from 1627 until 1658. Mumtaz died at the age of 38 while giving birth to her fourteenth child in a Burhanpur’s campaign site in 1631, leaving a profoundly mourning Emperor who decided to express his grief by building a sumptuous tomb and associated gardens to her late wife’s memory (Tillotson, 2008). This is the romantic story that gives rise to the Taj Mahal as a symbol of love and architectural perfection (Tillotson, 2008) profoundly associated with the popular image of Mughal India. The garden laid out to contextualize this grand tomb follows the chahár-bágh layout introduced to India by Babur, the first of the Mughal Emperors in India of Timurid descendants and strong Persian influence (Moynihan, 1979). Although the chahár-bágh had been introduced by Babur in the 16th century, it is in the Taj Mahal, planned by his great-grandson, that shows its more developed hierarchical nature. It is also an example where the main built structure, in this case, the tomb itself within the terrace structure and the four minarets, is not placed at the center of the plan, in opposition to the classical layout although Elyzabeth Moynihan (1979) advocates that the design was intended to have been replicated by the mirroring image of the tomb in the river and the chahár-bágh laid out on the other riverbank, the Mahtab Bagh, completes the plan and effectively places the tomb with its mirroring image at the center of the layout as a whole (Moynihan, 1979).
According to Moynihan (1979), the irrigation system of the garden reinforces the importance of the mirroring of the tomb in the river for the general garden layout where contrary to numerous chahár-bághs the central axis was often planted with tall trees such as cypresses or plane trees. In the case of the Taj Mahal, most of the irrigation water was conducted to the extreme borders of the garden, signaling that most trees were intended to grow in the periphery of the garden, whereas small shrubs and herbaceous plants occupied the central axis. This confirms the hypothesis that both the mirroring effect and direct visual relation with the other side of the riverbank were considered when choosing the plantation layout.
Both Isfahan’s new Imperial complex and Taj Mahal’s funerary complex follow the traditional four-fold geometric garden layout typical of Islamic traditions, or even more broadly of Semitic traditions when considering Christian medieval gardens as a simplified four-fold garden layout. In both cases, the rivers that are in close relation with these sites can be considered the top hierarchical level of the layout and its corner stone. Differentiating these two examples seems to be the compositional nature of the first and the more hierarchical nature of the second.
Fractal analysis
In order to assess the fractal characteristics of the case studies, a collection of blueprints was selected.
-
For the Taj Mahal, a digital copy of Col. Hodgson’s survey plan of 1828 was downloaded in lossless.bmp format and with dimensions 1712 × 2337 pix (see Fig. 3). It was cleaned and saved for analysis as a bmp image (582 × 563 pix, 96 ppi).
Fig. 3: Taj Mahal plan used as the basis for the fractal analysis. 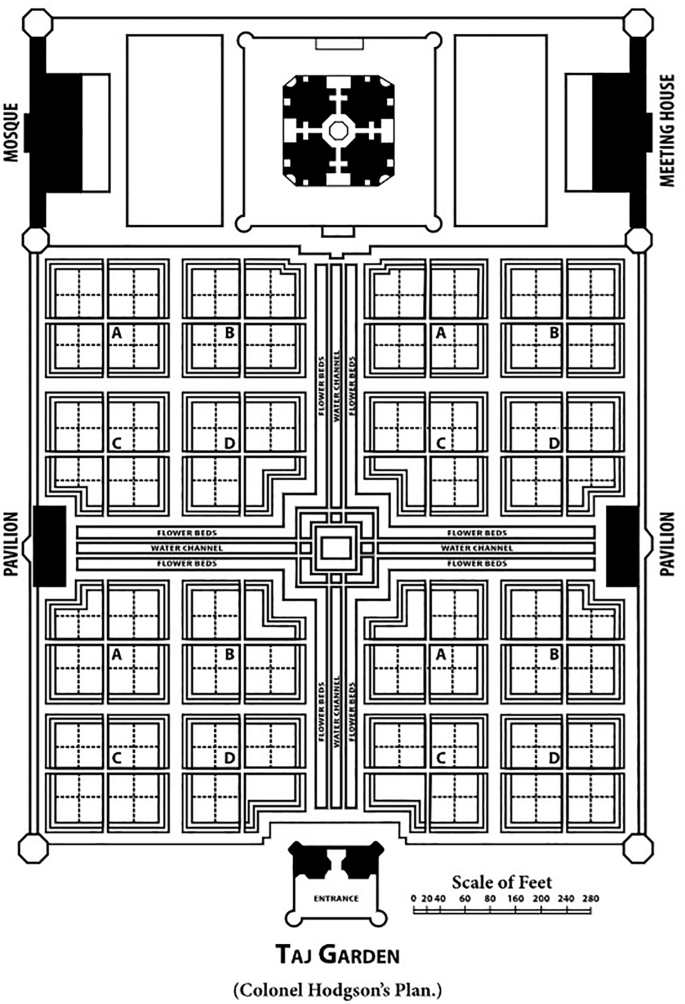
Source: Col. Hodgson’s survey plan (1828). TajPlanMughalGardens.jpg: Villiers Stuart derivative work: Fred the Oyster/Public domain. : https://commons.wikimedia.org/wiki/File:GreatMughalsTM_(complete).svg [Accessed 1 June 2019].
-
For Isfahan, two interpretative plans, one from Jellicoe and Jellicoe (1987, p. 50) and one from Trancik, 1986 (see Fig. 4) were downloaded and cross-referenced into one composite drawing traced on Photoshop and saved in lossless.bmp format (293 × 821 pix, 300 ppi).
Fig. 4: Isfahan city plans. 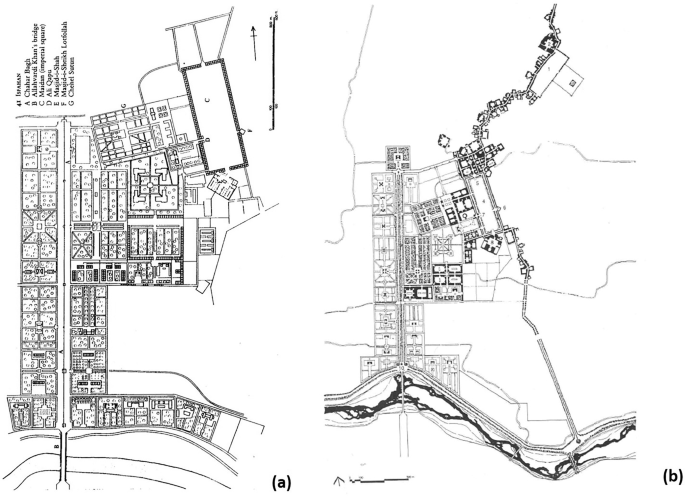
Plans used for the fractal analysis. Sources: (a) Jellicoe and Jellicoe, 1987, p. 50. https://www.flickr.com/photos/quadralectics/4269101648 [Accessed 1 June 2019]; (b) Drawing by Nadar Ardalan, in Trancik, 1986. https://classconnection.s3.amazonaws.com/279/flashcards/2821279/png/arch_541361404714733.png [Accessed 1 June 2019].


The fractal patterns were first identified by a visual analysis of internal patterns such as the one carried out by Shishin and Aldeen Ismail (2016) to describe their levels of repetition and symmetry.
Visual analysis
The visual analysis proposed by Shishin and Aldeen Ismail (2016) is a critical step in the fractal analysis for the main reason that the value of the fractal dimension of an object is not enough on its own to fully describe the appearance of that object. Indeed, although it can quantify an object’s complexity, it says nothing of the object’s shape or size (Kenkel and Walker, 1996). Therefore, different fractal objects may share the same fractal dimension and yet have completely different appearances (Mandelbrot, 1989).
In addition, even Euclidean patterns can exhibit a fractal dimension when digitized. This is due to the inherent limitations of the digital medium where curves and diagonals are approximated with a “staircase” of pixels. Applying the box-counting method on such patterns can still return a certain value of D, which would be theoretically invalid. Therefore, carrying out a visual analysis of the plans and significant elements of the gardens allow us to determine which type of fractal patterns, if any, are present in the design.
Although Shishin and Aldeen Ismail (2016) originally applied this method using architectural composition theory to buildings’ plans, sections, and facades, technical drawings and blueprints with that level of details are more rarely used in garden design and even more rarely accessible in the case of historical sites. Therefore, the visual analysis used here is only applied to the garden’s plans.
The visual analysis of the gardens’ plans was carried out by trained landscape architects and only requires an awareness of famous fractal patterns (such as the Sierpinski gaskets or the Kock snowflake) and a visual or artistic understanding of lines and space.
Once fractal structures were visually identified, the box-counting method was applied to the plans in order to estimate the value of their fractal dimension.
Fractal dimension estimation by box-counting
The fractal analysis of blueprints was carried out using the box-counting method, which consists of overlaying grids of different sizes over the pattern and counting the number of boxes containing information at each iteration. A box that covers the object is counted only once, regardless of how many pixels (or parts of the object) are covered by it. For each grid iteration, the size of the boxes is noted as d and the number of boxes containing a part of the pattern is noted N(d). As d is progressively decreased and the grids become tighter and composed of smaller boxes, the pattern is effectively analyzed at subsequentially decreased scales (e.g.: Ostwald, 2013; Cooper and Oskrochi, 2008).
With this method, the fractal dimension D is defined as the exponent in the equation
Where N(d) is the number of boxes of linear size d.
The logarithm of N(d) can then be plotted against the logarithm of d in a graph called a Richardson plot as a reference to the mathematician who developed it, and the value of D can be read graphically as the slope of the curve (Mandelbrot, 1975). If the Richardson plot produces a prominently straight line over a sufficiently extensive range of scales, then the pattern is shown to be scale-invariant and therefore considered fractal. The line of fit will have a negative slope that equals–D. It is worth noting that the D value calculated from box-counting is an approximation, rather than an exact application, of the Hausdorff dimension. Furthermore, the curve of which–D is the slope is an average of the set of points, making D a statistical indicator.
Box counting is a popular method of fractal analysis, thanks to its straightforward principles and accessible implementation. It is, however, limited in its application and sensitive to the parameters of the analysis. Specifically, it can only be applied on binary images in which the “pattern” (or “object”) is significantly distinct from the rest of the information contained in the image (the “background”).
Box-counting parameters
The box-counting method was applied to the selected blueprints by the software BENOITTM version 1.3 provided by TruSoft Int’l Inc. The factors of the analysis were set according to the parameters described by Ostwald (2013) for architectural analysis and adapted to the analysis of the landscape plans.
Field properties
The field refers to the background on which the plan is placed, its proportions, and the amount of white space included around the pattern. The size of the overall image is the first practical factor of limitations of the box-counting process. The proportion of the field is related to its capacity to be evenly divided. The box-counting method uses square boxes, so the field’s dimensions should be multiples of the same figure which represents the boxes’ size (Ostwald, 2013). It was eventually demonstrated that the maximum size of the boxes should be the length of the shortest side of the field, divided by four (Ostwald, 2013; Cooper and Oskrochi, 2008).
Therefore, for the analysis of our case studies, the largest boxes were set up to be smaller than the length of the shortest side of the plan divided by four (see Table 1).
Image properties
An important aspect of image properties is the limitations introduced by the use of digitized images rather than computer-generated ones as raw data. This includes the presence of noise (i.e., superfluous pixels), the limits of the image’s resolution, and the presence of lines over one-pixel wide (Gonzato et al., 2000). Indeed, although it is appropriate for the analysis of digital (binary) images, the box-counting method is known for being unreliable when applied to solidly filled areas of images, or when analyzing simple lines (Sun et al., 2006; Gonzato et al., 2000).
In this study, every line drawn on the plans was manually cleaned of noise and thinned out using Adobe Photoshop in order to be no more than one-pixel wide (Ostwald, 2013).
Statistical divergence
The value of D is graphically represented by the slope of the curve traced by the logarithm of the number of boxes counted as a function of the logarithm of the boxes’ size. The slope is therefore the average of a set of points, rather than a fully accurate graph. Statistical divergence refers to the degree to which certain data points deviate from the main curve (Ostwald, 2013). This is critical in the analysis of real data as the self-similarity properties will only extend over a limited range of scales (Cooper and Oskrochi, 2008). Cooper and Oskrochi write:
“The resultant fractal dimension is related to observations made over a specific range of scales and relates only to those scales. This makes the selection of a useful measurement scale vital in achieving meaningful results when evaluating different characteristics. For example, it would be of little value to evaluate the facade of a building at scales ranging from 50 m to microns.” (Cooper and Oskrochi, 2008, p. 353)
Ostwald (2013) identifies three types of divergence:
-
1.
Opening divergence, which can be caused by the presence of white space around the image, or by the image completely filling a single box.
-
2.
Central divergence, which can occur when the image is multifractal, is represented by an inconsistent shift in slope.
-
3.
Closing divergence: This occurs when the boxes are so small, they are mostly counting empty space within the image. This is primarily linked to the use of digitized images of real data, which are only continuous over a limited number of scales (Chen et al., 1993).
The opening and closing divergences can be minimized by the careful setting of the lower and upper bound of the successive grids. It is suggested to carry out the analysis using boxes of sizes ranging between 0.25 l and 0.03 l, where l is the height of the image (Ostwald, 2013; Cooper and Oskrochi, 2008). This adjustment also partially solves the issue of resolution by limiting the analysis to larger clumps of pixels which reduces the probability of including noise.
Following the literature, in order to avoid statistical divergence, images were all analyzed between 0.25 l and 0.03 l, where l is the height of the image. The largest box sizes were therefore established as either a quarter of the length of the shorter side (in the case of the plan of Isfahan) or 0.25 times the length of the height (in the case of the Taj Mahal plan), depending on which was the smaller value. Table 1 gives the details of the parameters used for each image.
Grid rotation
The angle formed by the pattern and the boxes’ sides can impact the results, particularly for digitized images in which diagonal lines are approximated by a “staircase” of pixels. This approximation tends to yield an overestimation of D. Gonzato et al. (2000) tested the variations in results of the box-counting method applied to rotating shapes and concluded that, in order to compensate for the angle bias, one should take at least “20 random placements and [average] the values of D obtained” (p. 116).
This method of grid rotation is automatically applied by the software BENOITTM version 1.3 so no specific parameters were entered here. Values reported in the result section also indicate the standard deviation for the calculation of the average values of D obtained for each image.
Grid scaling coefficient
As the box-counting method involves the successive application of grids of different sizes onto an image, the scaling coefficient characterizes the ratio between one grid and the next. This can affect the results of the analysis in two ways:
-
Since D is calculated from the slope of the curve representing the number of boxes filled as a function of the boxes’ sizes, a high scaling coefficient would reduce the number of iterations which would then yield fewer data points to trace the curve.
-
Depending on the field properties, a low scaling coefficient can create an overestimation of the amount of white space included in the calculations, which would also lead to inaccurate results.
A scaling coefficient of 2:1 (each grid is made of boxes exactly half the size of the previous one) seems to be the most desirable (Ostwald, 2013; Sun et al., 2006; Gonzato et al., 2000). According to Ostwald (2013), this is due to the successive iterations of the grid having the same external dimensions and therefore always including the same quantity of white space. Sun et al. (2006), however, claim this allows the data points on the Richardson plot to be equally spaced, which would then increase the stability of the slope.
Nevertheless, such a large ratio means that only a few successive grids can be used before the boxes are too small. Furthermore, the error rate of the analysis has been shown to be reduced to 25% if at least five grids were used and compared (Chen et al., 1993). Thus, determining the best scaling coefficient requires a balance between the maximum available number of grid comparisons and the error created by the inclusion of too much white space (Ostwald, 2013).
In this study, which used relatively small and low-resolution images and within the specific parameters previously discussed, a 2:1 scaling coefficient only allowed for the use of 4 successive grids (see Table 1, Fig. 5, and Fig. 6). Therefore, the analysis was also repeated using 5 grids in order to cross-examine the original result.

Four successive grids are applied to range from l = 140 to l = 17, where l is the length of the sides of the boxes (in pixels). This illustration does not show the grid rotation and the random placements of grids effectively carried out by the software BENOITTM version 1.3.

Four successive grids are applied to range from l = 73 to l = 18, where l is the length of the sides of the boxes (in pixels). This illustration does not show the grid rotation and the random placements of grids effectively carried out by the software BENOITTM version 1.3.
Results
Visual analysis
The blueprints were first observed to identify their self-similarity, scale invariance, and basic unit (i.e., the original pattern which is then repeated across scales). This allowed an interpretative analysis alongside the purely quantitative estimation of the plans’ fractal dimension, as well as providing a concrete distinction between Euclidean and fractal patterns.
Taj Mahal gardens
The landscape plan of the Taj Mahal reveals the clearest example of the fractal nature of chahár-bágh gardens.
The basic unit (the square) is repeated four times at eight different scales. The central square itself is magnified 24 times showing both self-similarity and scale invariance. Another approach to analysis would consider the square barred by a cross as a basic unit of the Taj Mahal gardens, just like the square with a missing center could be seen as the basic pattern behind the Sierpinski’s carpet, a famous fractal object described by Wacław Sierpiński in 1915 (Fig. 7). Indeed, some of the squares of the Taj Mahal gardens are truncated such as the ones around the center or near the entrances. In that case, the plan of the Taj-Mahal displays statistical self-similarity and scale-invariance over 4 scales (see Fig. 8).

For the Sierpinski carpet (left), the starting point, or a basic unit, of the iteration process is a square divided into nine equal squares. At each scale, the middle square is removed. The process is repeated theoretically infinitely. To reproduce a simplified version of the Taj Mahal layout (right), the process is similar but the basic unit is a square divided into nine squares for which the five center squares have been removed. Although both figures are based on simple Euclidean elements, the number of elements they contain increases with each iteration at progressively decreasing scales, which makes them fractal objects.
When comparing to a plane fractal curve such as the Sierpinski carpet (Fig. 7), some similarities and differences emerge. Both the Sierpinksi carpet and the Taj Mahal blueprints represent fractals based on a simple Euclidean unit, the square, which is repeated without rotation or transformation, displaying near-perfect self-similarity. However, as a digitally created fractal, the Sierpinski carpet repeats over a larger range of scales than the gardens of the Taj Mahal and exhibits a stronger self-similarity by reproducing the pattern more consistently.

By considering the basic unit as a square divided by a right-angle cross, the global design is the result of 4 repetitions at increasingly larger scales.
Isfahan
By comparison, the gardens of Isfahan display a more subtle statistical self-similarity based on the repeated use of rectangular sections. Once again, the square (or rectangle) barred by a right-angle cross is used in several gardens, sometimes even rotated. However, the variety of shapes and proportions does not immediately reveal any scale invariance. Instead, the clearer example of scale invariance within Isfahan’s chahár-bágh avenue is the repetition of the right-angle cross in the intersection formed by the avenue crossing the river.
Fractal analysis
Each site was analyzed using the software BENOIT 1.3™ following the parameters previously presented. Table 2 shows the results of this analysis.
Another, rarely quantified, field variable is the amount of empty space included in the analysis. Since the box-counting method compares the number of pixels included in the pattern to the number of pixels included in the background, this variable can cause drastic differences in the results (Ostwald, 2013). This is sometimes expressed as “over-empty boxes” and depends on the position of the object within the overall image (Gonzato et al., 2000).
For comparison, a cropped version of the Isfahan plan (293 × 820) was analyzed as well, with a higher D = 1.83. This suggests the relatively low fractal dimension of Isfahan, compared to the Taj Mahal garden, can be explained by the white space included between its contour and the straight borders of the image (see Fig. 9).

The first image (left) is the original plan used for analysis, with D = 1.7. The second (right) the cropped version to limit the amount of background space included in the fractal analysis, which yields a higher D = 1.8.
Discussion
Results
The results of the fractal analysis of the Taj Mahal gardens confirm the estimation performed by Shishin and Ismail (2016), who also arrived at D = 1.8. Since the chahár-bágh Street of Isfahan had not been analyzed using fractal principles before, it is impossible to compare our results with others.
In his book ‘Fractal geometry in architecture and design’ Carl Bovill refers to Islamic gardens to discuss a case of non-scale invariant self-similarity. However, the example he uses is a grid-like garden with constant width of paths (Bovill, 1996). Through the visual analysis carried out here, the basic unit of the cross as a building block of the fractal layout could be revealed. Therefore, our hypothesis that historic Islamic and Persian gardens exhibit scale invariance, self-similarity, and high fractal dimensions can be supported.
The fractal characteristics of the chahár-bágh might be linked to the need to distribute water in an efficient way, following a fractal schema such as the one expressed in the biological circulatory system, or through the importance of symbolism usually attached to these gardens which are thought to be representations of the cosmos (Farahani et al., 2016). Indeed, fractals are also often related to notions of symmetry, chaos, and, through their iterative generation, of infinity.
Understanding infinity in arts, mathematics, and religion
Historically, the concept of infinity, from the Latin infinitus, meaning “endless, boundless” and then later “eternal, limitless” but also “extremely great in number” has been approached from different perspectives: one, philosophical, saw Infinity as an abstract idea whose existence could be debated, the other, religious, claimed infinity as a sign and attribute of God existing without boundary, omniscient and omnipotent. In Mathematics or Physics, infinity remains an abstract concept useful only to approximate a model of reality.
Similarly, it is important to clarify the distinction between fractals, the perfect digitally created shapes, and physical fractals which are the physical objects modeled using fractal geometry. Although the former can literally grow towards infinity, the latter can only display statistical self-similarity and is scale bound. Indeed, whereas mathematical fractals are created using recursive algorithms that repeat infinitely, thereby creating shapes that can be zoomed in infinitely, physical fractals are limited by the nature of reality and their inherent biology. As an example, a tree could not grow indefinitely without eventually struggling with distributing sap to its extremities. And if one zooms in far enough on the tree it becomes bark, then cells, then atoms, and the original structure is lost.
Visual infinity
In Art and Design, infinity cannot be directly represented—the result would be a piece of art that would itself be infinite. However, it can be suggested using the laws of Gestalt such as the law of similarity (objects similar to each other will be perceived as a group) and the law of closure which states that when parts of a pattern are missing our brain still fills in the visual gap. In other words, one only needs to see a pattern repeated over a limited number of scales to infer that repetitions carry through scales outside of the perceptual realm. In this case, the repetition itself might be perceived as a suite, a sequence, or a progression such as in the case of the Fibonnacci sequence.
A link between mathematics and religion
Throughout history, science and religion have often been at odds, with mathematicians and physicians sometimes using scientific principles to try and demonstrate (or, more recently, deny) the existence of God. This is never as clear as to when looking at the concept of infinity.
Islamic philosopher and mathematician Thabit ibn Qurra (826–901) once wondered about the number of souls created by God and whether this number was infinite yet increased with each generation (Boulanger, 2010). He is now reported to have been the first to compare potential or actual infinity and to express the existence of different sizes of infinity (Mancosu, 2009).
Several centuries later, Thomas Aquinas (1225–1274) also uses infinity as a sign of the divine, calling God “essentially infinite” and explaining, as a commentary on Job (36:26) (“How great is God—beyond our understanding!
The number of his years is past finding out.”)
“Now a created intellectual substance is finite; hence it knows in a finite way. And since God is infinite in power and being, and as a consequence is infinitely knowable, he cannot be known by any created intellect to the degree that he is knowable. And thus, he remains incomprehensible to every created intellect. ‘Behold, God is great, exceeding our knowledge’ “(Larcher et al., 2010, p. 88).
Although the previous example is rooted in Christianity, an argument can be made that all Gods are considered infinite within their religion. Indeed, to confine them to limitations and bounded space is, by definition, to reject their omnipotence and therefore question the extent of their power which in itself verges on blasphemy (Carter, 1998). To the extent that all Gods are omnipotent for their believers, they are also associated with infinity. Therefore, the presence of fractal constructs in gardens rich in religious symbolism such as the traditional chahár-bágh could be interpreted as a representation of the infinite divine.
Methodological limitations
As the first of its kind to conduct a fractal analysis of historical landscape plans, this study faced many challenges, particularly on the application of the methodology, which might be of help for future researchers.
Fractal analysis by box-counting
The box-counting method is known for having many limitations, both practical and theoretical. Specifically, it should be made clear that each method of fractal analysis will measure a different version of fractal dimensions. Indeed, some methods, such as the triangular prism method, will use a stochastic relation to estimate D, while others, such as box-counting, use a geometric relation (e.g the quantity of space filled by the object compared to the quantity of space filled by the background) (Sun et al., 2006). Since the different methods all have their own theoretical basis, they will yield different D for the same pattern to the point where comparing values obtained using different methods can be seen as “meaningless” (Sun et al., 2006, p. 4979). Some studies resolve these issues by referring to the D value calculated using the box-counting method as the “box dimension” (Chen et al., 2010, 2003; Theiler, 1990). This is effective in differentiating between the value thus calculated and the theoretical meaning of the Hausdorff dimension, of which it is meant to be an approximation (Chen et al., 2003).
According to Ostwald (2013) “all images should be converted into lines of 1px width” (p. 660). This process required a substantial interpretation of the original material (often digitized from paper copies) to decide which line should be kept. An automated thresholding segmentation will not always distinguish between ink and paper which results in blurred lines and incomplete patterns. Therefore, all digital blueprints were manually cleaned of noise in order for the fractal analysis to be carried out.
Use of historical maps
Working from historical plans presents the additional challenge of the reliability of the representation. Considerations of who drew the plan, when and for what purpose, become critical issues when considering the importance of each line. This can for example be seen in the difference between the two illustrative plans of Isfahan in Fig. 3. Moreover, the existence of readable blueprints becomes less likely once one starts going further back in time. Instead, illustrative representations, using textures for vegetation or schematized natural forms and often hand-drawn, are more common. This affects the reliability of the representation and subsequently of the analysis
Conclusion
The development of a compositional method of analysis to assess the fractal dimension of the palatial gardens of Isfahan and Taj Mahal has allowed to make up for some of the box-counting method’s limitations as a tool for the fractal analysis of real data. It has further allowed the exploration of potential metaphysical associations that such gardens can have as objects of mathematical and philosophical discussion. If we can conclude that the crude application of the box-counting method should not be dissociated from a framing visual analysis of the object at study and that this framing exercise can have deep implications in the results of such a method, we cannot dismiss that the results of this study also corroborate the hypothesis that like art and architecture, gardens might have been symbolic and mathematical exercises in the pursuit of a deeper understanding of geometrical infinity, justice in the distribution of land and resources, and a visualization of the structure of the afterlife world within an Islamic theological conception.
Paradoxically, these exercises have been explored in the realm of a royal land, a private realm of privilege which opens space for speculation or future research on the uses of these principles as blueprints for city development, and for just and fairly shared ecological infrastructures.
Data availability
The garden plans analyzed during this study are available in the Dataverse repository: https://doi.org/10.7910/DVN/MKQBHK, Harvard Dataverse, V1.
References
Abdelsalam M, Ibrahim M (2019) Fractal dimension of Islamic architecture: the case of the mameluke madrasas: Al-Sultan Hassan Madrasa. Gazi University J of Sci 32(1):27–37
Afzal O, Zaman MR, Barazangi NH (1943) The Islamic Concept of Justice. In: Afzal O, Zaman MR, Barazangi NH (eds) Islamic Identity and the Struggle for Justice. University Press of Florida, Gainesville, pp. 19–26
Ahmadi M (2016) Char Bagh Avenue, Isfahan: Genesis and Demise. Pre-Islamic and Islamic garden influences in the Safavid creation and history of its subsequent degeneration. Dissertation, Nottingham Trent University
Ashrafi N (2017) Recognition of Islamic Urbanism and Architecture with Chaos Theory and Fuzzy Rule Case Study: Yazd, Meybod, Tabriz. Sci J Nazar Res C for Art Arch Urbanism 13(43):79–94
Aljamal A, Banissi E (2003) Normalisation and Exploration Design Method of Islamic Geometric Patterns Paper presented at the International Conference on Geometric Modelling and Graphics (GMAG'03), London, 16-18 July 2003
Ben-Hamouche M (2011) Fractal Geometry in Muslim Cities: how succession law shaped morphology. Nexus Network J 13(1):235–251. https://doi.org/10.1007/s00004-011-0062-8
Ben Hamouche M (2009) Can Chaos theory explain complexity in urban fabric? Applications in traditional Muslim settlements. Nexus Network J 11(2):217–242. https://doi.org/10.1007/s00004-008-0088-8
Boulanger P (2010) Dieu et les mathématiques. In:Cohen G, Thomas E (eds) Mathématiques et Philosophie: En quête de vérité. HS Tangente, Editions Pole, Combon, pp. 98–101
Bonner J (2003) Three traditions of self-similarity in fourteenth and fifteenth century Islamic geometric ornament. Paper presented at the 6th Annual ISAMA-Bridges Conference, University of Granada, 23–25 July 2003
Bovill C (1996) Fractal geometry in architecture and design. Birkhauser Boston
Carter MG (1998) Infinity and lies in medieval Islam. In:Vermeulen U, Smet D (eds) Philosophy and Arts in the Islamic World: Proceedings of the Eighteenth Congress of the Union Européenne Des Arabisants Et Islamisants. Peeters Publishers, Leuven, p. 233
Chen SS, Keller JM, Crownover RM (1993) On the calculation of fractal features from images. IEEE Trans Pattern Anal Machine Intell 15(10):1087–1090
Chen W, Chen XX, Zhou L (2010) Box-counting dimension analysis of edge images detected with classical edge detector. In: Lee K, Wu Y, Hou Z (eds) 2010 International Conference on Measuring Technology and Mechatronics Automation. IEEE, Changsha, pp. 756–758
Chen WS, Yuan SY, Hsieh CM (2003) Two algorithms to estimate fractal dimension of gray-level images. Optical Eng 42(8):2452–2464. https://doi.org/10.1117/1.1585061
Clark E (1996) Underneath which rivers flow: the symbolism of The Islamic Garden. The Prince of Wales’s Institute of Architecture, London
Clark E (2004) The art of the Islamic Garden. Crowood Press, Wiltshire
Cooper J, Oskrochi R (2008) Fractal analysis of street vistas: a potential tool for assessing levels of visual variety in everyday street scenes. Environ Plann B 35(2):349–363
Cressey GB (1958) Qanats, Karez, and Foggaras. Geo Rev 48(1):27–44
Di Leva A (2016) The Fractal Geometry of the Brain. Springer Series in Computational Neuroscience. Springer New York, New York
Djibril MO, Thami ROH (2008) Islamic geometrical patterns indexing and classification using discrete symmetry groups. J on Comp and Cul Her 1(2):1–14
Drozdek A (1995) Beyond infinity: Augustine and Cantor. Laval Théologique et Philosophique 51(1):127–140
Faghih N, Sadeghy A (2012) Persian gardens and landscapes. Archit Design 82(3):8–51. https://doi.org/10.1002/ad.1403
Fairchild Ruggles D (2008) Islamic gardens and landscapes. University of Pennsylvania Press, Philadelphia
Farahani LM, Motamed B, Jamei E (2016) Persian gardens: Meanings, symbolism, and design. Landsc Online 46:1–19
Flegg G (1983) Numbers: their history and meaning. Andre Deutsch, London, p 251–272
Gonzato G, Mulargia F, Ciccotti M (2000) Measuring the fractal dimensions of ideal and actual objects: implications for application in geology and geophysics. Geophys J Inter 142(1):108–116
Hunar VF (1976) Isfahan: The City of Light. Ministry of Culture and Art of Iran and The British Museum
Jellicoe G, Jellicoe S (1987) The landscape of man: shaping the environment from prehistory to the present day. Thames and Hudson, New York
Kenkel NC, Walker D (1996) Fractals in the biological sciences. Coenoses 11:77–100
Khamjane A, Benslimane R (2017) Golden mean, fractals and islamic geometric patterns. Front Sci Eng 7(1):5–17
Kian Z, Amiriparyan P (2016) The structural and spatial analysing of fractal geometry in organizing of iranian traditional. Architecture 216:766–777
Larcher F, Weisheipl J, Keating D, Levering M (2010) Commentary on the Gospel of John: Chapters 1-5. Catholic University of America Press, Washington, D.C.
Lorimer ND, Haight RG, Leary, RA (1994) The Fractal Forest: Fractal geometry and applications in forest science. North Central Forest Experimental Station. General technical Report NC –170. United States Department of Agriculture
Lu S (2010) Hidden orders in Chinese gardens: Irregular fractal structure and its generative rules. Environ Plann B 37(6):1076–1094. https://doi.org/10.1068/b36042
Mancosu P (2009) Measuring the size of infinite collections of natural numbers: Was Cantor’s theory of infinite number inevitable? Rev Symbolic Logic 2(4):612–646
Mandelbrot BB (1989) Fractal geometry: what is it, and what does it do? Proc R Soc London 423(1864):3–16
Mandelbrot BB (1975) Les Objet Fractals: Forme, Hasard et Dimension. Flammarion, Paris
Menninger K (1958) Number Words and Number Symbols: A Cultural History of Numbers. 2nd edn. MIT Press, pp. 171–188
Moore AW (1995) A brief history of infinity. Sci Am 272(4):112–116
Moynihan EB (1979) Persia and Mughal India. Scolar Press, London
Ostwald MJ (2013) The fractal analysis of architecture: calibrating the box-counting method using scaling coefficient and grid disposition variables. Environ Plann B 40:644–663
Patuano A, Tara A (2020) Fractal geometry for landscape architecture: review of methodologies and interpretations. J Digital Land Arch 5:72–80
Perry SG, Reeves RW, Sim JC (2008) Landscape design and the language of nature. Landsc Rev 12(2):3–18
Pinder-Wilson R (1976) The Persian Garden: Bagh and Chahar Bagh. In:Macdougall E, Ettinghausen R (eds) The Islamic Garden. Dumbarton Oaks, Washington, D. C., pp. 71–85
Pudine H (2016) A study on dimensions of Fractal geometry in Iranian architecture. Urban Manag 15(42):257–267
Redies C, Brachmann A (2017) Statistical image properties in large subsets of traditional art, bad art, and abstract art. Front Neurosci 593:1–15. 11
Schimmel A (1976) The Celestial Garden in Islam. In: Macdougall E, Ettinghausen R (eds) The Islamic Garden. Dumbarton Oaks, Washington, DC, p 11–39
Schimmel A (1985) The water of life. J Islamic Env Design Res Centre 2(2):6–9
Shishin MY, Aldeen Ismail KJ (2016) A method of compositional fractal analysis and its application in Islamic architectural ensembles. Math Edu 11(5):1087–1100
Shankland G (1967) The planning of Isfahan. UNESCO, London
Sun W, Xu G, Gong P, Liang S (2006) Fractal analysis of remotely sensed images: a review of methods and applications. Inter J Remote Sens 27(22):4963–4990
Theiler J (1990) Estimating fractal dimension. J Optical Soc Am A 7(6):1055–1073
Tillotson G (2008) Taj Mahal. Profile Books, London
Trancik R (1986) Finding lost space: theories of urban design. Van Nostrand Reinhold Company, New York
Van Tonder G, Lyons M, Ejima Y (2002) Visual structure of a Japanese Zen garden. Nature 419:359–360. https://doi.org/10.1038/419359a
Walcher H (1998) Between paradise and political capital: the semiotics of Safavid Isfahan. Middle Eastern Nat Env 103:330–348
Webster P (2013) Fractal Islamic Geometric Patterns Based on Arrangements of {n/2} Stars. Paper presented at the 5th Bridges Conference, Mathematics, Music, Art, Architecture, Culture, Enschede, 27–31 July 2013
Welch A (1974) Shah’Abbas and the Arts of Isfahan. Asia Society Inc, New York
Wescoat JL (1995) From the gardens of the Qur’an to the “gardens” of Lahore. Lands Res 20(1):19–29. https://doi.org/10.1080/01426399508706451
West G (2018) Scale: The universal laws of life and death in organisms, cities and companies. Weidenfeld & Nicolson, London
Yu R, Ostwald MJ, Gu N (2015) Parametrically generating new instances of traditional Chinese private gardens that replicate selected socio-spatial and aesthetic properties. Nexus Network J 17(3):807–829. https://doi.org/10.1007/s00004-015-0263-7
Acknowledgements
The authors wish to thank the University of Edinburgh for the financial support to visit the Bodleian Library for archival work. An early draft of this paper was presented at the OPENspace research seminar at the University of Edinburgh and we appreciated comments from our audience, particularly from Prof. Catharine Ward Thompson and Ph.D. candidate Graham Shawcross as they contributed to this final version. We also extend our gratitude to Dr. Azadeh Arjomand Kermani from the TUDelft for her time and insightful comments on the tradition of Persian gardens. Finally, our thanks go to our English proof-reader Mark Phimister.
Author information
Authors and Affiliations
Corresponding author
Ethics declarations
Competing interests
The authors declare no competing interests.
Additional information
Publisher’s note Springer Nature remains neutral with regard to jurisdictional claims in published maps and institutional affiliations.
Rights and permissions
Open Access This article is licensed under a Creative Commons Attribution 4.0 International License, which permits use, sharing, adaptation, distribution and reproduction in any medium or format, as long as you give appropriate credit to the original author(s) and the source, provide a link to the Creative Commons license, and indicate if changes were made. The images or other third party material in this article are included in the article’s Creative Commons license, unless indicated otherwise in a credit line to the material. If material is not included in the article’s Creative Commons license and your intended use is not permitted by statutory regulation or exceeds the permitted use, you will need to obtain permission directly from the copyright holder. To view a copy of this license, visit http://creativecommons.org/licenses/by/4.0/.
About this article

Cite this article
Patuano, A., Lima, M.F. The fractal dimension of Islamic and Persian four-folding gardens. Humanit Soc Sci Commun 8, 86 (2021). https://doi.org/10.1057/s41599-021-00766-1
Received:
Accepted:
Published:
DOI: https://doi.org/10.1057/s41599-021-00766-1
