
Abstract
Existing formulas cannot fully explain the variation of resting metabolic rate (RMR). This study aims to examine potential influencing factors beyond anthropometric measurements and develop more accurate equations using accessible parameters. 324 healthy adults (230 females; 18–32 years old) participated in the study. Height, fat-free mass (FFM), fat mass (FM) and RMR were measured. Menstrual cycle, stress levels, living habits, and frequency of consuming caffeinated foods were collected. Measured RMR were compared with predictive values of the new equations and previous 11 equations. Mean RMR for men and women was 1825.2 ± 248.8 and 1345.1 ± 178.7 kcal/day, respectively. RMR adjusted for FFM0.66FM0.066 was positively correlated with BMI. The multiple regression model showed that RMR can be predicted in this population with model 1 (with FFM, FM, age, sex and daily sun exposure duration) or model 2 (with weight and height replacing FFM and FM). The accuracy was 75.31% in the population for predictive model 1 and 70.68% for predictive model 2. The new equations had overall improved performance when compared with existing equations. The predictive formula that consider daily sun exposure duration improve RMR prediction in young adults. Additional investigation is required among individuals in the middle-aged and elderly demographic.
Introduction
Alarming statistics show that the number of people affected by excessive weight has surpassed 2 billion, representing approximately 30% of the world’s population1. The balance between total energy expenditure (TEE) and energy intake determines body mass2. The accurate determination of TEE is important for establishing dietary intake goals in weight management of normal weight and obese individuals.
TEE is the sum of resting metabolic rate (RMR), physical activity energy expenditure, and the thermic effect of food. RMR accounts for 60–70% of the total daily energy expenditure3. Indirect calorimetry (IC) is considered the reference method for determining the RMR by measuring O2 consumption and CO2 production4. However, due to its strict evaluation conditions, high cost, time it requires (30–50 min), and lack of portability, the application of IC is limited.
Consequently, several predictive equations have been developed to estimate RMR as an alternative to directly measuring RMR5,6,7,8,9, These equations utilize various anthropometric parameters, including age, body weight, height, sex, and fat-free mass (FFM). Since the majority of RMR predictive equations were proposed decades ago and based on specific individual cohorts with different biological and metabolic characteristics from those of the current population, it is not possible to accurately obtain all individuals’ RMR by using a single standard prediction equation10.
What is more, these variables can account for only approximately 70% of the variation in RMR between individuals11. A few studies have explored the relationship between vitamin D, stress, physical activity, menstrual cycle, smoking, drinking, bedtime, measuring seasons, diet and RMR12,13,14,15,16,17,18. These factors may affect resting metabolism and contribute to unexplained variation. To date, no studies have taken these factors into account simultaneously.
Therefore, this study aims to examine potential influencing factors beyond age, body weight, height, sex, and FFM, and develop more accurate equations in a sample of adults using accessible parameters.
Methods
Participants
We first used the statistical formula [n = (Uα × σ/δ)2] to calculate the lowest sample size. In the formula, α was significant level and the value was 0.05, and U value was 1.96; σ represented the standard deviation of RMR, for which we referred to values reported by previous Chinese studies19; δ was acceptable error. By the calculation, the lowest number was 276. A cross-sectional study was conducted between May 2022 and October 2023. Participants were recruited through advertisements. Inclusion criteria were college students (including undergraduate students) in Jiangning District. Exclusion criteria included having diseases that could affect the measurement of gas exchange and body metabolism, such as asthma and chronic obstructive pulmonary disease. Before participation, each individual received comprehensive information about the nature and purpose of the study and provided written consent. Informed consent was obtained from all subjects and/or their legal guardian(s). The study was conducted in accordance with the Declaration of Helsinki, and was approved by the Ethics Committee of Nanjing Medical University (Ethical code: 2022-680).
Questionnaire/demographic data
Demographic data were collected using a questionnaire, completed online by participants the day before the measurement. The responses were carefully reviewed by researchers prior to the actual measurements. The collected information included sex, age, menstrual cycle, health condition, stress levels, physical activity, daily sun exposure duration (less than 15 min/day, 15–30 min/day, 31–45 min/day and more than 45 min/ day), frequency of sun protection (never, sometimes, often and always), bedtime (before 23 p.m., 23–24 p.m. and after 24 p.m.), and the frequency of consuming caffeinated foods. The menstrual phase was reported by each woman. The luteal phase was the 14 days before the next menses. The follicular phase was the time from the first day post-menses to the day before luteal phase. Questions related to the level of physical activity were derived from the Chinese version of the International Physical Activity Questionnaire (IPAQ)20. Similarly, short-term and chronic stress were evaluated using a 10-item Chinese version of the Perceived Stress Scale (PSS) and the short version of the Trier Inventory for Chronic Stress (TICS), respectively21,22.
Anthropometric measurements
Participants were instructed to visit the Sir Run Run Hospital (Jiangsu, China) following a minimum 10 h fasting period, during which they refrained from consuming any stimulant substances (e.g., caffeine, tobacco) for at least 4 h. Additionally, participants were required to abstain from engaging in vigorous physical activity for 24 h prior to their visit23. All measurements were performed between 8:00 and 10:30 in the morning.
Height was measured in duplicate to the nearest 0.1 cm using an ultrasonic stadiometer (EH201R, Xiangshan, Guangdong, China). All subjects were asked to remove their shoes, socks and any heavy clothing. Body composition was assessed by bioelectrical impedance analysis (MC-780MA, TANITA, Tokyo, Japan). After inputting the gender, age, and height data into the device and applying weight adjustment for clothing, participants were instructed to stand barefoot on the analyzer and grip the handles. The recorded measurements included weight (kg), fat mass (FM, kg), and FFM (kg). Body mass index (BMI) was calculated as body weight (kg) divided by squared height (m2). BMI was categorized according to the classification criteria of the World Health Organization.
RMR measurement and prediction
RMR was assessed using indirect calorimetry (Quark PFT, COSMED, Rome, Italy). On each testing day, a 30 min warm-up time for the system was required. Before the measurement, the researcher performed flowmeter and gas calibrations following the instructions of the manufacturer’s instructions. Participants were asked to stay awake in a supine position with a canopy system after a 20 min rest. Oxygen consumption (VO2) and carbon dioxide production (VCO2) were measured at 10 s intervals for 15 min, and values from the first 5 min were discarded24,25. Data of VCO2 and VO2 during the first 5 min period with the lowest coefficient of variance (CV) from RMR were averaged and used in the analysis. RMR was calculated using the Weir’s equation26. All participants were measured by the same researcher. We excluded RMR data from the analysis if the respiratory quotient (RQ) was outside the expected range (0.70–1) and when the measured RMR was more than ± 3 standard deviations from the mean RMR. Considering that weight is the major determinant of RMR and the components of weight (i.e. FM and FFM) contribute unequally to RMR, RMR indexed to [FFM0.66 × FM0.066] was calculated to find the association between BMI and RMR27. RMR was estimated for each subject using the following predictive equations: Mifflin et al., HB (Harris & Benedict), Owen, Müller, Liu, Yang, Singapore, Xue and Wang equations5,6,7,8,9,19,28,29,30,31. These equations are either widely used in China or established based on Chinese population data. Müller and Xue equations were further categorized into Müller_W, Müller_BC, Xue_W and Xue_BC according to the different parameters (weight or body composition parameters) they use.
Statistical analysis
Statistical analyses were performed using SPSS 21. Visual inspection of normal Q–Q plots and skewness/kurtosis values were used to determine whether the parameters were normally distributed. Descriptive data were presented as mean ± SD, median (25th–75th percentile) or n (%) where appropriate.
Univariate associations between potential influencing factors and RMR were explored by simple linear regression to identify predictors for inclusion in multivariate regression modeling with backward selection. Measured and predicted RMR were compared at a group level using a paired t-test. The percentage of participants whose predicted RMR value was within 90–110% of the measured RMR was defined as a precise measurement. Overestimation and underestimation were defined as > 110% and < 90% of measured RMR, respectively, and were reported as percentage of subjects. Bland and Altman plots and the intraclass correlation coefficient (ICC) were used to assess the agreement between the RMR estimated by the proposed equation and the RMRIC. The threshold for significance in all tests was set at P < 0.05 (two sided).
Results
Population characteristics
A total of 324 participants (94 males and 230 females) were included in this analysis. Table 1 summarizes the demographic, anthropometric, and body composition variables. All subjects were between 18 and 32 years old. Overall, 228 (70.4%) were normal weight, 2 (0.6%) were smokers and 16 (4.9%) were drinkers.
Mean RMR for men and women was 1825.2 ± 248.8 and 1345.1 ± 178.7 kcal/day, respectively (Table 2). Males have higher RMR/Wt and RMR/FFM0.66FM0.066 values, while females have higher RMR/FFM values. RMR and RMR adjusted for FFM0.66FM0.066 were positively correlated with BMI (Fig. 1). When normalizing RMR by body weight, RMR decreased significantly as BMI increased. After adjusting for FFM, the association was not significant.
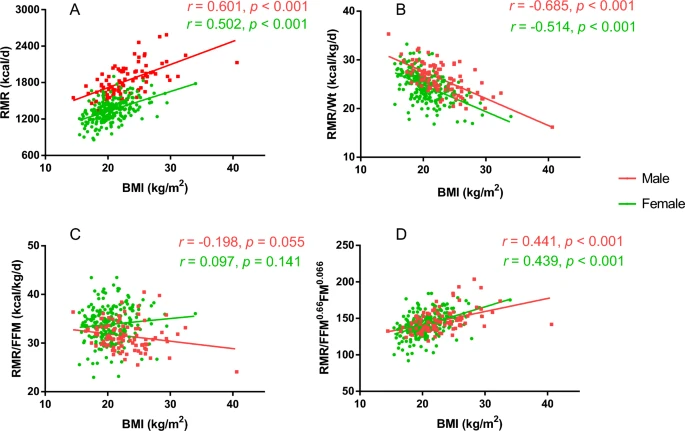
Association between BMI and RMR (A), RMR/Wt (B), RMR/FFM (C) and RMR/FFM0.66FM0.066 (D). RMR resting metabolic rate, Wt weight, FM fat mass, FFM fat-free mass, BMI body mass index.
Developing new predictive equations
RMR was selected as the dependent variable, and all variables presented in Table 1 as independent variables. A univariate regression analysis was conducted for each variable (Table 3). The results indicate that, in addition to height, weight, FM, FFM and BMI, daily sun exposure duration, frequency of sun protection, physical activity and the consumption frequency of tea beverages, tea with milk, cola and functional drinks were found to be significant.
The significant variables were included in the multiple regression analysis model. Additionally, weight and body composition parameters (FM and FFM) were entered into two separate models. The results are presented below:
Validation of predictive equations
The validation results of the newly developed equation are presented in Table 4. Most of the other equations underestimated RMR, except for the equations by HB and Xue. The newly developed predictive formulas showed the lowest RMSE value of 141.63 kcal (Model 1) and the highest ICC (0.871). The Xue equation, which integrated body composition parameters, displayed the highest bias.
The percentages of underestimated, accurate, and overestimated subjects for each equation are presented in Fig. 2. Among the thirteen equations, the highest accuracy rate was produced by the newly developed equation (75.31%). Other equations demonstrating relatively high accuracy rates included Mifflin, HB, and Müller_W (70.68%, 70.37% and 70.06%, respectively); however, they exhibited elevated rates of underestimation or overestimation. The overestimation rate of HB was 20.99%, and the underestimation rates of Mifflin and Müller_W were both 19.44%. It is worth highlighting that the Singapore equation yielded the highest underestimation rate (65.74%). The Xue_BC equation provided the lowest accuracy rate (30.25%) and the highest overestimation rate (68.52%).

Accuracy of prediction equations for measurements of resting metabolic rate within ± 10%.
Lastly, the Bland–Altman plots were used to assess the agreement between pRMR and mRMR. Figure 3 shows that the new equations had the best agreement. Our mean bias was closest to X-axis, while Xue_BC’s value was − 210.2 kcal/day away from X-axis. The 95% limits of agreement for the other equations were wider, with the Yang equation exhibiting the largest values (− 236.8 to 442.4 kcal/day). New equations appear to offer a more accurate prediction of RMR.

Bland–Altman plots for selected resting metabolic rate (RMR) predictive equations. The red dashed lines represent the mean difference (BIAS) between predicted and measured RMR. The upper and lower blue dashed lines represent the 95% limits of agreement. The X-axis represents the mean of mRMR and pRMR. The Y-axis represents the difference between mRMR and pRMR.
Discussion
The present study generated two models that provide the best prediction of RMR. Model 1 includes age (years), sex, FFM (kg), FM (kg) and daily sun exposure duration as predictors, with an R2 value of 0.772. Considering that body composition parameters are not always available, model 2 was devised by substituting body weight for FM and FFM. Since the previous equations tended to either overestimate or underestimate RMR, they cannot accurately predict the RMR of Chinese young adults.
In several cases, researchers divide RMR by the body weight of individuals to standardize possible variations due to body size32. However, this approach has been a subject of debate over the years, due to the unequal contributions of FM and FFM to RMR. FFM has been established as more metabolically active than fat mass. Thus, normalization of RMR by FFM is widely used and considered superior to division by body weight. Nevertheless, it is crucial to recognize that adipose tissue has a mass-specific metabolic rate of 4.5 kcal/kg/day33. Using FFM alone for normalization may be inadequate in light of this fact. Francois Haddad et al.27 indicated that RMR indexed to [FFM0.66 × FM0.066] is body size and sex independent, in contrast to body weight-based indexing, which demonstrates a significant inverse relationship to body weight. In the present study, RMR/FFM0.66FM0.066 increased as BMI went up, which contradicts the common view that people with higher BMI tend to have lower RMR.
The accuracy rates of our models are 75.31% and 72.22%, which are higher than those validated by Xue (70% and 62.5%) and Wang (31.5%) validated in their respective populations19,31. Among the pre-existing equations, the Mifflin, HB and Müller equations provided the highest percentage of accurate predictions (70.68%, 70.37% and 70.06%, respectively). However, it is noteworthy that these equations exhibited higher rates of overestimation or underestimation compared to our models. Meanwhile, we found that the selected Chinese equations provided inaccurate predictions. The accuracy rates of four selected Chinese equations were lower than 50%. The highest overestimation and underestimation rates were both higher than 60%, provided by the Xue and Singapore equation, respectively.
The observation that the prediction equation in this study explains a higher amount of variance compared to many previous studies suggests a notable improvement in the accuracy of RMR prediction. This may be explained by the fact that most of the predictive equations that have been widely used for RMR assessment are based on anthropometric variables. Multiple linear regression analysis revealed that including the duration of daily sun exposure increases the R2. This might suggest that daily exposure to sunlight may help explain the variation of RMR.
Daily sun exposure duration, which reflects vitamin D levels, emerged as an independent predictor of RMR in our study. This was similar to the results reported by Calton et al.12. Another study showed the mediating effect of vitamin D receptor gene expression in the association between 25(OH)2D plasma levels and RMR34. An increase in vitamin D levels may be associated with a decrease in RMR/kg body weight. Furthermore, it is essential to acknowledge that vitamin D supplementation also influences vitamin D levels. However, it was not included in the final model, probably due to its low consumption rate in our study.
Other demographic information we collected was not included in the final equation, probably because the frequency of some variables is low in our population. For example, participants rarely consume cigarettes, alcohol and tea compared to older people35. We speculate that these factors may play an important role in other populations.
To our knowledge, it is the first to take such variables into account. We have comprehensively considered various factors, including vitamin D levels, stress, physical activity, menstrual cycle, smoking, drinking, bedtime, measuring seasons and frequency of consuming caffeinated foods. The study has several limitations that should be acknowledged. First, serum 25(OH)D levels are not evaluated from blood samples. However, a study discovered that sunlight exposure is associated with serum 25(OH)D levels36. In addition, daily sun exposure duration is readily available. Second, the age range is narrow and older people are not taken into account. Third, some variables relied upon self-report with recall bias. Fourth, the duration of the RMR measurement was shorter (15 min). As Popp25 found that 87% of participants reached the most stable 5 min within the first 10 min (6–15 min) and recommended a simplified protocol that includes 5 min stabilization period, and 10 min measurement window. This is very helpful in improving compliance of participants. Future research that encompasses a broader age spectrum could provide valuable insights into how these factors interact across different age groups and contribute to RMR variations.
Conclusions
In conclusion, the equation developed in this study exhibits a relatively better accuracy compared to previous equations, making it a promising tool for predicting RMR in young Chinese participants, especially with the inclusion of daily sun exposure duration as a predictor. The potential utility of this equation could be further enhanced through ongoing validation across diverse regions and extended to middle aged and elderly populations.
Data availability
The data that support the findings of this study are available upon reasonable request to the corresponding author.
References
Cuciureanu, M. et al. 360-Degree perspectives on obesity. Med. Lith. 59, 1119 (2023).
Fernández Verdejo, R. & Galgani, J. E. Predictive equations for energy expenditure in adult humans: From resting to free-living conditions. Obesity (Silver Spring, Md.) 30, 1537–1548 (2022).
Amaro-Gahete, F. et al. Congruent validity of resting energy expenditure predictive equations in young adults. Nutrients 11, 223 (2019).
Matarese, L. E. Indirect calorimetry. J. Am. Diet. Assoc. 97, S154–S160 (1997).
Harris, J. A. & Benedict, F. G. A biometric study of human basal metabolism. Proc. Natl. Acad. Sci. U.S.A. 4, 370–373 (1918).
Owen, O. E. et al. A reappraisal of caloric requirements in healthy women. Am. J. Clin. Nutr. 44, 1–19 (1986).
Owen, O. E. et al. A reappraisal of the caloric requirements of men. Am. J. Clin. Nutr. 46, 875–885 (1987).
Muller, M. J. et al. World health organization equations have shortcomings for predicting resting energy expenditure in persons from a modern, affluent population: Generation of a new reference standard from a retrospective analysis of a German database of resting energy expenditure. Am. J. Clin. Nutr. 80, 1379–1390 (2004).
Mifflin, M. D. et al. A new predictive equation for resting energy expenditure in healthy individuals. Am. J. Clin. Nutr. 51, 241–247 (1990).
Mao, Q. et al. Basal energy expenditure of Chinese healthy adults: Comparison of measured and predicted values. Biomed. Environ. Sci. 33, 566–572 (2020).
Pavlidou, E., Papadopoulou, S. K., Seroglou, K. & Giaginis, C. Revised Harris-benedict equation: New human resting metabolic rate equation. Metabolites 13, 189 (2023).
Calton, E. K. et al. Vitamin D status and insulin sensitivity are novel predictors of resting metabolic rate: A cross-sectional analysis in Australian adults. Eur. J. Nutr. 55, 2075–2080 (2016).
van der Kooij, M. A. The impact of chronic stress on energy metabolism. Mol. Cell Neurosci. 107, 103525 (2020).
Auvichayapat, P. et al. Effectiveness of green tea on weight reduction in obese Thais: A randomized, controlled trial. Physiol. Behav. 93, 486–491 (2008).
Careau, V. et al. Energy compensation and adiposity in humans. Curr. Biol. 31, 4659–4666 (2021).
Zitting, K. et al. Human resting energy expenditure varies with circadian phase. Curr. Biol. 28, 3685–3690 (2018).
Tanaka, N. et al. Relationship between seasonal changes in food intake and energy metabolism, physical activity, and body composition in young Japanese women. Nutrients 14, 506 (2022).
Gould, L. M. et al. Impact of follicular menstrual phase on body composition measures and resting metabolism. Med. Sci. Sports Exerc. 53, 2396–2404 (2021).
Xue, J., Li, S., Zhang, Y. & Hong, P. Accuracy of predictive resting-metabolic-rate equations in Chinese mainland adults. Int. J. Environ. Res. Public Health 16, 2747 (2019).
Craig, C. L. et al. International physical activity questionnaire 12-country reliability and validity. Med. Sci. Sports Exerc. 35, 1381–1395 (2003).
Cohen, S. & Williamson, G. M. Perceived Stress in a Probability Sample of the United States, The Social Psychology of Health: Claremont Symposium on Applied Social Psychology (1988).
Petrowski, K. et al. Psychometric properties of an English short version of the trier inventory for chronic stress. BMC Med. Res. Methodol. 20, 306 (2020).
Fullmer, S. et al. Evidence analysis library review of best practices for performing indirect calorimetry in healthy and non-critically III individuals. J. Acad. Nutr. Diet. 115, 1417–1446 (2015).
Sanchez-Delgado, G. et al. Reliability of resting metabolic rate measurements in young adults: Impact of methods for data analysis. Clin. Nutr. 37, 1618–1624 (2018).
Popp, C. J. et al. Evaluating steady-state resting energy expenditure using indirect calorimetry in adults with overweight and obesity. Clin. Nutr. 39, 2220–2226 (2020).
JB, W. New methods for calculating metabolic rate with special reference to protein metabolism. J. Physiol. 109, 1–9 (1949).
Haddad, F. et al. Challenging obesity and sex based differences in resting energy expenditure using allometric modeling, a sub-study of the dietfits clinical trial. Clin. Nutr. ESPEN 53, 43–52 (2023).
Liu, H., Lu, Y. & Chen, W. Predictive equations for basal metabolic rate in Chinese adults: A cross-validation study. J. Am. Diet. Assoc. 95, 1403–1408 (1995).
Yang, X. et al. Basal energy expenditure in southern Chinese healthy adults: Measurement and development of a new equation. Br. J. Nutr. 104, 1817–1823 (2010).
Camps, S. G., Wang, N. X., Tan, W. S. & Henry, C. J. Estimation of basal metabolic rate in Chinese: Are the current prediction equations applicable? Nutr. J. 15, 79 (2016).
Wang, X. et al. Predictive equation for basal metabolic rate in normal-weight Chinese adults. Nutrients 15, 4185 (2023).
Macena, M. D. L. & Bueno, N. B. Letter to the editor: The use of resting energy expenditure divided by body weight (Kcal/Kg) may yield inconsistencies and should be avoided. Clin. Nutr. 42, 609–610 (2023).
Heymsfield, S. B., Thomas, D. M., Bosy-Westphal, A. & Müller, M. J. The anatomy of resting energy expenditure: Body composition mechanisms. Eur. J. Clin. Nutr. 73, 166–171 (2019).
Sajjadi, S. F., Mirzaei, K., Khorrami-Nezhad, L., Maghbooli, Z. & Keshavarz, S. A. Vitamin D status and resting metabolic rate may modify through expression of vitamin D receptor and peroxisome proliferator-activated receptor gamma coactivator-1 alpha gene in overweight and obese adults. Ann. Nutr. Metab. 72, 43–49 (2018).
Xu, C. et al. Long-term tea consumption is associated with reduced risk of diabetic retinopathy: A cross-sectional survey among elderly Chinese from rural communities. J. Diabetes Res. 2020, 1–10 (2020).
Mansibang, N. M. M., Yu, M. G. Y., Jimeno, C. A. & Lantion-Ang, F. L. Association of sunlight exposure with 25-hydroxyvitamin D levels among working urban adult filipinos. Osteoporos. Sarcopenia 6, 133–138 (2020).
Acknowledgements
The authors thank all participants in the study for their support and cooperation during data collection.
Funding
This study was supported by Public health project of Gusu School (NO.: GSKY20230301), the Key research project of Jiangsu Provincial Health Science and Technology Commission (NO.: ZD2022046) and Key R&D Plan Social Development General Project of Jiangsu Provincial Department of Science and Technology (NO.: BE2023837).
Author information
Authors and Affiliations
Contributions
Conceptualization, W.Z., H.S., H.W and M.Z..; methodology, W.Z., H.S., J.T., B.W and P.C.; formal analysis, W.Z. and W.D.; investigation, W.Z., H.S., and J.T.; resources, P.C., M.Z. and H.W.; data curation, W.Z. and W.D.; writing—original draft preparation, W.Z., J.T. and W.D.; writing—review and editing,B.W, P.C., H.W. and M.Z.; supervision, H.W. and M.Z.; project administration, H.W. and M.Z. All authors have read and agreed to the published version of the manuscript.
Corresponding authors
Ethics declarations
Competing interests
The authors declare no competing interests.
Additional information
Publisher's note
Springer Nature remains neutral with regard to jurisdictional claims in published maps and institutional affiliations.
Rights and permissions
Open Access This article is licensed under a Creative Commons Attribution 4.0 International License, which permits use, sharing, adaptation, distribution and reproduction in any medium or format, as long as you give appropriate credit to the original author(s) and the source, provide a link to the Creative Commons licence, and indicate if changes were made. The images or other third party material in this article are included in the article's Creative Commons licence, unless indicated otherwise in a credit line to the material. If material is not included in the article's Creative Commons licence and your intended use is not permitted by statutory regulation or exceeds the permitted use, you will need to obtain permission directly from the copyright holder. To view a copy of this licence, visit http://creativecommons.org/licenses/by/4.0/.
About this article

Cite this article
Zhou, W., Su, H., Tong, J. et al. Multiple factor assessment for determining resting metabolic rate in young adults. Sci Rep 14, 11821 (2024). https://doi.org/10.1038/s41598-024-62639-2
Received:
Accepted:
Published:
DOI: https://doi.org/10.1038/s41598-024-62639-2
Comments
By submitting a comment you agree to abide by our Terms and Community Guidelines. If you find something abusive or that does not comply with our terms or guidelines please flag it as inappropriate.
