
Abstract
Previous studies have found associations between the incidence of metabolic syndrome (MetS) and exposure to air pollution or road traffic noise. However, investigations on environmental co-exposures are limited. This study aimed to investigate the association between co-exposure to air pollution and road traffic noise and MetS and its subcomponents. Participants living in Taipei City who underwent at least two health checkups between 2010 and 2016 were included in the study. Data were sourced from the MJ Health database, a longitudinal, large-scale cohort in Taiwan. The monthly traffic noise exposure (Lden and Lnight) was computed using a dynamic noise map. Monthly fine particulate data at one kilometer resolution were computed from satellite imagery data. Cox proportional hazards regression models with month as the underlying time scale were used to estimate hazard ratios (HRs) for the impact of PM2.5 and road traffic noise exposure on the risk of developing MetS or its subcomponents. Data from 10,773 participants were included. We found significant positive associations between incident MetS and PM2.5 (HR: 1.88; 95% CI 1.67, 2.12), Lden (HR: 1.10; 95% CI 1.06, 1.15), and Lnight (HR: 1.07; 95% CI 1.02, 1.13) in single exposure models. Results further showed significant associations with an elevated risk of incident MetS in co-exposure models, with HRs of 1.91 (95% CI 1.69, 2.16) and 1.11 (95% CI 1.06, 1.16) for co-exposure to PM2.5 and Lden, and 1.90 (95% CI 1.68, 2.14) and 1.08 (95% CI 1.02, 1.13) for co-exposure to PM2.5 and Lnight. The HRs for the co-exposure models were higher than those for models with only a single exposure. This study provides evidence that PM2.5 and noise exposure may elevate the risk of incident MetS and its components in both single and co-exposure models. Therefore, preventive approaches to mitigate the risk of MetS and its subcomponents should consider reducing exposure to PM2.5 and noise pollution.
Introduction
Metabolic syndrome (MetS) is a global public health concern because it increases the risk of many chronic diseases, including cardiovascular disease (CVD), type-2 diabetes, hypertension, and certain cancers. MetS is defined as a cluster of the following five conditions: abdominal obesity, high blood pressure, impaired fasting glucose, high triglycerides, and low high-density lipoprotein (HDL) cholesterol. It is diagnosed when at least three of these conditions are present. Metabolic and behavioral risk factors, including age, sex, genetics, race, ethnicity, and lifestyle factors, such as physical activity and socioeconomic status, are the most common causes of MetS1,2,3.
Environmental pollution dates back to the onset of urbanization. While urbanization has benefits, such as improved employment opportunities, quality of life, and access to higher education and health services, it also has disadvantages, such as increased exposure to various environmental pollutants. Environmental pollution results directly from intensive traffic, construction, and industrial activity. These factors can combine and sometimes act synergistically to cause vascular dysfunction and metabolic abnormalities, critically affecting the health and well-being of city residents4.
Air and noise pollution are the most common environmental risk factors that residents encounter in urban areas and have been linked to metabolic disorders that are prodromal to many chronic diseases5,6,7. Air pollution, which is considered the largest single environmental risk factor for pollution-related adverse health outcomes, has drawn significant public health concern globally8,9. More than 80% of the world’s population lives in areas where particulate levels equal or exceed the thresholds recommended by the World Health Organization10. Previous studies have indicated that long-term exposure to ambient air pollutants, including PM2.5, could increase the risk of MetS11,12,13. Increased exposure to PM2.5 has also been found to contribute to increased incidences or prevalence of obesity14,15, diabetes16,17,18, hypertension19,20,21, dyslipidemia22,23 and low HDL24,25.
Noise is the second most significant environmental threat to health, with exposure to environmental noise causing 12,000 premature deaths annually and contributing to 48,000 new cases of ischemic heart disease in Europe26. Several large-scale cohort studies have shown that long-term exposure to excessive noise influences environmental changes and the quality of life or health of human beings. A nationwide cohort study in Switzerland found that traffic noise may increase the hazard risk of mortality by approximately 2–5%, and also observed elevated risks related to CVD, heart failure, blood pressure, ischemic stroke, and myocardial infarction27. They also investigated the diurnal variability of transportation noise and mortality and reported the highest hazard ratio for core night hours (1:00–5:00) and ischemic heart disease mortality, suggesting that nighttime noise exposure is very important in relation to CVD risk28. Their recent study also found that the association between transportation noise and death from myocardial infarction in a Swiss population was stable after adjusting for air pollution29. Three large Danish cohort studies on traffic-related pollution and health examined the effects of PM2.5, NO2 and traffic noise and observed elevated risks of CVD, heart failure, blood pressure, ischemic stroke, myocardial infarction mortality30, type 2 diabetes31 and atrial fibrillation32.
In Europe, air pollution, together with traffic noise pollution contribute to more than 75% of the burden of disease attributable to environmental factors33. People living in cities are exposed to multiple environmental factors simultaneously, which may impact health in combination and, in some cases, act synergistically. Many studies have investigated the effect of a single environmental pollutant on MetS or one of its subcomponents; however, evidence concerning the effects of co-exposure to air and noise pollution on MetS and its subcomponents remains scarce. This study investigated the effects of single and co-exposure to air pollution and road traffic noise on the incidence of MetS and its components in a health checkup cohort of participants living in Taipei City, Taiwan. Fine-scale temporal resolution was used to enhance our understanding of the development of MetS and its subcomponents. Additionally, we evaluated the potential confounding effects of basic information, personal and family health history, lifestyle and behavior, physical activity, sleep duration, and dietary habits.
Materials and methods
Study area, design, and participants
This study was a retrospective cohort study. We investigated the impact of previous environmental exposure on the risk of developing MetS and its components. Participant data was collected from the MJ Health Database (MJHD) to include 10,997 Taipei City residents who underwent at least two health checkups at the MJ Health Management Institution, a private healthcare firm in Taiwan, between 2010 and 2016. The MJ Health Database is a longitudinal, large-scale, comprehensive population-based health database. For each examination visit, information on behavior and lifestyle was collected via a self-administered health questionnaire. Data on anthropometric and biological tests were collected via health checkups.
Figure 1 shows a flowchart of the data-selection process. The initial study participants included 50,777 individuals who underwent health check-ups between 2010 and 2016. Participants were eligible if they did not develop MetS during the first examination. We excluded participants who (1) had only received one health checkup (N = 33,948), (2) had missing data on outcome and confounding variables (N = 3959), (3) took long-term medication (N = 897), and (4) had incident MetS at their first visit (N = 1226); the remaining 10,773 participants were enrolled and followed up for MetS.
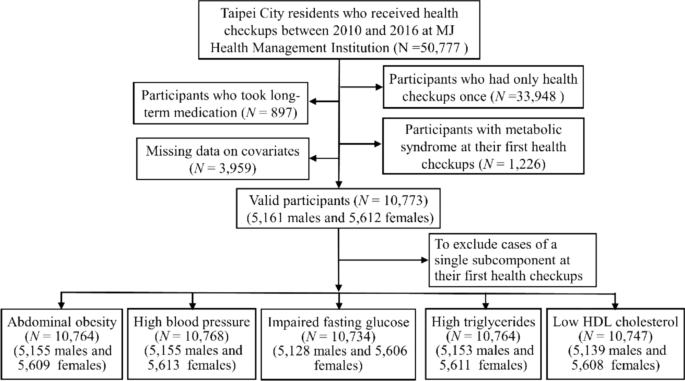
The flowchart of participants’ selection. The flowchart shows the exclusion criteria for participant selection and shows the final number of participants included (N = 10,773 and their distribution across the different subcomponents of the metabolic syndrome).
To further assess the risk of environmental exposure for each subcomponent of MetS, the respective baseline sample for each subcomponent was composed of the data from valid participants who were tested negative for that subcomponent at their first health checkup. Therefore, we included N = 10,764 for abdominal obesity, N = 10,768 for high blood pressure, N = 10,734 for impaired fasting glucose, N = 10,764 for high triglycerides, and N = 10,747 for low HDL cholesterol. The follow-up period was from the date of their previous health checkup to the date of the health checkup for MetS or a single subcomponent. For participants without MetS or any single subcomponent, the follow-up period ranged from the date of their first health checkup to the date of their last health checkup.
The geocoding process was handled by the MJ Health Resource Center before being released to the data users. They used two geocoders to geocode the addresses from health check-up visits, including the official geocoder, TGOS (https://www.tgos.tw/tgos/Addr), operated by the Ministry of Interior, Taiwan, and the Google Map geocoding service (https://developers.google.com/maps/documentation/geocoding). Our research team used the released coordinates to link exposure to noise and PM2.5.
Outcome definition
According to the Health Promotion Administration, Ministry of Health and Welfare, Taiwan, metabolic syndrome in Taiwan is diagnosed with the presence of at least three of the following five criteria: (1) abdominal obesity: waist circumference ≥ 90 cm in men and ≥ 80 cm in women (2) high blood pressure: systolic blood pressure ≥ 130 mmHg or diastolic blood pressure ≥ 85 mmHg (3) impaired fasting glucose: fasting plasma glucose ≥ 100 mg/dL (4) high triglycerides: triglycerides ≥ 150 mg/dL (5) low HDL cholesterol: HDL cholesterol < 40 mg/dL in men and < 50 mg/dL in women34.
Venipuncture was performed to collect overnight fasting blood for a series of biochemical analyses, including lipid profile, renal function, liver profile, and serum albumin, globulin, and uric acid levels. All biological specimens were analyzed in a laboratory located at the MJ Health Screening Center. A standardized service workflow was adopted by all four health-screening centers in Taiwan that conformed to ISO 9001-2008 requirements for quality management systems. The MJ Health Screening Center laboratories participated in College of American Pathologists Proficiency Testing to ensure their ability to generate good-quality health data.
Exposure measurement
Personal PM2.5 exposures were assessed using high-resolution, specified air pollution datasets maintained by the Atmospheric Composition Analysis Group of Washington University in St. Louis. These were global estimates of ground-level ambient PM2.5, which were gridded at approximately 1 km × 1 km35. The PM2.5 concentrations were available at a monthly timescale for the years 2010 through 2016. Briefly, PM2.5 was estimated based on several satellite aerosol optical depth (AOD) products, and then combined with chemical transport model simulations to relate AOD to the estimated surface-level PM2.5 concentrations. The estimated monthly PM2.5 concentrations were validated against ground PM2.5 concentrations measured at fixed monitoring stations across Taipei City. The PM2.5 estimates exhibited general consistency with ground-based observations, with a Pearson correlation coefficient of 0.69. The model accuracy was evaluated by mean absolute error (MAE) = 4.31 µg/m3, and root mean square error (RMSE) = 5.42 µg/m3.
Noise exposure was assessed based on road traffic noise levels. The hourly noise levels for road segments were estimated using noise prediction models with traffic conditions and road attributes as inputs36. Historical traffic condition data collected by available overhead microwave vehicle detectors in Taipei City were provided by the Department of Transportation, Taipei City Government. The geographical data included road network and building data in a vector format. Information on the road segments includes the following attributes: road identification (ID), road name, length, width, number of lanes, and road class. A-weighted sound pressure levels in decibels (dBA) were estimated over 24 h. We assumed that the hourly noise levels of each participant depended mainly on the noise generated by the nearest road segment. The estimated hourly noise levels were validated against the traffic noise monitoring sites in Taipei City. The Pearson correlation coefficient between the estimated and measured hourly 24-h and nighttime noise levels were 0.70 and 0.54, respectively. The accuracy analysis showed that the hourly MAE and RMSE were 3.49 and 2.62 dBA for 24-h noise levels and 3.08 and 4.03 dBA for nighttime noise levels. Furthermore, the monthly average noise levels during the day, evening, and night (24 h, Lden indicator) and the average nighttime (23:00–6:00) exposure (Lnight indicator) were calculated based on the noise prediction models for each road segment.
Covariates
Covariates were selected for model adjustment based on a self-administered questionnaire administered prior to the final health checkup. This was divided into six categories: basic information, family health history, current health status, lifestyle, physical activity, sleep duration, and dietary habits. Basic information included age (20–39 years, 40–49 years, 50–59 years and > 60 years), sex, smoking status (never smoked, former smoker, current smoker), drinking status (never drank, former drinker, current drinker), education level (high school diploma or less, bachelor’s degree, and master's degree or above), and marital status (single, married/cohabitating, widowed, and divorced). Family health history of chronic diseases, which is a record of the relationships among family members along with their health histories, was categorized as yes or no. Biweekly physical activity was broadly classified into four categories (< 30 min, 30–60 min, 60–120 min, and > 120 min). The sleep durations were less than 6 h, 6–8 h and over 8 h. Eat-on time and regular amounts, at least 1 serving of rice or flour products, at least 1 serving of meat, at least 1 serving of vegetables, and at least 1 serving of fruits were categorized as yes or no, respectively.
Statistical analysis
MetS and its five subcomponents were investigated separately as outcomes. Cox proportional hazards regression models with month as the underlying time scale were used to estimate hazard ratios (HRs) for the impact of PM2.5 and road traffic noise exposure on the risk of developing MetS or its subcomponents. Participants were censored if they did not have MetS at their final health checkup or if they were diagnosed with MetS at one of their previous health checkups.
Monthly PM2.5 and road traffic noise exposures were treated as continuous variables.
We first conducted single exposure analyses for PM2.5 and road traffic noise. Subsequently, a co-exposure analysis was conducted for both PM2.5 and road traffic noise. Finally, co-exposure analysis of both PM2.5 and nighttime noise was used to examine the harmful effects of road traffic noise during sleep. To investigate the interaction between air and noise pollution, we used the median as the cut-off value for each pollution exposure categories in the co-exposure models to divide valid participants into high and low-exposure groups. All Models were adjusted for basic information, family health history, lifestyle, physical activity, sleep duration, and dietary habits, which were considered as confounders, and investigated how these covariates modified the associations between the development of MetS or its subcomponents and environmental pollution exposure. Pearson’s chi-square tests were also performed to investigate the association between covariates and the frequency of incident MetS. The significance level was set at p < 0.05 for all statistical tests. All analyses were performed using the R software (version 4.0.4, R Development Core Team, https://www.r-project.org/). The maps created using the Free and Open Source QGIS by using Version 3.14.15 (https://www.qgis.org/en/site/).
Ethical approval
Informed consent was obtained from all the participants. This study was approved by the Institutional Review Board on Biomedical Science Research, Academia Sinica (AS-IRB-BM-22008). Individually identifiable health data were removed and anonymized throughout the study. This study was performed in accordance with the Declaration of Helsinki and followed an approved protocol.
Results
As shown in Table 1, the sex distribution was approximately balanced. Most participants were 20–39 years old (46.29%), married or cohabitating (65.62%), had a bachelor’s degree (62.11%), and a family health history of at least one chronic disease (56.17%). In terms of daily lifestyle, 13.87% and 13.91% of the participants were respectively current smokers and drinkers, and 74.23% had a sleep duration of 6–8 h. The biweekly physical activity for at least 30 min was 70.99%. In relation to dietary habits, the proportion of eating on schedule and in regular amounts was 72.60%. At least 1 serving of rice or flour products, meat, vegetables, and fruits were 94.90%, 96.13%, 94.95% and 73.33%, respectively. The results of the chi-square test, which measures the association between potential covariates and MetS, were also shown in Table 1. All covariates were significantly associated with incident MetS except for family health history, daily servings of vegetables and daily servings of fruits a day. Spearman’s correlations between pollution exposure (PM2.5 and noise) and ordinal covariates were shown in Table S1 of supplement material. No significant association was found between pollution exposure and any of the introduced ordinal covariates at a significance level of 0.05.
In Table 2, the monthly PM2.5 concentrations ranged from 14.96 to 22.45 µg/m3 with mean and the median concentrations of 19.84 and 19.78 µg/m3, respectively. The estimated monthly average Lden ranged from 65.54 to 74.83 dBA with mean and median levels of 67.77 and 68.66 dBA across the cohort, respectively. Figures S1–S3 show the spatio-temporal variations in the year-to-year PM2.5, all-day noise (Lden), and nighttime noise (Lnight) exposure levels of valid participants during the study period. There was a relatively small number of cases with impaired fasting glucose (N = 50). Due to the insufficient sample size for the Cox model, we could not assess the effect of environmental exposure on it in this study.
Table S2 shows the results for a single PM2.5 exposure models. A higher PM2.5 concentration was significantly and positively associated with and increased risk of MetS and its subcomponents. The adjusted HR = 1.88 per 1 µg/m3 monthly PM2.5 increase for developing MetS. The HRs of abdominal obesity, high blood pressure, high triglycerides, and low HDL cholesterol for a single PM2.5 exposure were 1.32, 1.37, 1.50 and 1.83 with per 1 µg/m3 increase in monthly PM2.5, respectively. In the single monthly average Lden exposure model (Table S3), an elevated monthly average Lden was significantly and positively associated with an increased risk of MetS and its components during the follow-up period. The adjusted HR of developing MetS was 1.10 per 1 dBA increase in monthly average Lden. The HRs of abdominal obesity, high blood pressure, high triglycerides, and low HDL cholesterol were 1.05, 1.04, 1.07 and 1.09 per 1 dBA increase in the monthly average Lden, respectively. Table S4 shows the risk of a single monthly average Lnight exposure. The adjusted HR of incident MetS was 1.07 per 1 dBA increase in monthly average Lnight. The adjusted HRs of abdominal obesity, high blood pressure, high triglycerides, and low HDL cholesterol were 1.04, 1.04, 1.06 and 1.08 per 1 dBA increase in the monthly average Lnight.
Table 3 and Table S5 show the effects of PM2.5 and Lden co-exposure on MetS and its subcomponents. Both PM2.5 and Lden exposures were associated with significant risks of MetS, with adjusted HRs ranging from 1.91 for PM2.5 to 1.11 for Lden per unit higher exposure. Additionally, the adjusted HRs for PM2.5 of co-exposure to PM2.5 and Lden on the four subcomponents of MetS were 1.33 for abdominal obesity, 1.37 for high blood pressure, 1.51 for high triglycerides and 1.84 for low HDL cholesterol. The adjusted HRs for Lden on the four subcomponents of Mets were then 1.05 for abdominal obesity, 1.05 for high blood pressure, 1.07 for high triglycerides, and 1.09 for low HDL cholesterol.
The associations between co-exposure to PM2.5 and Lnight and MetS and its subcomponents are presented in Table 3 and Table S6. The adjusted HRs of PM2.5 were 1.90 for MetS, 1.33 for abdominal obesity, 1.37 for high blood pressure, 1.50 for high triglycerides, and 1.84 for low HDL cholesterol. The adjusted HRs of Lnight were 1.08 for MetS, 1.04 for abdominal obesity, 1.04 for high blood pressure, 1.06 for high triglycerides, and 1.08 for low HDL cholesterol.
Regarding the relationship between incident MetS or its subcomponents and individual characteristics in co-exposure models (Tables S5 and S6), female sex was found to have a positive association with the incidence of low HDL cholesterol, and a protective effect against increasing risks of MetS and other subcomponents. Older age groups were at an increased risk of developing high blood pressure. Higher education levels were significantly and negatively associated with MetS and its subcomponents. The married and cohabitating groups had a significant positive association with abdominal obesity and high triglyceride levels, while the widowed group had a positive association with MetS, abdominal obesity, and high triglycerides. Current smokers in this study were found to have an increased risk of developing MetS and its subcomponents, except for high blood pressure. Both biweekly physical activity and eating on time and in regular amounts showed protective effects against an increased risk of MetS. Family health history and smoking status were found to have an increased risk of developing high blood pressure. Among the four dietary patterns, “at least 1 serving of rice or flour products a day” showed protective effects against an increased risk of MetS, and “at least 1 serving of meat a week” was found to have an increased risk of developing abdominal obesity.
Figure 2 reveals effect estimates from the co-exposure models with interaction terms for different exposure groups of PM2.5 and Lden. Compared with the low PM2.5 exposure groups, the high exposure groups had significant higher adjusted HRs, ranging from 2.60 to 4.40, on MetS and its subcomponents after adjustment for potential confounders. The high Lden exposure groups also had significant higher adjusted HRs on MetS and its subcomponents (ranging from 1.58 to 2.22) compared with the reference groups. Figure 3 shows effect estimates from the co-exposure models with interaction terms for different exposure groups of PM2.5 and Lnight. Both high PM2.5 exposure groups and high Lnight exposure groups had significant higher adjusted HRs on MetS and its subcomponents (ranging from 2.61 to 4.53 and 1.63 to 1.94, respectively) compared with their reference groups. Similar results were founded in Tables S9, S10, S13 and S14, except that high Lnight exposure group of male participants was not statistically significant on Mets. However, the interactions of pollution exposures on MetS and its subcomponents were not statistically significant in all co-exposure models with interaction terms.

Effect estimates from the co-exposure models with interaction terms for PM2.5 and all-day traffic noise. Effect estimates are evaluated by hazard ratios. The crude model examines how PM2.5, all-day traffic noise, and the interaction term affect MetS and its subcomponents and ignores potential covariates. The adjusted model incorporates other potential covariates. The forest plot is used to visualize effect estimates and display the observed effects and confidence intervals.

Effect estimates from the co-exposure models with interaction terms for PM2.5 and nighttime traffic noise. Effect estimates are evaluated by hazard ratios. The crude model examines how PM2.5, nighttime traffic noise, and the interaction term affect MetS and its subcomponents and ignores potential covariates. The adjusted model incorporates other potential covariates. The forest plot is used to visualize effect estimates and display the observed effects and confidence intervals.
Table S7 demonstrates the effect estimates on MetS and its subcomponents from the co-exposure models for PM2.5 and Lden of valid male participants. Both PM2.5 and Lden exposures were associated with significant risks of MetS and its four subcomponents, with adjusted HRs ranging from 1.22 to 1.89 for PM2.5 and 1.03 to 1.08 for Lden. Table S8 shows the effect estimates on MetS and its subcomponents from the co-exposure models for PM2.5 and Lnight of valid male participants. PM2.5 exposures were also associated with significant risks of MetS and its four subcomponents, with adjusted HRs ranging from 1.22 to 1.88. However, Lnight exposures were significant only for high triglycerides (adjusted HR = 1.06) and low HDL cholesterol (adjusted HR = 1.06). Table S11 shows the effect estimates on MetS and its subcomponents from the co-exposure models for PM2.5 and Lden of valid female participants. Both PM2.5 and Lden exposures were associated with significant risks of MetS and its four subcomponents, with adjusted HRs ranging from 1.49 to 2.14 for PM2.5 and 1.08 to 1.18 for Lden. Table S12 shows the effect estimates on MetS and its subcomponents from the co-exposure models for PM2.5 and Lnight of valid female participants. Both PM2.5 and Lnight exposures were also associated with significant risks of MetS and its four subcomponents, with adjusted HRs ranging from 1.49 to 2.14 for PM2.5 and 1.06 to 1.14 for Lden.
Discussion
This study took advantage of finer air pollution and noise exposure data, along with repeated measurements from a health checkup database, to elucidate the incident risk of MetS and its subcomponents. Previous studies have focused on the links between environmental risk factors and the prevalence of MetS or its subcomponents in susceptible or specific races and ethnic groups5,6,37,38. The participants included in this study had a better health status at baseline, which is a good indicator to evaluate their progression towards MetS. The geocode addresses and fine timescales used for exposure assessment accurately reflect variations in local environmental exposures. Therefore, this study provides direct evidence of the adverse effects of air pollution and noise on incident MetS and its subcomponents in the general population. In addition, we adjusted for potential individual covariates. We found significant positive associations between PM2.5, noise (Lden and Lnight) exposure, and incident MetS in all the single and co-exposure models. Moreover, PM2.5 and noise (Lden and Lnight) exposures also significantly affected the incidence of MetS subcomponents during follow-up.
In this study, we find significantly effects of co-exposure to noise and PM2.5. on Mets and its subcomponents. The outcome was consistent with the finding in a previous study that evaluated associations between co-exposure groups and the prevalence of cardiovascular disease34. Eze et al.39 found that the combined impact of noise and air pollution on metabolic outcomes. Klompmaker et al.40 evaluated the combined impact of air and noise pollution on myocardial infarction. In addition, we did not find significantly interaction effects of co-exposure to noise and air pollution in the present study. Gan et al.41 found that there was not any positive interaction between noise and black carbon on risk of coronary heart disease mortality when they were assessed on either additive or multiplicative scales. Roswall et al.42 evaluated the combined effects of 10-year mean exposure to noise and NO2 in relation to risk of myocardial infarction. Results showed the highest HRs for both outcomes were among those with a combination of either high or medium noise exposure and high NO2 exposure. Thacher et al.30 evaluated associations between combined residential exposure to RTN and PM2.5 and cardiovascular disease (CVD) mortality risk (10-year mean exposure). In interaction analysis, results suggested that high exposure to both noise and PM2.5 resulted in the highest risk for CVD mortality.
Nighttime noise, especially that caused by road traffic, is considered a significant cause of sleep disturbances. Poor sleep causes measurable endocrine and metabolic disruptions and is associated with several negative cardiometabolic, psychiatric, and social outcomes43,44,45. Thus, we further assessed the effect of noise exposure during the nighttime (Lnight) on MetS and its subcomponents using co-exposure models. The risk of exposure to nighttime noise on MetS was slightly reduced compared to the risk of all-day noise exposure by adjusting for PM2.5 and individual covariates in co-exposure models. Lden added a constant penalty of 10 dBA for nighttime noise to account for the higher impact of nighttime noise than daytime noise. This might lead to a single Lnight of exposure to MetS and its components having similar risks to a single Lden noise exposure. There may be two possible reasons why Lden had a greater impact on metabolic syndrome than did Lnight in this study. First, there is a lot less traffic on the road at night than that during the day. Second, Lden is estimated based on noise levels over a whole day (24 h), with a penalty of 5 dB for the evening hours (19:00–23:00) and of 10 dB for the nighttime hours (23:00–06:00).
Evidence from epidemiological studies suggests that air pollution and noise trigger physiological alterations during the development of MetS5,46. Most studies have used annual mean exposure to environmental risk factors to assess associations with incident MetS or its subcomponents; however, a fine-scale temporal resolution may enhance our understanding of the impact of environmental risk factors. This study used a fine temporal resolution (monthly) to better understand the relationship among environmental factors, MetS, and its subcomponents.
Empirical and epidemiological evidence supports the concept that air pollution and noise have different underlying pathways that induce metabolic disorders. Plausible biological mechanisms for the effects of air pollution, especially PM2.5, on metabolic dysfunction include the induction of oxidative stress and inflammation in the lungs and migration through the lung epithelium into the bloodstream, thus contributing to adverse cardiometabolic outcomes5,47,48. Exposure to noise may induce stress and result in reduced sleep quality, which in turn can adversely affect heart rate, blood pressure, and changes in the metabolic system44,49,50,51. Thus, the mechanisms linking noise exposure and MetS risk may involve the stress response and may further result in metabolic dysfunction. These pathways may lead to systemic and vascular inflammation, increasing the risk of dyslipidemia, hypertension, thrombosis, insulin resistance, and consequently, metabolic alterations. However, due to insufficient information, it was not possible to characterize the effects of air pollution and noise on impaired fasting glucose. Our findings, which report significant effects of air and noise pollution on incident MetS and its subcomponents, were consistent with those reported in the literature.
Our study utilized an extensive selection process. By excluding all participants with incident MetS, the selected participants might have had a better health status than the overall population. On average, participants were younger and had a lower prevalence of MetS risk factors. This study had several limitations. (1) Covariate data were collected using a self-administered health questionnaire. This may have caused misclassification. Although data cleaning should have minimized this problem, a bias may still exist. (2) While exposure was assigned to the geocoded addresses of participants, we did not measure the amount of time the participants spent at home. Therefore, we do not know the extent to which the attributed values are consistent with the actual exposure of the subjects. (3) Both PM2.5 and noise exposures in outdoor environments were estimated based on the geocoded addresses of the participants. However, exposure to outdoor pollution may be more serious than that to indoor pollution. (4) Although we included several sets of covariates in the modeling analysis, variations in psychological stress should be considered in further studies. (5) In this study, we excluded participants who were on medication for hypertension, diabetes, or high blood lipids. Because no question on the duration of the medication was included in the questionnaire, we have no relevant information about it.
Conclusion
Air and noise pollution are regarded as inevitable byproducts of urbanization. With rapid urbanization, the degree to which people are exposed to these two environmental pollutants is likely to increase. This study provides evidence based on the health checkup database that individual PM2.5 and noise, and their co-exposure may elevate the risk of MetS and its subcomponents. Therefore, prevention approaches should not only target exhaust emissions but also traffic noise. Stricter emission controls and changes in land-use and transportation programs that encourage public transit, car-sharing, and electric vehicles and generally reduce traffic may provide an effective avenue for reducing the incidence of MetS and generating large public health benefits.
Data availability
The data that support the findings of this study are available from the MJ Health Research Foundation, Taiwan. However, restrictions apply to the availability of these data, which are under approval for the current study and thus, are not publicly available. Data are however available from the corresponding authors upon reasonable request and with permission of MJ Health Research Foundation, Taiwan.
Abbreviations
- Mets:
-
Metabolic syndrome
- Lden :
-
Day evening night sound level
- Lnight :
-
Nighttime sound level
- HRs:
-
Hazard ratios
- CVD:
-
Cardiovascular disease
- HDL:
-
High-density lipoprotein
- APD:
-
Aerosol optical depth
- MAE:
-
Mean absolute error
- RMSE:
-
Root mean square error
- dBA:
-
A-weighted decibel
References
Manaf, M. R. A. et al. Prevalence of metabolic syndrome and its associated risk factors among staffs in a Malaysian public university. Sci. Rep. 11(1), 8132 (2021).
Park, Y. W. et al. The metabolic syndrome: Prevalence and associated risk factor findings in the US population from the Third National Health and Nutrition Examination Survey, 1988–1994. Arch. Intern. Med. 163(4), 427–436 (2003).
Hwang, L. C., Bai, C. H., Sun, C. A. & Chen, C. J. Prevalence of metabolically healthy obesity and its impacts on incidences of hypertension, diabetes and the metabolic syndrome in Taiwan. Asia Pac. J. Clin. Nutr. 21(2), 227–233 (2012).
Munzel, T. et al. Environmental stressors and cardio-metabolic disease: Part II-mechanistic insights. Eur. Heart J. 38(8), 557–564 (2017).
Yu, Y. et al. Air pollution, noise exposure, and metabolic syndrome: A cohort study in elderly Mexican-Americans in Sacramento area. Environ. Int. 134, 105269 (2020).
Wallwork, R. S. et al. Ambient fine particulate matter, outdoor temperature, and risk of metabolic syndrome. Am. J. Epidemiol. 185(1), 30–39 (2017).
Saklayen, M. G. The global epidemic of the metabolic syndrome. Curr. Hypertens. Rep. 20(2), 12 (2018).
Perez Velasco, R. & Jarosinska, D. Update of the WHO global air quality guidelines: Systematic reviews—An introduction. Environ. Int. 170, 107556 (2022).
In: WHO Global Air Quality Guidelines: Particulate Matter (PM(25) and PM(10)), Ozone, Nitrogen Dioxide, Sulfur Dioxide and Carbon Monoxide. edn. (Geneva, 2021).
Evans, J. et al. Estimates of global mortality attributable to particulate air pollution using satellite imagery. Environ. Res. 120, 33–42 (2013).
Hou, J. et al. Long-term exposure to ambient air pollution attenuated the association of physical activity with metabolic syndrome in rural Chinese adults: A cross-sectional study. Environ. Int. 136, 105459 (2020).
Matthiessen, C. et al. Long-term exposure to airborne particulate matter and NO2 and prevalent and incident metabolic syndrome: Results from the Heinz Nixdorf recall study. Environ. Int. 116, 74–82 (2018).
Yang, B. Y. et al. Long-term exposure to ambient air pollution (including PM1) and metabolic syndrome: The 33 Communities Chinese Health Study (33CCHS). Environ. Res. 164, 204–211 (2018).
Wang, S. J., Gao, S., Li, S. J. & Feng, K. S. Strategizing the relation between urbanization and air pollution: Empirical evidence from global countries. J Clean Prod 243, 118615 (2020).
Tamayo-Ortiz, M. et al. Exposure to PM(2.5) and obesity prevalence in the greater Mexico city area. Int. J. Environ. Res. Public Health 18(5), 2301 (2021).
Chuang, K. J., Yan, Y. H., Chiu, S. Y. & Cheng, T. J. Long-term air pollution exposure and risk factors for cardiovascular diseases among the elderly in Taiwan. Occup. Environ. Med. 68(1), 64–68 (2011).
He, D. et al. Association between particulate matter 2.5 and diabetes mellitus: A meta-analysis of cohort studies. J. Diabetes Investig. 8(5), 687–696 (2017).
Sommar, J. N., Segersson, D., Flanagan, E. & Oudin, A. Long-term residential exposure to source-specific particulate matter and incidence of diabetes mellitus: A cohort study in northern Sweden. Environ Res 217, 114833 (2023).
Clementi, E. A. et al. Metabolic syndrome and air pollution: A narrative review of their cardiopulmonary effects. Toxics 7(1), 6 (2019).
Lin, H. et al. Long-term effects of ambient PM(2.5) on hypertension and blood pressure and attributable risk among older Chinese adults. Hypertension 69(5), 806–812 (2017).
Liang, R. et al. Effect of exposure to PM25 on blood pressure: A systematic review and meta-analysis. J. Hypertens 32(11), 2130–2140 (2014) (discussion 2141).
Gaio, V., Roquette, R., Dias, C. M. & Nunes, B. Ambient air pollution and lipid profile: Systematic review and meta-analysis. Environ. Pollut. 254(Pt B), 113036 (2019).
Li, J. et al. Association of long-term exposure to PM(2.5) with blood lipids in the Chinese population: Findings from a longitudinal quasi-experiment. Environ. Int. 151, 106454 (2021).
Liu, Q. et al. Effects of short-term PM(2.5) exposure on blood lipids among 197,957 people in eastern China. Sci. Rep. 13(1), 4505 (2023).
Sun, J. et al. Association of short-term exposure to PM(2.5) with blood lipids and the modification effects of insulin resistance: A panel study in Wuhan. Toxics 10(11), 663 (2022).
Jarosinska, D. et al. Development of the WHO environmental noise guidelines for the European region: An introduction. Int. J. Environ. Res. Public Health 15(4), 813 (2018).
Heritier, H. et al. Transportation noise exposure and cardiovascular mortality: A nationwide cohort study from Switzerland. Eur. J. Epidemiol. 32(4), 307–315 (2017).
Heritier, H. et al. Diurnal variability of transportation noise exposure and cardiovascular mortality: A nationwide cohort study from Switzerland. Int. J. Hyg. Environ. Health 221(3), 556–563 (2018).
Heritier, H. et al. A systematic analysis of mutual effects of transportation noise and air pollution exposure on myocardial infarction mortality: A nationwide cohort study in Switzerland. Eur. Heart J. 40(7), 598–603 (2019).
Thacher, J. D. et al. Long-term residential road traffic noise and mortality in a Danish cohort. Environ. Res. 187, 109633 (2020).
Thacher, J. D. et al. Long-term exposure to transportation noise and risk for type 2 diabetes in a nationwide cohort study from Denmark. Environ. Health Perspect. 129(12), 127003 (2021).
Thacher, J. D. et al. Long-term exposure to transportation noise and risk for atrial fibrillation: A Danish nationwide cohort study. Environ. Res. 207, 112167 (2022).
Hanninen, O. et al. Environmental burden of disease in Europe: Assessing nine risk factors in six countries. Environ. Health Perspect. 122(5), 439–446 (2014).
Yang, W. T. et al. Road traffic noise, air pollutants, and the prevalence of cardiovascular disease in Taichung, Taiwan. Int. J. Environ. Res. Public Health 15(8), 1707 (2018).
van Donkelaar, A. et al. Monthly global estimates of fine particulate matter and their uncertainty. Environ. Sci. Technol. 55(22), 15287–15300 (2021).
Tang, J. H. et al. Dynamic modeling for noise mapping in urban areas. Environ Impact Asses 97, 106864 (2022).
Lee, A. M., Gurka, M. J. & DeBoer, M. D. Trends in metabolic syndrome severity and lifestyle factors among adolescents. Pediatrics 137(3), e20153177 (2016).
Li, F. E. et al. Sex-based differences in and risk factors for metabolic syndrome in adults aged 40 years and above in Northeast China: Results from the cross-sectional China national stroke screening survey. BMJ Open 11(3), e038671 (2021).
Eze, I. C. et al. Long-term exposure to transportation noise and air pollution in relation to incident diabetes in the SAPALDIA study. Int. J. Epidemiol. 46(4), 1115–1125 (2017).
Klompmaker, J. O. et al. Associations of combined exposures to surrounding green, air pollution, and road traffic noise with cardiometabolic diseases. Environ. Health Perspect. 127(8), 87003 (2019).
Gan, W. Q., Davies, H. W., Koehoorn, M. & Brauer, M. Association of long-term exposure to community noise and traffic-related air pollution with coronary heart disease mortality. Am. J. Epidemiol. 175(9), 898–906 (2012).
Roswall, N. et al. Long-term residential road traffic noise and NO(2) exposure in relation to risk of incident myocardial infarction: A Danish cohort study. Environ. Res. 156, 80–86 (2017).
Sygna, K., Aasvang, G. M., Aamodt, G., Oftedal, B. & Krog, N. H. Road traffic noise, sleep and mental health. Environ. Res. 131, 17–24 (2014).
Basner, M. & McGuire, S. WHO environmental noise guidelines for the European region: A systematic review on environmental noise and effects on sleep. Int. J. Environ. Res. Public Health 15(3), 519 (2018).
Drudge, C. et al. Exploring nighttime road traffic noise: A comprehensive predictive surface for Toronto, Canada. J. Occup. Environ. Hyg. 15(5), 389–398 (2018).
Voss, S. et al. ENVINT-D-20-01309: Long-term exposure to air pollution, road traffic noise, residential greenness, and prevalent and incident metabolic syndrome: Results from the population-based KORA F4/FF4 cohort in Augsburg. Germany. Environ Int 147, 106364 (2021).
Farbstein, D. & Levy, A. P. HDL dysfunction in diabetes: Causes and possible treatments. Expert Rev. Cardiovasc. Ther. 10(3), 353–361 (2012).
Weiss, T. W., Arnesen, H. & Seljeflot, I. Components of the interleukin-6 transsignalling system are associated with the metabolic syndrome, endothelial dysfunction and arterial stiffness. Metabolism 62(7), 1008–1013 (2013).
Munzel, T. et al. Environmental noise and the cardiovascular system. J. Am. Coll. Cardiol. 71(6), 688–697 (2018).
Klompmaker, J. O. et al. Effects of exposure to surrounding green, air pollution and traffic noise with non-accidental and cause-specific mortality in the Dutch national cohort. Environ. Health 20(1), 82 (2021).
Cui, B., Gai, Z., She, X., Wang, R. & Xi, Z. Effects of chronic noise on glucose metabolism and gut microbiota-host inflammatory homeostasis in rats. Sci. Rep. 6, 36693 (2016).
Acknowledgements
All or part of the data used in this research were authorized by, and received form MJ Health Research Foundation (Authorization Code: MJHRF2021020A). Any interpretation or conclusion described in this paper does not represent the views of MJ Health Research Foundation.
Funding
This work was supported by Academia Sinica, Taiwan [Grant No: AS-SS-109-02].
Author information
Authors and Affiliations
Contributions
T.C.C. conceived and designed the study. T.C.C. acquired the health data. J.H.T. drafted the manuscript, helped design the study and provided statistical suggestion. H.L.J. performed the statistical analyses. T.C.C. obtained funding and supervised the study. All authors have critically revised the manuscript. All authors have read and approved the final manuscript.
Corresponding author
Ethics declarations
Competing interests
The authors declare no competing interests.
Additional information
Publisher's note
Springer Nature remains neutral with regard to jurisdictional claims in published maps and institutional affiliations.
Supplementary Information
Rights and permissions
Open Access This article is licensed under a Creative Commons Attribution 4.0 International License, which permits use, sharing, adaptation, distribution and reproduction in any medium or format, as long as you give appropriate credit to the original author(s) and the source, provide a link to the Creative Commons licence, and indicate if changes were made. The images or other third party material in this article are included in the article's Creative Commons licence, unless indicated otherwise in a credit line to the material. If material is not included in the article's Creative Commons licence and your intended use is not permitted by statutory regulation or exceeds the permitted use, you will need to obtain permission directly from the copyright holder. To view a copy of this licence, visit http://creativecommons.org/licenses/by/4.0/.
About this article

Cite this article
Tang, JH., Jian, HL. & Chan, TC. The impact of co-exposure to air and noise pollution on the incidence of metabolic syndrome from a health checkup cohort. Sci Rep 14, 8841 (2024). https://doi.org/10.1038/s41598-024-59576-5
Received:
Accepted:
Published:
DOI: https://doi.org/10.1038/s41598-024-59576-5
Keywords
Comments
By submitting a comment you agree to abide by our Terms and Community Guidelines. If you find something abusive or that does not comply with our terms or guidelines please flag it as inappropriate.
