
Abstract
The number of young adults seeking help for emotional distress, subsyndromal-syndromal mood/anxiety symptoms, including those associated with neuroticism, is rising and can be an early manifestation of mood/anxiety disorders. Identification of gray matter (GM) thickness alterations and their relationship with neuroticism and mood/anxiety symptoms can aid in earlier diagnosis and prevention of risk for future mood and anxiety disorders. In a transdiagnostic sample of young adults (n = 252;177 females; age 21.7 ± 2), Hypothesis (H) 1:regularized regression followed by multiple regression examined relationships among GM cortical thickness and clinician-rated depression, anxiety, and mania/hypomania; H2:the neuroticism factor and its subfactors as measured by NEO Personality Inventory (NEO-PI-R) were tested as mediators. Analyses revealed positive relationships between left parsopercularis thickness and depression (B = 4.87, p = 0.002), anxiety (B = 4.68, p = 0.002), mania/hypomania (B = 6.08, p ≤ 0.001); negative relationships between left inferior temporal gyrus (ITG) thickness and depression (B = − 5.64, p ≤ 0.001), anxiety (B = − 6.77, p ≤ 0.001), mania/hypomania (B = − 6.47, p ≤ 0.001); and positive relationships between left isthmus cingulate thickness (B = 2.84, p = 0.011), and anxiety. NEO anger/hostility mediated the relationship between left ITG thickness and mania/hypomania; NEO vulnerability mediated the relationship between left ITG thickness and depression. Examining the interrelationships among cortical thickness, neuroticism and mood and anxiety symptoms enriches the potential for identifying markers conferring risk for mood and anxiety disorders and can provide targets for personalized intervention strategies for these disorders.
Introduction
The number of young adults seeking help from mental health professionals for emotional distress1,2, including a range of subsyndromal to syndromal mood (depression, mania/hypomania) and anxiety symptoms, functional disabilities, and behavioral problems, is rising dramatically. Identifying objective neural markers of risk for the range of subsyndromal to syndromal mood and anxiety symptoms will not only aid earlier identification of risk for developing mood and anxiety disorders, but will also provide valuable insights into underlying neural mechanisms and provide targets to guide future interventions. It is well established that the personality trait neuroticism wields substantial public health implications3,4 and is closely related to mood and anxiety disorders5,6,7,8,9,10,11,12,13,14,15,16,17. One way forward to identifying objective neural markers of risk for mood and anxiety disorders is thus to identify tripartite relationships among neural markers relevant to mood and anxiety disorders, including those supporting emotional perception and regulation, and: neuroticism and subsyndromal-syndromal mood and anxiety symptom severity.
Gray matter (GM) measures show good test–retest reliability18,19,20,21, are critical structural underpinnings of neural activity, and, as such, are promising neural markers of neuroticism and predictors of future mood and anxiety disorders, as measured by subsyndromal-syndromal mood and anxiety symptom severity. Previous studies in adults have provided mixed results, however, with numerous studies demonstrating widespread decreases in cortical thicknesses, particularly in the prefrontal, cingulate, temporal, and parietal cortices in individuals with22,23,24,25,26,27,28,29,30,31,32,33,34,35,36,37,38,39 and at risk of40,41,42,43,44 mood and anxiety disorders, while some studies indicate cortical thickening, related to these disorders28,34,45,46,47,48. The mixed nature of these findings suggests that the relationship between cortical thickness and mood and anxiety might be driven by other factors such as personality traits, specifically by neuroticism, but these relationships remain to be examined.
While an expanding body of research revealed associations between neuroticism and GM volumes, predominantly in the prefrontal and cingulate cortices49,50,51,52,53,54, some studies have examined relationships between neuroticism and cortical thickness in key emotion regulation GM regions in adult populations. In healthy individuals, neuroticism has been positively associated with cortical thickness in left frontal and parietal cortices55,56,57, with both increased and decreased thickness reported in right frontal and middle temporal cortex, and the left pars opercularis52,56,57,58,59. Together, these findings suggest that cortical thickness abnormalities are associated with higher levels of neuroticism, but a mechanistic understanding of the relationships between GM thickness, neuroticism, and clinical symptoms is needed. This is especially important during young adulthood —a critical period for the onset of mental health issues and sensitive to interventions that can take advantage of the plasticity of the brain, given the continued neurodevelopment during this period60,61,62,63.
Studies of neuroticism have also shown relationships with mood and anxiety disorders5,6,7,8,9,10,11,12,13,14,15,16,17, indeed, the neuroticism domain of the Revised NEO Personality Inventory (NEO PI-R)64 encompasses subfactors such as “anxiety” and “depression”. These subfactors however, differ from the metrics provided by symptom level measures such as the Hamilton Anxiety Rating Scale (HAMA)65 and the Hamilton Rating Scale for Depression (HRSD)66 suggesting that they assess inherently different constructs. HAMA and HRSD evaluate the respondent’s state over the seven days preceding the clinical interview, focusing on both the physical and cognitive aspects of anxiety and depression respectively. In contrast, the NEO PI-R measures trait emotional experiences over the lifespan. Given these fundamental differences in measurement and the close relationship of neuroticism to mood and anxiety psychopathology, a careful exploration of the relationships among neuroticism, its respective subfactors, and the clinician-administered Hamilton Depression, Anxiety, and Mania scales is a logical step in understanding these tripartite relationships.
Studies using mediation analyses67,68 to examine the nature of tripartite relationships among GM, personality traits and behavior reported that neuroticism partially mediated the positive relationship between GM volume in the left dorsolateral prefrontal cortex, an emotional regulation region, and loneliness69; and neuroticism mediated the positive relationship between cortical thickness of the superior frontal cortex, an emotion processing region, and aggressive behavior70. No study to our knowledge, however, examined tripartite relationships among cortical thickness, neuroticism and subsyndromal-syndromal mood and anxiety symptom severity. While cross-sectional designs cannot infer causality, the temporal relationship among GM development, neuroticism, and clinical symptoms might suggest directionality in the relationships among these factors. Specifically, the human brain reaches 90% of its full size by five years of age, and GM cortical thickness shows both blooming and pruning during childhood and adolescence, with stable measures reached in adulthood71. Neuroticism also develops in childhood72,73,74 and becomes more stable across adulthood75,76,77,78,79,80, while mood and anxiety disorders most commonly develop in young adulthood63,81,82. It is thus possible that an individual’s early life trajectory, in conjunction with specific brain characteristics, may lead to the development of neuroticism, which in turn plays an important role in the emergence of mood and anxiety symptoms. While the directionality of relationships among GM, personality trait, and mood and anxiety symptoms remains to be clarified, the reported relationships between GM and the relatively more temporally stable neuroticism trait, and between GM and relatively more rapidly changing mood and anxiety symptoms, motivated our choice of neuroticism and its subfactors as mediators of GM-mood and anxiety symptom relationships.
Our study adopted a transdiagnostic approach, recruiting young adults who exhibited a spectrum of subsyndromal to syndromal mood and anxiety symptoms to identify the relationships among GM cortical thickness, neuroticism, and mood and anxiety symptom severity. This approach sought to transcend conventional diagnostic boundaries, offering profound insights into these relationships 83,84,85 and aimed to fill an important mechanistic gap in the literature concerning these relationships. Our hypotheses, grounded in existing literature generally showing reduced cortical thickness decrease in mood and greater cortical thickness in anxiety disorders were:
-
(1)
Reduced cortical thickness within prefrontal and temporal regions would be associated with greater severity of mood symptoms, specifically depression and mania/hypomania, whereas greater cortical thickness would be associated with greater severity of anxiety symptoms.
-
(2)
In the tripartite relationship, neuroticism and its specific subfactors, namely anxiety, anger/hostility, depression, self-consciousness, impulsiveness, and vulnerability would mediate the relationship between cortical thickness in specified regions and symptom severity.
Methods
Participants
Neuroimaging and clinical assessment data were employed from an ongoing study of young adults (18–25-year-olds) who were recruited across a range of mood and anxiety symptom severity (R37MH100041). 269 young adults 18–25 years were recruited from the general population via advertisement: 136 were seeking treatment for psychological distress and 133 were healthy. This approach ensured that a range of subsyndromal-syndromal mood and anxiety symptom severity was represented in recruited participants. From an initial sample, 17 participants were excluded due to: missing clinical data (n = 1), errors in segmentation/parcellation processing (n = 5), taking psychotropic (antidepressants) medications (n = 11), due to their possible influence on GM measures. The final sample comprised 252 individuals (123 seeking help for emotional distress, 129 non-distressed, healthy controls, mean age 21.7 ± 2 years, 177 female; Table 1). In the distressed group, 39 participants were currently diagnosed with depressive and 75 with anxiety disorders (including 26 participants who had both diagnoses). All participants were right-handed and English-speaking. The study protocol was approved by the University of Pittsburgh Institutional Review Board, all research was performed in accordance with relevant guidelines/regulations86, and all participants provided informed consent.
Assessment of affective and anxiety symptoms and personality traits
All individuals were assessed by a trained study clinician using the Structured Clinical Interview for DSM-5, Research Version (SCID-5-RV)87 to assess current and past psychiatric diagnostic status. Within 3 days of the neuroimaging assessment, a trained study clinician assessed the participant’s mood and anxiety symptom severity and personality traits, using well-validated scales and measures: the Hamilton Anxiety Rating Scale (HAMA)65 to assess anxiety, the Hamilton Rating Scale for Depression (HRSD)66 to assess depression, and the Young Mania Rating Scale (YMRS)88 to assess mania/hypomania (Table 1). The Neuroticism Extroversion Openness Five Factor Inventory (NEO PI-R)64 was used to assess personality traits during the initial clinical assessment. This analysis is part of a larger study that measured other symptoms and traits related to bipolar disorder (BD). The full list of measures is in the supplemental section.
Exclusion criteria
Exclusion criteria were: history of head injury, neurological, pervasive developmental disorder or systemic medical disease; cognitive impairment (Mini-Mental State Examination89 score < 24, and premorbid NAART IQ90 estimate < 85; visual disturbance (< 20/40 Snellen visual acuity); left or mixed handedness (Annett criteria)91; alcohol/substance abuse/dependence (including nicotine); and/or illicit substance use (except cannabis as commonly used in young adults) over the last 3 months in distressed participants and lifetime in healthy controls (to avoid the influence of medications/substances on GM), determined by Structured Clinical Interview for DSM-5 (SCID)87 (and psychiatric records, if available). Urine tests on the scanning day excluded individuals with current illicit substance use (except cannabis); salivary alcohol tests excluded individuals who were intoxicated on the scanning day. Additional exclusion criteria were MRI screening exclusion criteria, and positive pregnancy test for female individuals or self-reporting of pregnancy; or taking any psychotropic medication for > 2 weeks for distressed/lifetime for controls. The full list of Exclusion criteria is in the supplemental section.
MRI data acquisition and sMRI data analysis
Please see Supplemental Materials.
Statistical analysis
-
1.
To test the assumptions of linear regression Shapiro–Wilk normality tests were performed for depression, anxiety, and mania/hypomania residual score distributions.
-
2.
To test Hypothesis 1, and given a large number of independent variables, a separate penalized regression elastic-net model was used for variable selection, using the GLMNET (4.1) package92,93 in R (version 4.0.3) for GM thickness. Elastic-net is a modified form of least squares regression that penalizes complex models with a regularization parameter (λ) and is sensitive to correlated variables94,95. The regularization parameter shrinks coefficients toward zero and eliminates unimportant terms92. tenfold cross-validation with an elastic net alpha = 0.5 identified the optimal penalty term (λ) that minimized mean cross-validated error, reduced the chances of overfitting, and enforced recommended sparsity in the solution94. λ of minimum mean cross-validated error was selected to identify the variables in a model with the least mean cross-validated error.
-
3.
Multiple regression models (one each for depression, anxiety, and mania/hypomania as the dependent variable) in SPSS (version 27) were used to quantify effect sizes and the extent to which each identified variable from step 2, along with age, sex, and IQ, were associated with depression, anxiety, and mania/hypomania at a false discovery rate (FDR; q ≤ 0.05)96, to account for multiple comparisons. Given the high correlation among depression, anxiety, and mania/hypomania scores (Supplemental section, Table 1 all r > 0.7) an additional analysis using a composite pathology score (rounded ratio) was performed to assess relationships among GM thickness and all three clinical measures. The composite pathology score was calculated as the sum of the three weighted scores X 100 and rounded to the nearest integer.
-
4.
To test Hypothesis 2 mediation, the PROCESS macro bootstrapping algorithm was used68. Separate mediation models were tested for each significant GM variable (step 3) as independent variables (IVs) and depression, anxiety, and mania/hypomania scores as dependent variables (DVs). In each model, Neuroticism and its subfactors were operationalized as mediators to examine their potential influence on the statistically significant relationships identified between cortical thickness variables (step 3) and the severity of mood and anxiety symptoms67. False discovery rate correction (FDR; q ≤ 0.05) was used to account for multiple mediation tests. Bootstrapping (5000 iterations) was applied to calculate confidence intervals for mediating effects. To confirm the direction of the identified relationships, we also tested the alternative pathway with Neuroticism as IV, depression, anxiety, and mania/hypomania scores as DVs, and each GM variable as mediators.
-
5.
Sensitivity analysis. Participants having current anxiety or depressive diagnoses were excluded, and regression analysis, with the appropriate family (see results 1 below), was performed on the remaining sample (n = 169).
Results
-
1.
The residual scores of depression, anxiety, and mania/hypomania did not meet regression assumptions (Shapiro–Wilk, p < 0.001), showed a positive skew, and had standard deviations larger than the means. We therefore used negative binomial models for all analyses97.
-
2.
Results of Hypothesis 1 from the elastic-net-with-cross-validation models identified the non-zero variables listed in the Supplemental section, Table 2. Step 3 below shows the statistically significant results.
Table 2 Negative binomial regression analysis results of relationships between clinical outcome measures and predictors. -
3.
Regression analysis.
-
3.i.
Depression (Detailed statistical results, see Table 2 and Figure 1). Left pars opercularis thickness (B = 4.87, p = 0.002, q = 0.01) was positively related to depression. Left inferior temporal thickness (B = − 5.64, p ≤ 0.001, q = 0.003) was negatively related to depression.
Figure 1 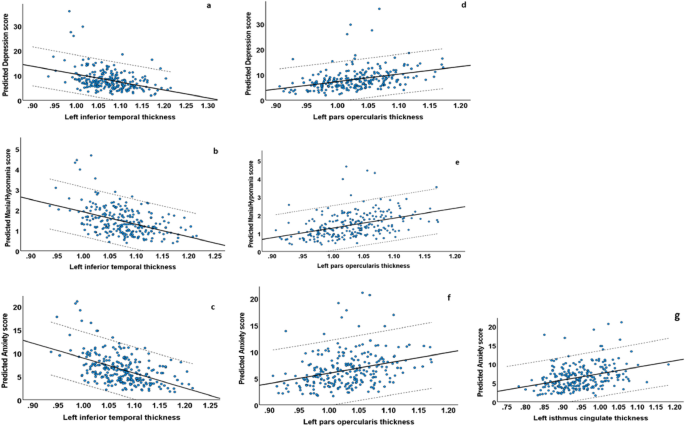
Scatterplots showing the relationships between GM thickness and mood and anxiety symptoms severity. (a) Predicted Hamilton Depression Scale and left inferior temporal thickness; (b) Predicted Young Mania Rating Scale and left inferior temporal thickness; (c) Predicted Hamilton Anxiety Scale and left inferior temporal thickness and left inferior temporal thickness; (d) Predicted Depression Scale and left pars opercularis thickness, (e) Predicted Young Mania Rating Scale and left pars opercularis thickness; (f) Predicted Hamilton Anxiety Scale and left pars opercularis thickness; (g) Predicted Hamilton Anxiety Scale and left isthmus cingulate thickness. Dashed lines represent 95% confidence intervals.
-
3.ii.
Mania/hypomania (Detailed statistical results, see Table 2 and Figure 1). Left pars opercularis thickness (B = 6.08, p ≤ 0.001, q ≤ 0.001) was positively related to mania/hypomania. Left inferior temporal thickness (B = − 6.47, p ≤ 0.001, q ≤ 0.001) was negatively related to mania/hypomania.
-
3.iii.
Anxiety (Detailed statistical results, see Table 2 and Figure 1). Left pars opercularis thickness (B = 4.68, p = 0.002, q = 0.009), and left isthmus cingulate thickness (B = 2.84, p = 0.01, q = 0.04) were positive related to anxiety. Left inferior temporal thickness (B = − 6.77, p ≤ 0.001, q ≤ 0.001) was negatively related to anxiety.
-
3.iv.
Composite pathology score (Detailed statistical results, see Supplemental section, Table 3). Left pars opercularis thickness (B = 5.49, p ≤ 0.001, q = 0.002) was positively related to the composite pathology score. Left inferior temporal thickness (B = − 6.13, p ≤ 0.001, q ≤ 0.001) was negatively related to the composite pathology score.
-
3.i.
-
4.
4. Mediation analysis.
-
Step I. To test Hypothesis 2 mediation analysis for each of the seven significant relationships from Analysis 3 was performed. Neuroticism was thus used as a mediator in seven mediation models for the following relationships: depression and left inferior temporal thickness, left pars opercularis thickness; mania/hypomania and left inferior temporal thickness, left pars opercularis thickness; anxiety and left inferior temporal thickness, left pars opercularis thickness, and left isthmus cingulate thickness. The total effect reflects the relationship between GM and symptoms before the inclusion of the mediator; the direct effect reflects the relationship between GM and symptoms after the inclusion of the mediator; the indirect effect reflects the mediation effect of Neuroticism on the relationship between GM and symptoms. The “a” path reflects the relationship between GM and Neuroticism; the “b” path reflects the relationship between Neuroticism and symptoms. For detailed statistical results, see Table 3.
Table 3 Mediation analysis of effect of Neuroticism (NEO PI-R Five Factor Inventory) on relationships between GM metrics and depression, anxiety, and mania/hypomania symptoms. -
4.i.
Depression. Neuroticism fully mediated the negative relationship between left inferior temporal thickness and depression (total effect: t = − 2.82, p ≤ 0.05; q ≤ 0.05; direct effect: t = − 1.73, p = 0.085; indirect effect = − 17.45, BootLLCI = − 32.95, BootULCI = − 2.75; “a” path: t = − 2.22, p ≤ 0.05; “b” path: t = 18.73, p ≤ 0.001).
-
4.ii.
Mania/hypomania. Neuroticism fully mediated the negative relationship between left inferior temporal thickness and mania/hypomania (total effect: t = − 2.16, p ≤ 0.05; q ≤ 0.05; direct effect: t = − 1.09, p = 0.276; indirect effect = − 2.91, BootLLCI = − 5.47, BootULCI = − 0.43; “a” path: t = − 2.22, p ≤ 0.05; “b” path: t = 10.81, p ≤ 0.001).
-
4.iii.
Anxiety. Neuroticism partially mediated the negative relationship between left inferior temporal thickness and anxiety (total effect: t = − 3.24, p ≤ 0.001; q ≤ 0.05; direct effect: t = − 2.36, p ≤ 0.05; indirect effect = − 14.52, BootLLCI = − 27.09, BootULCI = − 2.27; “a” path: t = − 2.22, p ≤ 0.05; “b” path: t = 17.63, p ≤ 0.001).
-
4.i.
-
Step II (Figure 2). One mediation analysis of neuroticism subfactors (N1 (anxiety), N2 (anger/hostility), N3 (depression), N4 (self-consciousness), N5 (impulsiveness), and N6(vulnerability) was performed for each DV (depression, mania, anxiety) and the left inferior temporal thickness that showed full or partial mediation in Analysis 5 Step I and survived FDR correction. For detailed statistical results, see Table 3.
Figure 2 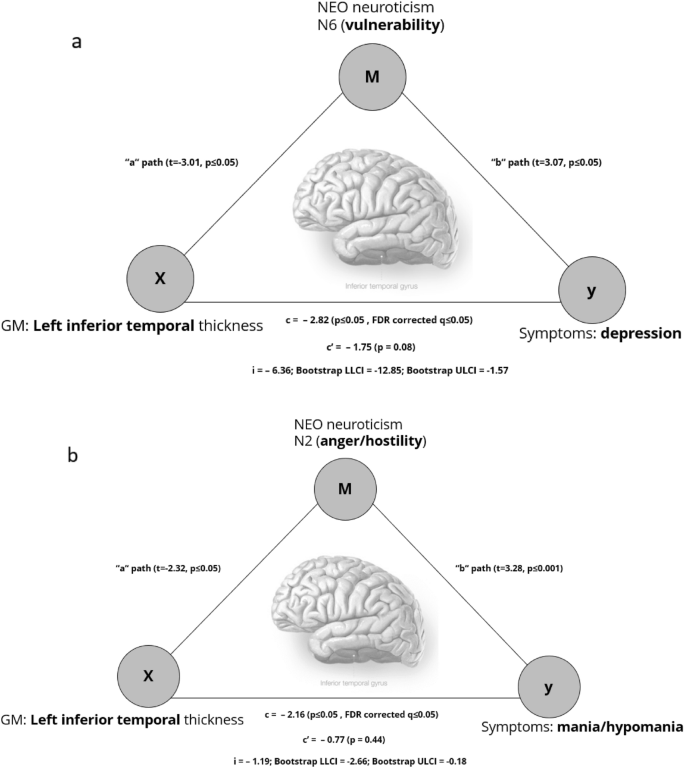
(a) Neuroticism subfactor N6 (vulnerabily) mediates the relationship between Left inferior temporal thickness and severity of depression, (b) Neuroticism subfactor N2 (anger/hostility) mediates the relationship between Left inferior temporal thickness and severity of mania/hypomania. X–GM thickness, M–mediator, Y–symptoms severity. (“a” path—the relationship between GM and neuroticism subfactor, “b” path—the relationship between neuroticism subfactor and symptoms, c—the total effect of the relationship between GM and symptoms, c’—the direct effect of the relationship between GM and symptoms, i—the indirect effect, CL—Bootstrap confidence intervals).
-
4.iv.
Depression. The NEO PI-R N6 subfactor (vulnerability) fully mediated the negative relationship between left inferior temporal thickness and depression (total effect: t = − 2.82, p ≤ 0.05; q ≤ 0.05; direct effect: t = − 1.75, p = 0.08; indirect effect: t = − 6.36, BootLLCI = − 12.85, BootULCI = − 1.57; “a” path: t = − 3.01, p ≤ 0.05; “b” path: t = 3.07, p ≤ 0.05).
-
4.v.
Mania/hypomania. The NEO PI-R N2 subfactor (anger/hostility) fully mediated the negative relationship between left inferior temporal thickness and mania/hypomania (total effect: t = − 2.16, p ≤ 0.05; q ≤ 0.05; direct effect: t = − 0.77, p = 0.44; indirect effect = − 1.19, BootLLCI = − 2.66, BootULCI = − 0.18; “a” path: t = − 2.32, p ≤ 0.05; “b” path: t = 3.28, p ≤ 0.001).
-
4.vi.
Anxiety. No Neuroticism subfactor showed any mediation effect on negative relationships between left inferior temporal thickness and anxiety.
-
4.vii.
Alternative pathways. No mediation effect of left inferior temporal thickness as a mediator was found on the positive relationship between the NEO PI-R N6 subfactor (vulnerability) and depression (total effect: t = 16.55, p ≤ 0.001; direct effect: t = 16.07, p ≤ 0.001; indirect effect = 0.01, BootLLCI = − 0.01, BootULCI = 0.04), and on the positive relationships between the NEO PI-R N2 subfactor (anger/hostility) and mania/hypomania (total effect: t = 8.77, p ≤ 0.001; direct effect: t = 8.51, p ≤ 0.001; indirect effect = 0.003, BootLLCI = − 0.001, BootULCI = 0.01).
-
4.iv.
-
-
5.
Sensitivity analysis. The analysis on the sample excluding participants with a current depression or anxiety diagnosis (n = 169) confirmed our main findings: left inferior temporal thickness was negatively related to anxiety (B = − 4.92, p = 0.01, q = 0.04), depression (B = − 6.12, p = 0.005, q = 0.03), and mania/hypomania (B = − 6.53, p = 0.007, q = 0.01); left pars opercularis thickness was positively related to anxiety (B = 7.21, p ≤ 0.001, q = 0.009), depression (B = − 5.71, p = 0.01, q = 0.04), and mania/hypomania (B = − 9.45, p ≤ 0.001, q ≤ 0.001) (Supplemental section, Table 5).


Discussion
Given that the role of GM cortical thickness in psychopathology remains unclear, we aimed to identify neural markers, associated with mood and anxiety symptoms in a large sample of young adults recruited across a range of subsyndromal to syndromal levels of these symptoms. Additionally, we explored the extent to which neuroticism mediated these relationships. We demonstrated common and distinct patterns of relationships between GM thickness in the left inferior temporal gyrus, the left pars opercularis, and the left isthmus cingulate, in relation to subsyndromal-syndromal symptoms. Specifically, we showed that cortical thickness in the left inferior temporal gyrus was negatively related to depression, anxiety, mania/hypomania, and composite pathology score, while cortical thickness in the left pars opercularis was positively related to these measures. Thickness in the left isthmus cingulate cortex was positively related to anxiety. The results also indicate that some of these relationships were mediated by neuroticism, where specific neuroticism subfactors explained the significant relationships between left inferior temporal gyrus cortical thickness and both mania/hypomania and depression. Specifically, the NEO subfactor anger/hostility mediated the negative relationship between left inferior temporal gyrus thickness and mania/hypomania; while the NEO subfactor vulnerability to stress mediated the relationship between left inferior temporal gyrus thickness and depression. The specificity of the directions of these pathways were supported by showing that cortical thickness measures did not mediate relationships between the above Neuroticism subfactors and mania/hypomania and depression. To our knowledge, this is the first study to examine tripartite relationships among cortical thickness, neuroticism subfactors, and mood and anxiety disorder risk.
Partially consistent with our first hypothesis, we observed negative relationships between left inferior temporal cortical thickness and the severity of anxiety, depression, mania/hypomania symptoms, aligning with previous studies that reported reduced inferior temporal gyrus thickness in adults with mood disorders24,29,30,35,36, and childhood abuse exposure and severity in adolescents98. Additionally, our composite pathology score supported this negative relationship with left inferior temporal cortical thickness. This region is known as a key part of the visual pathway implicated in object, face, and scene perception99. Functional connectivity studies have shown that this region is related to text-based memory100, and atrophy in this part of cortex is related to semantic dementia101. Taken together, these findings may point to cognitive deficits observed in both mood and anxiety102,103,104,105, underscoring the transdiagnostic relevance of this region in the susceptibility to mood and anxiety disorders.
We observed positive relationships between left pars opercularis thickness and severity of anxiety, depression, and mania/hypomania symptoms. Moreover, our analysis using the composite pathology score showed this same positive relationship with pars left pars opercularis, a part of ventrolateral prefrontal cortex, is involved in language production and comprehension106, and supports attention to unexpected stimuli107,108,109,110. These findings only partially support our hypotheses and parallel previous reports of a greater GM thickness in left pars opercularis in adults with depression34,48; however, other studies have shown lower cortical thickness in vlPFC in adults with BD31,36,37 and related to the number of (hypo)manic episodes111. Given that the vlPFC supports attention to unexpected and especially salient (e.g., negative emotional) stimuli107,108,109,110, and voluntary emotion regulation112, greater cortical thickness in this region might underlie greater attention to unexpected and negative emotional events in at-risk young adults. The combination of reduced inferior temporal gyrus thickness and associated cognitive deficits, and greater vlPFC cortical thickness associated with greater attention to unexpected and negative events, might thus result in greater mood and anxiety symptom severity.
Additionally, we observed anxiety-specific cortical thickening in the left isthmus cingulate cortex. This region supports internally directed thought113,114,115, and is involved in imagination, formation and consolidation of episodic memory116,117,118,119, and self-relevance assessment120. Given that we have not found an association between cortical thickness in this region and depression or mania/hypomania symptoms, perhaps thickening of the left isthmus cingulate cortex may suggest a link between internal thoughts and self-related memories and assessments, and development of anxiety symptoms. Thickness in this region may also help to differentiate the risk for anxiety disorders from the risk for mood disorders.
In support of our second hypothesis, relationships between GM cortical thickness and mood and anxiety symptoms severity were mediated by neuroticism, and by two neuroticism subfactors in particular—anger/hostility, and vulnerability. The anger/hostility subfactor mediated the relationship between left inferior temporal gyrus cortical thickness and mania/hypomania, where the relationship between lower inferior temporal gyrus cortical thickness and greater mania/hypomania severity was explained by higher levels of anger/hostility. Greater levels of anger have been reported in individuals with BD121,122,123. Our findings might thus reflect a neural mechanism linking neuroticism-related anger and predisposition to mania/hypomania. In addition, the vulnerability to stress subfactor mediated the relationship between left inferior temporal gyrus thickness and depression, where the relationship between lower inferior temporal gyrus cortical thickness and greater depression was explained by greater vulnerability, in support of the established role of stress in depression124,125,126. These mediation findings together suggest that neuroticism along with decreased left inferior temporal cortical thickness plays an important role in young adults at risk to mood, but not anxiety disorders. The fact that the mediation effects were shown to the vulnerability and not the depression subfactor of neuroticism might reflect differences in the nature of the HRSD and NEO PI-R depression subfactor as discussed above. Taken together, these findings may contribute to earlier diagnosis and treatment of mood disorders.
A potential limitation of the study was the heterogenous sample, with some participants having anxiety and depressive disorders. Sensitivity analyses showed, however, that in participants without depressive or anxiety disorders, our principal findings remained consistent: a negative relationship was observed between left inferior temporal thickness and all three measures of symptom severity, while a positive relationship was identified with left pars opercularis thickness. Although our study included a large sample of young adults, replication of our findings in future studies is needed. Longitudinal studies can provide more precise inferences about the potential directionality and consistency of these relationships over time. It will also be beneficial to test these relationships in other age groups along with sex differences.
To our knowledge, the present study of a large sample of unmedicated young adults recruited across a broad range of subsyndromal to syndromal mood and anxiety symptoms measured with clinically valid and sensitive assessments, is the first to explore tripartite relationships among cortical GM thickness, neuroticism and its subfactors, and mood and anxiety symptoms severity. Given that neuroticism is closely related to mood and anxiety symptoms, examining the interrelationships among cortical thickness, neuroticism and mood and anxiety symptoms enriches the potential for identifying markers conferring risk for mood and anxiety disorders and targets for personalized intervention strategies for these disorders.
Data availability
The datasets used and/or analyzed during the current study available from the corresponding author on reasonable request.
References
Hunt, J. & Eisenberg, D. Mental health problems and help-seeking behavior among college students. J. Adolesc. Health Off. Publ. Soc. Adolesc. Med. 46, 3–10 (2010).
Westberg, K. H., Nyholm, M., Nygren, J. M. & Svedberg, P. Mental health problems among young people—A scoping review of help-seeking. Int. J. Environ. Res. Public. Health 19, 1430 (2022).
Lahey, B. B. Public health significance of neuroticism. Am. Psychol. 64, 241–256 (2009).
Widiger, T. A. & Oltmanns, J. R. Neuroticism is a fundamental domain of personality with enormous public health implications. World Psychiatry 16, 144–145 (2017).
Eysenck, H. J. The biological basis of personality. (Spring-field, Ill., 1967).
Clark, L. A., Watson, D. & Mineka, S. Temperament, personality, and the mood and anxiety disorders. J. Abnorm. Psychol. 103, 103–116 (1994).
Gray, J. A. & McNaughton, N. The neuropsychology of anxiety (Oxford University Press, 2000).
Goodwin, R. D., Fergusson, D. M. & Horwood, L. J. Neuroticism in adolescence and psychotic symptoms in adulthood. Psychol. Med. 33, 1089–1097 (2003).
Malouff, J. M., Thorsteinsson, E. B. & Schutte, N. S. The relationship between the five-factor model of personality and symptoms of clinical disorders: A meta-analysis. J. Psychopathol. Behav. Assess. 27, 101–114 (2005).
Khan, A. A., Jacobson, K. C., Gardner, C. O., Prescott, C. A. & Kendler, K. S. Personality and comorbidity of common psychiatric disorders. Br. J. Psychiatry J. Ment. Sci. 186, 190–196 (2005).
Jylhä, P. & Isometsä, E. The relationship of neuroticism and extraversion to symptoms of anxiety and depression in the general population. Depress. Anxiety 23, 281–289 (2006).
Mennin, D. S., Holaway, R. M., Fresco, D. M., Moore, M. T. & Heimberg, R. G. Delineating components of emotion and its dysregulation in anxiety and mood psychopathology. Behav. Ther. 38, 284–302 (2007).
Widiger, T. A., M. R. Handbook of Individual Differences in Social Behavior. xv, 624 (The Guilford Press, 2009).
Kotov, R., Gamez, W., Schmidt, F. & Watson, D. Linking ‘big’ personality traits to anxiety, depressive, and substance use disorders: A meta-analysis. Psychol. Bull. 136, 768–821 (2010).
Griffith, J. W. et al. Neuroticism as a common dimension in the internalizing disorders. Psychol. Med. 40, 1125–1136 (2010).
Paulus, D. J., Vanwoerden, S., Norton, P. J. & Sharp, C. From neuroticism to anxiety: Examining unique contributions of three transdiagnostic vulnerability factors. Personal. Individ. Differ. 94, 38–43 (2016).
Zinbarg, R. E. et al. Testing a hierarchical model of neuroticism and its cognitive facets: Latent structure and prospective prediction of first onsets of anxiety and unipolar mood disorders during 3 years in late adolescence. Clin. Psychol. Sci. 4, 805–824 (2016).
Jovicich, J. et al. Brain morphometry reproducibility in multi-center 3T MRI studies: A comparison of cross-sectional and longitudinal segmentations. NeuroImage 83, 472–484 (2013).
Madan, C. R. & Kensinger, E. A. Test–retest reliability of brain morphology estimates. Brain Inform. 4, 107–121 (2017).
Melzer, T. R. et al. Test-retest reliability and sample size estimates after MRI scanner relocation. NeuroImage 211, 116608 (2020).
Velázquez, J., Mateos, J., Pasaye, E. H., Barrios, F. A. & Marquez-Flores, J. A. Cortical thickness estimation: A comparison of FreeSurfer and three voxel-based methods in a test-retest analysis and a clinical application. Brain Topogr. 34, 430–441 (2021).
Lyoo, I. K. et al. Regional cerebral cortical thinning in bipolar disorder. Bipolar Disord. 8, 65–74 (2006).
Fornito, A. et al. Anatomical abnormalities of the anterior cingulate and paracingulate cortex in patients with bipolar I disorder. Psychiatry Res. 162, 123–132 (2008).
Elvsåshagen, T. et al. Bipolar II disorder is associated with thinning of prefrontal and temporal cortices involved in affect regulation. Bipolar Disord. 15, 855–864 (2013).
Lan, M. J. et al. Cortical thickness differences between bipolar depression and major depressive disorder. Bipolar Disord. 16, 378–388 (2014).
Abé, C. et al. Cortical thickness, volume and surface area in patients with bipolar disorder types I and II. J. Psychiatry Neurosci. JPN 41, 240–250 (2016).
Hanford, L. C., Nazarov, A., Hall, G. B. & Sassi, R. B. Cortical thickness in bipolar disorder: A systematic review. Bipolar Disord. 18, 4–18 (2016).
Zhao, Y. et al. Gray matter abnormalities in non-comorbid medication-naive patients with major depressive disorder or social anxiety disorder. eBioMedicine 21, 228–235 (2017).
Zhao, K. et al. Cortical thickness and subcortical structure volume abnormalities in patients with major depression with and without anxious symptoms. Brain Behav. 7, e00754 (2017).
Niu, M. et al. Common and specific abnormalities in cortical thickness in patients with major depressive and bipolar disorders. eBioMedicine 16, 162–171 (2017).
Hibar, D. P. et al. Cortical abnormalities in bipolar disorder: An MRI analysis of 6503 individuals from the ENIGMA Bipolar Disorder Working Group. Mol. Psychiatry 23, 932–942 (2018).
Molent, C. et al. Reduced cortical thickness and increased gyrification in generalized anxiety disorder: A 3 T MRI study. Psychol. Med. 48, 2001–2010 (2018).
Besteher, B., Gaser, C. & Nenadić, I. Brain structure and subclinical symptoms: A dimensional perspective of psychopathology in the depression and anxiety spectrum. Neuropsychobiology 79, 270–283 (2019).
Suh, J. S. et al. Cortical thickness in major depressive disorder: A systematic review and meta-analysis. Prog. Neuropsychopharmacol. Biol. Psychiatry 88, 287–302 (2019).
Zak, N. et al. Mood episodes are associated with increased cortical thinning: A longitudinal study of bipolar disorder type II. Bipolar Disord. 21, 525–538 (2019).
Ching, C. R. K. et al. What we learn about bipolar disorder from large-scale neuroimaging: Findings and future directions from the ENIGMA Bipolar Disorder Working Group. Hum. Brain Mapp. 43, 56–82 (2022).
Zhu, Z. et al. Cortical thickness abnormalities in patients with bipolar disorder: A systematic review and meta-analysis. J. Affect. Disord. 300, 209–218 (2022).
Abé, C., Liberg, B., Klahn, A. L., Petrovic, P. & Landén, M. Mania-related effects on structural brain changes in bipolar disorder - a narrative review of the evidence. Mol. Psychiatry https://doi.org/10.1038/s41380-023-02073-4 (2023).
Zhukovsky, P. et al. Multiscale neural signatures of major depressive, anxiety, and stress-related disorders. Proc. Natl. Acad. Sci. USA 119, e2204433119 (2022).
Peterson, B. S. et al. Cortical thinning in persons at increased familial risk for major depression. Proc. Natl. Acad. Sci. USA 106, 6273–6278 (2009).
Papmeyer, M. et al. Cortical thickness in individuals at high familial risk of mood disorders as they develop major depressive disorder. Biol. Psychiatry 78, 58–66 (2015).
Hanford, L. C., Sassi, R. B., Minuzzi, L. & Hall, G. B. Cortical thickness in symptomatic and asymptomatic bipolar offspring. Psychiatry Res. Neuroimaging 251, 26–33 (2016).
Pink, A. et al. Cortical thickness and anxiety symptoms among cognitively normal elderly persons: The mayo clinic study of aging. J. Neuropsychiatry Clin. Neurosci. 29, 60–66 (2017).
Nazarova, A., Schmidt, M., Cookey, J. & Uher, R. Neural markers of familial risk for depression - A systematic review. Dev. Cogn. Neurosci. 58, 101161 (2022).
Szymkowicz, S. M. et al. Depressive symptom severity is associated with increased cortical thickness in older adults. Int. J. Geriatr. Psychiatry 31, 325–333 (2016).
Frick, A. et al. Cortical thickness alterations in social anxiety disorder. Neurosci. Lett. 536, 52–55 (2013).
Brühl, A. B. et al. Increased cortical thickness in a frontoparietal network in social anxiety disorder. Hum. Brain Mapp. 35, 2966–2977 (2014).
Fonseka, B. A., Jaworska, N., Courtright, A., MacMaster, F. P. & MacQueen, G. M. Cortical thickness and emotion processing in young adults with mild to moderate depression: A preliminary study. BMC Psychiatry 16, 38 (2016).
DeYoung, C. G. et al. Testing predictions from personality neuroscience. Brain structure and the big five. Psychol. Sci. 21, 820–828 (2010).
Jackson, J., Balota, D. A. & Head, D. Exploring the relationship between personality and regional brain volume in healthy aging. Neurobiol. Aging 32, 2162–2171 (2011).
Kapogiannis, D., Sutin, A., Davatzikos, C., Costa, P. & Resnick, S. The five factors of personality and regional cortical variability in the baltimore longitudinal study of aging. Hum. Brain Mapp. 34, 2829–2840 (2012).
Bjørnebekk, A. et al. Neuronal correlates of the five factor model (FFM) of human personality: Multimodal imaging in a large healthy sample. NeuroImage 65, 194–208 (2013).
Lu, F. et al. Relationship between personality and gray matter volume in healthy young adults: A voxel-based morphometric study. PloS One 9, e88763 (2014).
Liu, X. et al. Gray matter structures associated with neuroticism: A meta-analysis of whole-brain voxel-based morphometry studies. Hum. Brain Mapp. 42, 2706–2721 (2021).
Privado, J., Román, F. J., Saénz-Urturi, C., Burgaleta, M. & Colom, R. Gray and white matter correlates of the Big Five personality traits. Neuroscience 349, 174–184 (2017).
Hyatt, C. S. et al. Personality traits share overlapping neuroanatomical correlates with internalizing and externalizing psychopathology. J. Abnorm. Psychol. 128, 1–11 (2019).
Avinun, R., Israel, S., Knodt, A. R. & Hariri, A. R. Little evidence for associations between the Big Five personality traits and variability in brain gray or white matter. NeuroImage 220, 117092 (2020).
Wright, C. I., Feczko, E., Dickerson, B. & Williams, D. Neuroanatomical correlates of personality in the elderly. NeuroImage 35, 263–272 (2007).
Owens, M. M. et al. Cortical morphometry of the five-factor model of personality: Findings from the human connectome project full sample. Soc. Cogn. Affect. Neurosci. 14, 381–395 (2019).
Østby, Y. et al. Heterogeneity in subcortical brain development: A structural magnetic resonance imaging study of brain maturation from 8 to 30 years. J. Neurosci. 29, 11772–11782 (2009).
Groeschel, S., Vollmer, B., King, M. D. & Connelly, A. Developmental changes in cerebral grey and white matter volume from infancy to adulthood. Int. J. Dev. Neurosci. 28, 481–489 (2010).
Tamnes, C. K. et al. Brain maturation in adolescence and young adulthood: Regional age-related changes in cortical thickness and white matter volume and microstructure. Cereb. Cortex 1991(20), 534–548 (2010).
Solmi, M. et al. Age at onset of mental disorders worldwide: Large-scale meta-analysis of 192 epidemiological studies. Mol. Psychiatry 27, 281–295 (2022).
Costa, P. T., Jr. & McCrae, R. R. The Revised NEO Personality Inventory (NEO-PI-R). in The SAGE Handbook of Personality Theory and Assessment: Volume 2 — Personality Measurement and Testing 179–198 (SAGE Publications Ltd, 2008). https://doi.org/10.4135/9781849200479.
Hamilton, M. The assessment of anxiety states by rating. Br. J. Med. Psychol. 32, 50–55 (1959).
Hamilton, M. A rating scale for depression. J. Neurol. Neurosurg. Psychiatry 23, 56–62 (1960).
Hayes, A. F. Beyond Baron and Kenny: statistical mediation analysis in the new millennium. Commun. Monogr. 76, 408–420 (2009).
Hayes. Introduction to Mediation, Moderation, and Conditional Process Analysis: Third Edition: A Regression-Based Approach. Guilford Press https://www.guilford.com/books/Introduction-to-Mediation-Moderation-and-Conditional-Process-Analysis/Andrew-Hayes/9781462549030 (2022).
Kong, X. et al. Neuroticism and extraversion mediate the association between loneliness and the dorsolateral prefrontal cortex. Exp. Brain Res. 233, 157–164 (2015).
Zhu, X., Wang, K., Cao, A., Zhang, Y. & Qiu, J. Personality traits and negative affect mediate the relationship between cortical thickness of superior frontal cortex and aggressive behavior. Neurosci. Lett. 718, 134728 (2020).
Frangou, S. et al. Cortical thickness across the lifespan: Data from 17,075 healthy individuals aged 3–90 years. Hum. Brain Mapp. 43, 431–451 (2022).
Rachman, S. Extraversion and Neuroticism in Childhood. in Personality Structure and Measurement (Psychology Revivals) (Routledge, 1969).
Muris, P., de Jong, P. J. & Engelen, S. Relationships between neuroticism, attentional control, and anxiety disorders symptoms in non-clinical children. Personal. Individ. Differ. 37, 789–797 (2004).
McAdams, D. P., Shiner, R. L. & Tackett, J. L. Handbook of Personality Development (Guilford Publications, 2018).
Costa Jr., P. T. & McCrae, R. R. Set like plaster? Evidence for the stability of adult personality. in Can personality change? 21–40 (American Psychological Association, 1994). https://doi.org/10.1037/10143-002.
Roberts, B. W. & DelVecchio, W. F. The rank-order consistency of personality traits from childhood to old age: A quantitative review of longitudinal studies. Psychol. Bull. 126, 3–25 (2000).
Steunenberg, B., Twisk, J. W. R., Beekman, A. T. F., Deeg, D. J. H. & Kerkhof, A. J. F. M. Stability and change of neuroticism in aging. J. Gerontol. B. Psychol. Sci. Soc. Sci. 60, P27-33 (2005).
Roberts, B. W., Walton, K. E. & Viechtbauer, W. Patterns of mean-level change in personality traits across the life course: A meta-analysis of longitudinal studies. Psychol. Bull. 132, 1–25 (2006).
Rantanen, J., Metsäpelto, R.-L., Feldt, T., Pulkkinen, L. & Kokko, K. Long-term stability in the Big Five personality traits in adulthood. Scand. J. Psychol. 48, 511–518 (2007).
Nivard, M. G., Middeldorp, C. M., Dolan, C. V. & Boomsma, D. I. Genetic and environmental stability of neuroticism from adolescence to adulthood. Twin Res. Hum. Genet. 18, 746–754 (2015).
de Lijster, J. M. et al. The age of onset of anxiety disorders. Can. J. Psychiatry Rev. Can. Psychiatr. 62, 237–246 (2017).
Goodwin, R. D., Weinberger, A. H., Kim, J. H., Wu, M. & Galea, S. Trends in anxiety among adults in the United States, 2008–2018: Rapid increases among young adults. J. Psychiatr. Res. 130, 441–446 (2020).
Insel, T. et al. Research domain criteria (RDoC): Toward a new classification framework for research on mental disorders. Am. J. Psychiatry 167, 748–751 (2010).
Cuthbert, B. N. The RDoC framework: Facilitating transition from ICD/DSM to dimensional approaches that integrate neuroscience and psychopathology. World Psychiatry Off. J. World Psychiatr. Assoc. WPA 13, 28–35 (2014).
Kotov, R. et al. The hierarchical taxonomy of psychopathology (HiTOP): A dimensional alternative to traditional nosologies. J. Abnorm. Psychol. 126, 454–477 (2017).
WMA - The World Medical Association-WMA Declaration of Helsinki – Ethical Principles for Medical Research Involving Human Subjects. https://www.wma.net/policies-post/wma-declaration-of-helsinki-ethical-principles-for-medical-research-involving-human-subjects/.
First, M., Williams, J. B. W., Karg, R. S. & Spitzer, R. L. Structured Clinical Interview for DSM-5—Research Version (SCID-5 for DSM-5, Research Version; SCID-5-RV) (2015).
Young, R. C., Biggs, J. T., Ziegler, V. E. & Meyer, D. A. A rating scale for mania: Reliability, validity and sensitivity. Br. J. Psychiatry J. Ment. Sci. 133, 429–435 (1978).
Folstein, M. F., Folstein, S. E. & McHugh, P. R. ‘Mini-mental state’. A practical method for grading the cognitive state of patients for the clinician. J. Psychiatr. Res. 12, 189–198 (1975).
Blair, J. R. & Spreen, O. Predicting premorbid IQ: A revision of the national adult reading test. Clin. Neuropsychol. 3, 129–136 (1989).
Annett, M. A classification of hand preference by association analysis. Br. J. Psychol. Lond. Engl. 1953(61), 303–321 (1970).
Friedman, J. H., Hastie, T. & Tibshirani, R. Regularization paths for generalized linear models via coordinate descent. J. Stat. Softw. 33, 1–22 (2010).
Simon, N., Friedman, J. H., Hastie, T. & Tibshirani, R. Regularization paths for Cox’s proportional hazards model via coordinate descent. J. Stat. Softw. 39, 1–13 (2011).
Tibshirani, R. Regression shrinkage and selection via the lasso. J. R. Stat. Soc. Ser. B Methodol. 58, 267–288 (1996).
Zou, H. & Hastie, T. Regularization and variable selection via the elastic net. J. R. Stat. Soc. Ser. B Stat. Methodol. 67, 301–320 (2005).
Benjamini, Y. & Hochberg, Y. Controlling the false discovery rate: A practical and powerful approach to multiple testing. J. R. Stat. Soc. Ser. B Methodol. 57, 289–300 (1995).
Ver Hoef, J. M. & Boveng, P. L. Quasi-poisson vs. negative binomial regression: How should we model overdispersed count data?. Ecology 88, 2766–2772 (2007).
Gold, A. L. et al. Childhood abuse and reduced cortical thickness in brain regions involved in emotional processing. J. Child Psychol. Psychiatry 57, 1154–1164 (2016).
Conway, B. R. The organization and operation of inferior temporal cortex. Annu. Rev. Vis. Sci. 4, 381–402 (2018).
Zhang, M., Savill, N., Margulies, D. S., Smallwood, J. & Jefferies, E. Distinct individual differences in default mode network connectivity relate to off-task thought and text memory during reading. Sci. Rep. 9, 16220 (2019).
Chan, D. et al. Patterns of temporal lobe atrophy in semantic dementia and Alzheimer’s disease. Ann. Neurol. 49, 433–442 (2001).
Hammar, A. & Ardal, G. Cognitive functioning in major depression–a summary. Front. Hum. Neurosci. 3, 26 (2009).
Moran, T. P. Anxiety and working memory capacity: A meta-analysis and narrative review. Psychol. Bull. 142, 831–864 (2016).
Warren, S. L., Heller, W. & Miller, G. A. The structure of executive dysfunction in depression and anxiety. J. Affect. Disord. 279, 208–216 (2021).
Luo, W. et al. Disorder-specific impaired neurocognitive function in major depression and generalized anxiety disorder. J. Affect. Disord. 318, 123–129 (2022).
Stinnett, T. J., Reddy, V. & Zabel, M. K. Neuroanatomy, Broca Area (StatPearls Publishing, 2023).
Bishop, S., Duncan, J., Brett, M. & Lawrence, A. D. Prefrontal cortical function and anxiety: Controlling attention to threat-related stimuli. Nat. Neurosci. 7, 184–188 (2004).
Levy, B. J. & Wagner, A. D. Cognitive control and right ventrolateral prefrontal cortex: Reflexive reorienting, motor inhibition, and action updating. Ann. N. Y. Acad. Sci. 1224, 40–62 (2011).
Korponay, C. Snapping out of autopilot: Overriding habits in real time and the role of ventrolateral prefrontal cortex. Perspect. Psychol. Sci. J. Assoc. Psychol. Sci. 18, 482–490 (2023).
Weintraub-Brevda, R. Understanding the Role of the Ventrolateral Prefrontal Cortex in Emotional Memory using Transcranial Direct Current Stimulation and Transcranial Magnetic Stimulation. Diss. Theses Capstone Proj. (2017).
Abé, C. et al. Longitudinal structural brain changes in bipolar disorder: A multicenter neuroimaging study of 1232 individuals by the ENIGMA Bipolar Disorder Working Group. Biol. Psychiatry 91, 582–592 (2022).
Phillips, M. L., Ladouceur, C. D. & Drevets, W. C. A neural model of voluntary and automatic emotion regulation: Implications for understanding the pathophysiology and neurodevelopment of bipolar disorder. Mol. Psychiatry 13, 833–857 (2008).
Vogt, B. A. & Laureys, S. Posterior cingulate, precuneal and retrosplenial cortices: Cytology and components of the neural network correlates of consciousness. Prog. Brain Res. 150, 205–217 (2005).
Addis, D. R., Wong, A. T. & Schacter, D. L. Remembering the past and imagining the future: Common and distinct neural substrates during event construction and elaboration. Neuropsychologia 45, 1363–1377 (2007).
Buckner, R. L., Andrews-Hanna, J. R. & Schacter, D. L. The brain’s default network: anatomy, function, and relevance to disease. Ann. N. Y. Acad. Sci. 1124, 1–38 (2008).
Vogt, B. A., Finch, D. M. & Olson, C. R. Functional heterogeneity in cingulate cortex: The anterior executive and posterior evaluative regions. Cereb. Cortex 2, 435–443 (1992).
Vann, S. D., Aggleton, J. P. & Maguire, E. A. What does the retrosplenial cortex do?. Nat. Rev. Neurosci. 10, 792–802 (2009).
Kaboodvand, N., Bäckman, L., Nyberg, L. & Salami, A. The retrosplenial cortex: A memory gateway between the cortical default mode network and the medial temporal lobe. Hum. Brain Mapp. 39, 2020–2034 (2018).
Rolls, E. T., Wirth, S., Deco, G., Huang, C. & Feng, J. The human posterior cingulate, retrosplenial, and medial parietal cortex effective connectome, and implications for memory and navigation. Hum. Brain Mapp. 44, 629–655 (2022).
Vogt, B. A. Pain and emotion interactions in subregions of the cingulate gyrus. Nat. Rev. Neurosci. 6, 533–544 (2005).
Ballester, J. et al. Is bipolar disorder specifically associated with aggression?. Bipolar Disord. 14, 283–290 (2012).
Ballester, J. et al. Prospective longitudinal course of aggression among adults with bipolar disorder. Bipolar Disord. 16, 262–269 (2014).
Mesbah, R. et al. Anger and cluster B personality traits and the conversion from unipolar depression to bipolar disorder. Depress. Anxiety 38, 671–681 (2021).
Ross, R. A., Foster, S. L. & Ionescu, D. F. The role of chronic stress in anxious depression. Chronic Stress Thousand Oaks Calif 1, 2470547016689472 (2017).
Tafet, G. E. & Nemeroff, C. B. The links between stress and depression: Psychoneuroendocrinological, genetic, and environmental interactions. J. Neuropsychiatry Clin. Neurosci. 28, 77–88 (2016).
van Praag, H. M. Can stress cause depression?. Prog. Neuropsychopharmacol. Biol. Psychiatry 28, 891–907 (2004).
Acknowledgements
Drs. Rozovsky, Bertocci, Iyengar, Bebko, Phillips, and Ms. Stiffler, Mr. Skeba, Brady, Aslam report no competing interests. We did not preregister the research or analysis in an independent, institutional registry.
Funding
This study was supported by the National Institute of Mental Health (R37MH100041, PI Phillips), and the Pittsburgh Foundation (PI Phillips).
Author information
Authors and Affiliations
Contributions
R.R., M.A.B., and M.L.P. conceived of and wrote the manuscript; R.R. completed the analyses; R.R., M.A.B., S.I., and M.L.P. conceived of and interpreted the statistical analysis; R.S., H.A., G.B., A.S., and T.B. contributed substantially to the acquisition and processing of the data. All authors made significant contributions to the manuscript, and all approved the final version.
Corresponding author
Ethics declarations
Competing interests
Drs. Rozovsky, Bertocci, Iyengar, Bebko, Phillips, and Ms. Stiffler, Mr. Skeba, Brady, Aslam report no competing interests.
Additional information
Publisher's note
Springer Nature remains neutral with regard to jurisdictional claims in published maps and institutional affiliations.
Supplementary Information
Rights and permissions
Open Access This article is licensed under a Creative Commons Attribution 4.0 International License, which permits use, sharing, adaptation, distribution and reproduction in any medium or format, as long as you give appropriate credit to the original author(s) and the source, provide a link to the Creative Commons licence, and indicate if changes were made. The images or other third party material in this article are included in the article's Creative Commons licence, unless indicated otherwise in a credit line to the material. If material is not included in the article's Creative Commons licence and your intended use is not permitted by statutory regulation or exceeds the permitted use, you will need to obtain permission directly from the copyright holder. To view a copy of this licence, visit http://creativecommons.org/licenses/by/4.0/.
About this article

Cite this article
Rozovsky, R., Bertocci, M., Iyengar, S. et al. Identifying tripartite relationship among cortical thickness, neuroticism, and mood and anxiety disorders. Sci Rep 14, 8449 (2024). https://doi.org/10.1038/s41598-024-59108-1
Received:
Accepted:
Published:
DOI: https://doi.org/10.1038/s41598-024-59108-1
Keywords
Comments
By submitting a comment you agree to abide by our Terms and Community Guidelines. If you find something abusive or that does not comply with our terms or guidelines please flag it as inappropriate.
