
Abstract
Textile industry wastewater containing toxic dyes and high COD poses environmental hazards and requires treatment before discharge. This study addresses the challenge of treating complex textile wastewater using a novel integrated system. The system combines sedimentation, screening, adsorption, and an optimized solar photo-Fenton process to provide a sustainable treatment solution. A novel parabolic collector with a larger absorber tube diameter enhances solar radiation utilization at lower catalyst concentrations. This design is versatile, treating all types of wastewaters, especially those that contain colors, smells, solid and suspended materials, in addition to its importance for the treatment of difficult substances that may be present in industrial and sewage wastewaters that are difficult to dispose of by traditional treatment methods. Multivariate experiments optimized key photo-Fenton parameters (pH, catalyst dose, etc.) achieving significant pollutant removal (85% COD, 82% TOC, complete color) under specific conditions (pH 3, 0.2 g/L Fe(II), 1 mL/L H2O2, 40 °C and 100 L/h flow rate after 60 min irradiation). Kinetic modeling revealed second-order reaction kinetics, and multivariate regression analysis led to the development of models predicting treatment efficiency based on process factors. The key scientific contributions are the integrated system design combining conventional and advanced oxidation technologies, novel collector configuration for efficient utilization of solar radiation, comprehensive process optimization through multivariate experiments, kinetic modeling and predictive modeling relating process factors to pollutant degradation. This provides an economical green solution for textile wastewater treatment and reuse along with useful design guidelines. The treatment methodology and modeling approach make valuable additions for sustainable management of textile industry wastewater.
Introduction
Textile industry wastewater generated from dyeing and finishing processes poses a significant environmental challenge due to its high pollutant load and recalcitrant nature. It is characterized by high chemical oxygen demand (COD), intense coloration, and the presence of toxic synthetic dyes1,2,3. Conventional biological methods have limited efficiency for treatment of such wastewater. Although physico-chemical techniques like coagulation, precipitation and adsorption can remove some pollutants, they have disadvantages like sludge generation requiring additional treatment and disposal4,5.
Advanced oxidation processes (AOPs) using hydroxyl radicals have emerged as a promising technology for treating textile wastewater through oxidative degradation of organics. Processes such as O3/H2O2, UV/H2O2, UV/O3 and photocatalysis using TiO2 have been studied6,7. Among AOPs, the solar photo-Fenton process has attracted attention as a green, economical alternative leveraging natural sunlight and catalyzed H2O2 for wastewater treatment8,9,10,11,12.
Advanced oxidation processes (AOPs) offer promising wastewater treatment due to their high efficiency, broad applicability, rapid degradation rates, and environmental friendliness compared to other methods13. Though, their initial and operational costs can be high. Integrating AOPs with physicochemical and/or biological techniques offers a cost-effective and sustainable solution for wastewater remediation and clean water production.
Despite adsorption boasts advantages in simplicity and cost-effectiveness13,14,15, its limitations include incomplete pollutant removal, particularly for complex wastewater, slow processing times, and the need for continuous adsorbent regeneration. Integrating adsorption with AOPs can overcome this limitation by combining adsorption's removal capacity with AOPs' degradation capabilities for effective pollutant removal16.
AOPs can regenerate spent adsorbents in adsorption by degrading pollutants17. This combined approach can even be designed for simultaneous operation and improved mass transfer, leading to synergistic pollutant degradation16,18,19.
Despite prior work, major knowledge gaps persist in implementing solar photo-Fenton for textile wastewater treatment:
Lack of studies on an integrated system combining conventional and AOP technologies for overall effectiveness and cost savings20.
Limited reactor designs and non-optimal operational conditions leading to inefficient utilization of solar irradiation21,22.
Deficiencies in process optimization to maximize pollutant degradation through key factors like pH, catalyst dose, H2O2 concentration and temperature23,24.
Absence of kinetic analysis and predictive modelling relating process params to treatment efficiency25,26. For that reason, the objectives of this study are:
-
1.
To design an innovative integrated wastewater treatment system incorporating sedimentation, screening, adsorption, and optimized solar photo-Fenton oxidation.
-
2.
To implement a novel parabolic collector reactor enabling effective radiation capture.
-
3.
To optimize the operational params of solar photo-Fenton through multivariate experimental design.
-
4.
To perform kinetic modelling and develop efficiency prediction models for the process through regression analysis.
The integrated system and modeling approach aim to provide an economical green solution for textile industry wastewater treatment and reuse. For giving the research more credibility and realism, a real wastewater from an important local industry from an industrial area in Egypt for textile industries was selected as a case study. This wastewater was used without any dilution or pretreatment.
The key innovations and contributions of this manuscript are:
-
Design of an integrated wastewater treatment system incorporating both conventional processes (sedimentation, screening, adsorption) and advanced oxidation processes (solar photo-Fenton) for efficient treatment of textile industry effluent.
-
Optimization of operational params for the solar photo-Fenton process, including irradiation time, pH, Fe(II) dosage, H2O2 concentration, temperature, and flow rate to achieve high removal efficiencies for COD, TOC and colour.
-
Use of an innovative compound parabolic collector with increased absorber tube diameter for the solar photo-Fenton reactor. This allowed effective radiation absorption with lower catalyst concentrations, reducing capital costs.
-
Kinetic analysis of COD removal indicating conformance to 2nd order reaction kinetics for the solar photo-Fenton process.
-
Development of efficiency prediction models/correlations for the photo-Fenton process through multivariate regression analysis using least squares method. These models relate process factors like Fe(II) dose, H2O2, pH, temperature and flow rate to removal efficiencies.
The essence of the contribution lies in providing a comprehensive and optimized treatment methodology integrating conventional and advanced oxidation processes for effective treatment of recalcitrant textile wastewater. The integrated system design, process optimization, novel collector reactor configuration, kinetic modelling, and development of predictive models offer a valuable framework for industrial implementation of solar photo-Fenton for wastewater treatment and reuse in the textile sector.
Experimental work
Materials utilized
GP grad chemicals namely, ferrous sulfate (FeSO4・7H2O) which is named as Fenton reagent, sulfuric acid (H2SO4), (30% w/v) hydrogen peroxide (H2O2), activated charcoal (0.25 micro particle size), chlorine (Cl2) and sodium hydroxide (NaOH) were used without any purification were offered by Merck.
Source of wastewater
This study utilized real wastewater obtained from an industrial textile plant in gathered from a plant in El Sadat City Desert, Menofia Governorate, Egypt as a case study. Approximately 1000 m3 of untreated wastewater per d was discharged into a nearby pond by the mill. The wastewater exhibited significant pollution levels, including high concentrations of suspended particles and organic contaminants. Samples were collected directly from the outlet pipe without any additional treatment. The characterization and analysis of these effluents, including params such as chemical oxygen demand (COD), total organic carbon (TOC), and other physicochemical properties, were conducted following the procedures described in Standard Methods for the Examination of Water and Wastewater (1998)27 and Standard Methods for the Examination of Water and Wastewater (APHA, AWWA, 2005)28. Table 1 exhibits some of the important properties and params of the wastewater.
Set-up
In this investigation, a laboratory bench-scale unit was developed to treat wastewater effluent from a textile factory. The objective was to treat the wastewater and make it suitable for irrigation purposes in the large surrounding area. Figure 1a,b elucidates the schematic diagram of the process and a photograph of the integrated experimental setup that was designed for this purpose.

(a) and (b). Schematic diagram and a photo of the integrated designed experimental set-up.
A bench-scale treatment unit designed for reusing treated textile wastewater for irrigation (Fig. 2) utilizes multiple stages. First, a 10 L propylene sedimentation tank removes large solids. A 3 cm diameter screener with fine pores (0.06–0.25 inches) captures floating pollutants. Activated carbon pretreatment (10 cm diameter, 26 cm height, 0.25-micron particles) removes color, odor, and organic load. The core treatment involves a solar photocatalytic oxidation unit that combines adsorption and oxidation of persistent pollutants. Wastewater is mixed with Fenton reagent (catalyst) and H2O2 (oxidant) in a 10 L mixing tank equipped with a mixer for homogenous blending. A non-concentrating parabolic reflector (4 m2 surface area) collects UV light. The reaction chamber is a 1.5 m long, 5 cm diameter transparent glass tube reactor tilted 30° south for optimal sun exposure29,32. A peristaltic pump circulates the wastewater through a closed loop around the illuminated area of the photoreactor. The flow system utilizes polytetrafluoroethylene or glass tubing and connectors.
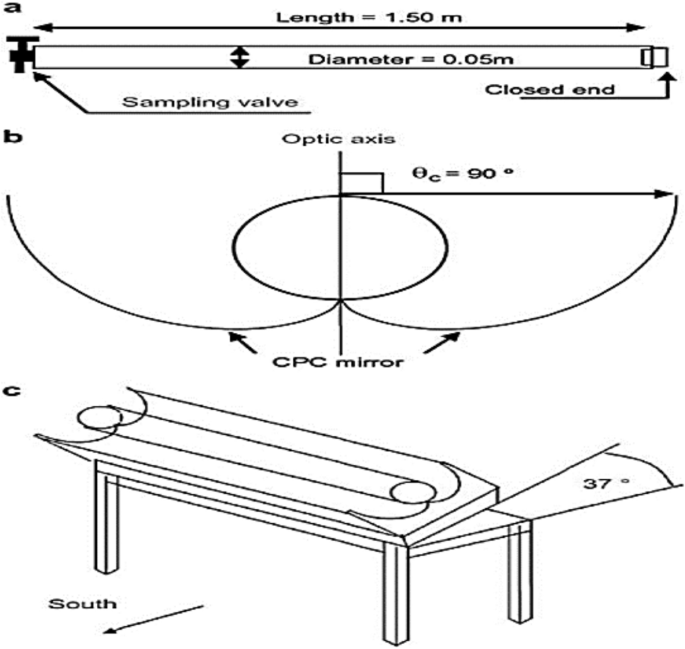
The components of concentrating parabolic collector (CPC): (a) Reactor tube, (b) CPC mirror, and (c) CPC reflector.
Procedures
Pretreatment steps
The real textile wastewater undergoes a multi-stage treatment process for progressive purification. First, sedimentation removes heavy particles, followed by screening to eliminate lighter matter. Activated charcoal filters then remove Odors and some organic pollutants through adsorption. Finally, the pretreated wastewater enters a storage tank where Fe(II) (catalyst) and H2O2 (oxidant) are added for the photo-Fenton process. Samples are collected throughout the treatment to monitor effectiveness (COD, TOC, colour).
Photo-catalytic oxidation step
For further analysis, a separate 7L batch of wastewater underwent photo-Fenton treatment in a laboratory unit. The wastewater's pH was adjusted and maintained using sulfuric acid or sodium hydroxide. The required Fenton reagent was mixed for 10 min in the illuminated section of the reactor. Hydrogen peroxide was continuously injected to sustain the reaction between H2O2 and Fe(II) ions. The initiation of the dosing pump and the start of hydrogen peroxide addition were considered as time zero. The dosage of hydrogen peroxide was calculated based on the stoichiometric ratio in relation to COD30. The solution was circulated at a flow rate of 100 L/h with a total suspension volume of 4 L in the entire system. The volume exposed to light (irradiated volume) was 3.5 L, which corresponds to the amount of solution held within the glass tubes. The experiment mimicked real-world conditions by utilizing natural sunlight between 11 AM and 3 PM during clear summer months (August–September). Solar radiation intensity was measured using a meteorological station located in the Solar Energy Department of the NRC in Egypt. Variations in sunlight intensity were accounted for by conducting and comparing results from multiple test sets. The UV intensity ranged between 3.5 and 4 W/m2, corresponding to roughly 30% of the total solar irradiation power.
Analytical methods
To ensure accurate analysis and halt the ongoing photo-Fenton reaction, samples from each treatment step and the reaction vessel were collected regularly and immediately quenched with NaOH because solar photo-Fenton processes cannot occur at a pH above 1033. This step also neutralized any residual hydrogen peroxide, preventing further reactions with organic matter throughout the analysis process. TOC was measured using a Shimadzu-TOC analyzer 5000, pH with a WTW pH-meter 537, and COD using a Firma Lange LT 148 digester following standard protocols (details provided in the reference). Finally, color removal was determined by measuring absorbance at the dye's specific wavelength (λmax = 530 nm) using a PD-303 UV spectrophotometer and calculating the concentration based on a calibration curve. This approach ensured accurate and well-controlled sample analysis throughout the experiment.
Ethical approval
All authors have read this manuscript and would like to have it considered exclusively for publication in this journal. None of the material related to this manuscript has been published or is under consideration for publication elsewhere, including the internet.
Consent to participate
All authors have read this manuscript and contributed to the study.
Consent to publish
All authors would like to have it considered exclusively for publication in this journal.
Results and discussion
Pretreatment processes
Following a multi-step pretreatment (sedimentation, screening, and adsorption) as described in the experimental section, the studied wastewater achieved colour removal of 50%, COD removal of 25%, and TOC removal of 20% (Table 2). This treatment, while achieving some level of purification, falls short of the required removal efficiencies for safe disposal, necessitating further treatment with AOP. This finding highlights the limitations of standalone pretreatment in meeting stringent wastewater discharge regulations and emphasizes the need for additional, advanced treatment steps.
Advanced oxidation process by solar photo-fenton process
The solar photo-Fenton process was selected as a homogeneous photo-catalytic advanced oxidation process for this study. The objective was to investigate the impact of several influential params on the efficiency of the process. These params include sunlight intensity, pH level, initial concentration of Fe(II), amount of H2O2, flow rate of the dye solution, temperature, and irradiation time. The aim was to determine the ideal operating conditions that would maximize the removal percentages of colour, COD, and TOC.
Effect of solar radiation
Prior to evaluation of solar decolorization and degradation of the wastewater using Dark Fenton process and photo-Fenton process, control experiment was carried out under sunlight in the absence of Fenton reagent. The experiment was conducted at the same operating conditions and same initial concentrations of COD, TOC, and pH. A control experiment under sunlight without Fenton reagent revealed minimal color reduction (less than 15%) and modest COD/TOC reductions (9% and 6%, respectively) after 180 min. This suggests the wastewater's resistance to solar photolysis alone. Interestingly, the presence of Fenton reagent in the dark (Dark Fenton) also led to lower removals of color, COD, and TOC. This might be attributed to the adsorption of pollutants onto the surface of Fe(II) ions in the Fenton process, which aligns with observations from previous research34. These findings emphasize the crucial role of the Fenton reaction in driving the significant pollutant degradation observed in the photo-Fenton process.
Investigating the effect of solar light, two experimental runs were carried out using Fenton reaction one of them is in the dark and the other one in the presence of natural sunlight. Figure 3 elucidates comparison in the effectiveness for removal of colour against irradiation time with using the photo-Fenton process. Figure 4 depicts the effect of solar light in the photo- Fenton method on both COD and TOC removals comparing with that in dark process.

Influence of solar light on % colour removal: [Fe(II) = 0.2 gm/L, H2O2 = 1mL/L, temperature = 40 °C, and flow rate = 100 L/h].

Influence of solar light on % removal of COD and TOC: [Fe(II) = 0.2 gm/L, H2O2 = 1mL/L, temperature = 40 °C, irradiation time = 60 min, and flow rate = 100 L/h].
Balancing cost and efficiency are crucial in the photo-Fenton process. While shorter treatment durations are desirable for economic reasons, insufficient irradiation can leave behind partially degraded pollutants, hindering COD and TOC reduction. Additionally, high residual H2O2 at short treatment times can further decrease efficiency35. Conversely, extending exposure to UV light enables the generation of additional free radicals through various reactions, potentially enhancing degradation36,37. Our findings support this notion. As demonstrated in Fig. 3, complete color removal occurred within 40 min of solar irradiation compared to 98% removal after one h using the dark Fenton reaction. Similarly, Fig. 4 reveals that maximum COD and TOC removals (85% and 82%, respectively) were achieved at one h of solar irradiation, while the dark Fenton reaction attained 69% and 62% removal within the same timeframe.
Effect of pH
The photo-Fenton process relies heavily on pH for optimal hydroxyl radical formation, which are crucial oxidants. The acidic nature of the solution affects the rate of hydroxyl radical formation and the type of iron species present38. Acidic environments promote the generation of these radicals39.
To investigate the impact of pH, experiments were conducted at various pH levels (3–10) with fixed reaction time, H2O2 concentration, Fe(II) dose, temperature, and flow rate. As shown in Fig. 5, increasing pH from 3 to 10 leads to a decline in dye removal, COD removal, and TOC removal. This decrease is attributed to a combination of factors: reduced hydroxyl radical concentration at higher pH36, iron precipitation as Fe(OH)3 above pH 4 (limiting Fe(II) availability and light transmission), and the decomposition of H2O2 into water and oxygen by Fe(OH)340. As well, hydroxyl radical oxidation potential weakens with increasing pH. Notably, dye removal efficiency drops significantly beyond pH 6 (reaching 67.45% at pH 10) due to the formation of ferric hydroxide complexes that hinder H2O2 hydrolysis by ferric iron. Our findings align with previous work by Lucas and Peres41 and Tabarek A. Sajjad36, who also identified pH 3 as optimal for dye removal. Lower pH may decrease activity due to the formation of various iron complexes in solution, affecting light absorption by Fe(II)10,35. Consequently, all experiments in this study were conducted at pH 3.

Influence of pH on % removal of colour, COD and TOC: [Fe(II) = 0.2 gm/L, temperature = 40 °C, irradiation time = 60 min, H2O2 = 1mL/L, and flow rate = 100 L/h].
Effect of initial amount of Fe(II)
The solar photo-Fenton process, often employing sunlight or UV lamps as the photon source, relies on two crucial factors for optimal efficiency: hydrogen peroxide dosage and iron concentration. Hydrogen peroxide acts as an oxidant, vital for complete pollutant degradation. Conversely, iron facilitates the generation of highly reactive hydroxyl radicals (OH•) through the Fenton reaction, a process more efficient under acidic conditions42,43,44.
The solar photo-Fenton process relies on the generation of hydroxyl radicals (OH•) for efficient pollutant degradation. As depicted in Eq. (1), hydrogen peroxide reacts with Fe(II) salts to initiate this process. Further OH• production can occur through the photolysis of various iron species and hydrogen peroxide (Eqs. 2–6)12. Maintaining optimal concentrations of both hydrogen peroxide and Fe(II) is crucial, as excess amounts can scavenge OH• radicals, hindering overall treatment effectiveness.
Determining optimal reagent concentrations is often achieved through multivariate experimental design. This approach systematically varies hydrogen peroxide and iron concentrations while maintaining other params constant, allowing researchers to study their impact on degradation efficiency.
Figure 6 exemplifies this approach, illustrating the influence of varying Fe(II) concentrations on COD and TOC removal, representing degradation and mineralization, respectively. Results showed that an Fe(II) concentration of 0.2 g/L achieved the highest percentage removals of COD (85%), TOC (82%), and colour (100%). Conversely, with no Fe(II) present, the removal efficiencies were significantly lower (22% COD, 18% TOC, and 40% colour) after 60 min using H2O2 under sunlight.

Influence of initial Fe(II) concentration on % removal of colour, COD and TOC: [pH = 3, temperature = 40 °C, irradiation time = 60 min, H2O2 = 1mL/L, and flow rate = 100 L/h].
While higher Fe(II) concentrations generally enhance removal efficiency, an excessive presence can decrease mineralization yield. This decline is potentially attributed to the formation of short-lived intermediate iron(IV) species (Ferryl iron, FeO2+), which may hinder OH• generation crucial for organic matter oxidation (Eqs. 7–9)42.
The observed increase in treatment efficacy with increasing Fe(II) concentration can be explained by the generation of more OH• radicals through additional photo-Fenton reactions. This translates to a faster dye removal rate45. Secondly, higher Fe(II) doses not only ensure a complete redox reaction but also contribute to coagulation due to their presence, acting as both catalysts and coagulants46,47.
Effect of initial hydrogen peroxide concentration
To investigate the impact of hydrogen peroxide (H2O2) dosage on the photocatalytic degradation of wastewater using a solar photo-Fenton process, researchers conducted experiments with varying H2O2 concentrations while maintaining constant pH and initial Fe(II) levels. As shown in Fig. 7, increasing H2O2 from 0 ppm to 1 mL/L significantly enhanced the removal of COD, TOC, and colour due to increased generation of hydroxyl radicals31,48,49.

Influence of H2O2 amount on % removal of colour, COD and TOC: [pH = 3, temperature = 40 °C, irradiation time = 60 min, Fe(II) = 0.2 gm/L, and flow rate = 100 L/h].
Increasing H2O2 dosage to 1.2 mL/L yielded minimal improvement, suggesting diminishing returns for the additional oxidant consumption. Notably, all treatments achieved near-complete colour removal (100%), significant COD reduction (85%), and acceptable TOC reduction (82%) within 60 min of irradiation. Interestingly, exceeding 1.2 mL/L H2O2 led to a slowdown in degradation, likely due to factors like H2O2 auto-decomposition into oxygen and water, OH• radical recombination (Eqs. 10, 11)24 and scavenging by excess H2O2 itself36,50,51. Excess H2O2 reacts with OH• radicals, competing with organic contaminants and reducing treatment effectiveness (Eq. 12)24. So, the optimal H2O2 concentration for this specific wastewater was determined to be 1 mL/L, with the caveat that the optimal dose can vary depending on the wastewater characteristics and iron concentration used.
Effect of temperature
While the room temperature photo-Fenton process is common, investigating the impact of elevated temperatures relevant to the textile industry (60–90 °C) was crucial41,52. This study explored the effect of temperature (25–60 °C) on the removal of dye, COD, and TOC. Figure 8 reveals a significant rise in removal efficiency as the temperature increased from 25 to 40 °C, reaching a maximum of 100% for colour, 85% for COD, and 82% for TOC at 40 °C. This enhancement can be attributed to the accelerated interaction between organic material and hydroxyl radicals at higher temperatures36. Increasing the temperature to 60 °C resulted in a decrease in removal efficiency, likely due to hydrogen peroxide decomposition53, as depicted in Eq. (13). This emphasizes the importance of considering temperature's influence on both degradation and compound stability, even though higher temperatures can enhance reaction rates and generation of OH• radicals54, these findings emphasize the importance of considering temperature's influence on both compound stability and degradation.

Influence of temperature on % removal of colour, COD and TOC: [pH = 3, H2O2 = 1mL/L, irradiation time = 60 min, Fe(II) = 0.2 gm/L, and flow rate = 100 L/h].
Consistent with prior studies36,55,56, this investigation identified 40 °C as the optimal temperature for dye removal using the photo-Fenton process.
Temperature also serves as a significant kinetic factor in boosting the colour and chemical oxygen demand (COD) removal from contaminated water. To assess the impact of temperature variations on the kinetics of COD removal, while maintaining other operational params constant, the treated solution was subjected to different temperatures. The findings depicted in Fig. 9 demonstrate an increase in the rate constant (k) as the reaction temperature rises from 25 to 40 °C.

ln [Ct] vs. irradiation time at different temperatures [pH = 3, H2O2 = 1mL/L, Fe(II) = 0.2 gm/L, and flow rate = 100 L/h].
The relationship between the rate constant and temperature is described by the Arrhenius equation, which is used to model the effect of temperature on reaction rates. This relationship is illustrated in Fig. 10.
where k is the rate constant, A is the frequency factor, Ea is an activation energy, and R is ideal gas constant. Activation energy calculated in plot was equal 10.66 kJ/mole.

Arrhenius plot of COD removal [pH = 3, H2O2 = 1mL/L, Fe(II) = 0.2 gm/L, and flow rate = 100 L/h].
Effect of flow rate
To evaluate the impact of dye solution flow rate on dye removal, COD removal, and TOC removal percentages, the flow rate was varied between 100 and 400 L/h, which represents a pilot-scale process. The effect of flow rate on colour, COD, and TOC removal percentages was studied under the following conditions: pH 3, 40 °C, 60 min of irradiation time, 0.2 gm/L of Fe(II) dose, and 1 mL/L of H2O2 amount, as shown in Fig. 11. The highest colour (100%), COD (85%), and TOC (82%) removal percentages were achieved at a flow rate of 100 L/h. Figure 11 also demonstrated that increasing the flow rate from 100 to 400 L/h resulted in a decrease in colour, COD, and TOC removal percentages. This suggests an inverse proportionality between flow rate and colour removal efficiency. When the polluted solution's flow rate is increased, the UV light is exposed for a shorter period, necessitating a decrease in the amount of H2O2 to produce more hydroxyl radicals (OH•), as these results confirm36,57.

Influence of dye solution flow rate on % removal of colour, COD and TOC: [pH = 3, H2O2 = 1mL/L, irradiation time = 60 min, Fe(II) = 0.2 gm/L, and temperature = 40 °C].
The data on COD concentrations were tested using various kinetic models to determine the best fit. The 1st and 2nd order kinetic models take on linear formulas that are expressed in the equations below:
where Co and Ct are the premier and final chromium concentrations, respectively. K1 and K2 are 1st and 2nd order rate constants in min−1 and L gm−1 min−1, respectively, and t is the treatment time (in min). Plots of ln Ct and [\(\frac{1}{Ct}-\frac{1}{Co}\)] versus time for each run resulted in straight lines, with slopes equal to the rate constants K1 and K2, respectively. Table 3 reveals adequate results for the COD removal kinetics. The results confirm that the COD removal kinetic obeys pseudo-2nd-order kinetics under ideal conditions (pH = 3, H2O2 = 1mL/L, irradiation time = 60 min, Fe(II) = 0.2 gm/L, dye solution flow rate = 100 L/h, and temperature = 40 °C), as the correlation coefficient R2 for the pseudo-2nd-order kinetic model fit the data better than the pseudo-1st-order kinetic model. Figure 12 elucidates the outcomes of the 1st and 2nd-order kinetic models.

Reaction rate of 2500 ppm initial COD at ideal processing factors (a) 1st order kinetic model, (b) 2nd order kinetic model [pH = 3, H2O2 = 1mL/L, irradiation time = 60 min, Fe(II) = 0.2 gm/L, dye solution flow rate = 100 L/h , and temperature = 40 °C].
Economical assessment
The economic evaluation of the project relies on estimating the capital costs associated with each replacement, considering the ongoing running and maintenance costs for different components. The projected profit was determined and evaluated in monetary terms to conduct a cost–benefit analysis.
For the treatment of 30 m3/d of wastewater, the estimated capital costs were $30,000. Additionally, the annual maintenance and operating costs for the complete integrated unit, including the solar photo-Fenton process, were calculated to be $9,000 per y.
Statistic examination
The above results signify that the percentage removal of colour, COD and TOC is non-linearly influenced by various process factors, such as the Fe(II) concentration (mg/L), H2O2 amount (mL/L), solution pH, temperature, and flow rate (L/h). To elucidate the correlation between these process factors and the percentage removal of colour, COD and TOC, a statistical multivariate regression technique using the least squares method was applied. The mathematical models developed from this analysis are exhibited below:
where A, B, C, D, and E are Fe(II) concentration (mg/L), H2O2 amount (mL/L), solution pH, temperature, and wastewater flow rate (L/h), respectively. The regression coefficient R2 of the resulting correlation was 94.7%.
A**** Table 4 displays the analysis of variance (ANOVA) data, while Table 5 contains the coefficient values, p-values, standard errors, and t-test results for each term. A p-value less than 0.05 reveals that the corresponding coefficient in the correlation is statistically significant. Figure 13 compares the experimentally determined colour removal percentages to the values predicted by the model. Figure 14 presents a 3D surface plot showing the expected colour removal percentage in relation to the various process factors. The first 3D surface plot (Fig. 14a) demonstrates the impact of Fe(II) concentration (mg/L) and H2O2 amount (mL/L) on the colour removal efficiency. The second 3D surface plot (Fig. 14b) showcases the influence of solution pH and wastewater flow rate (L/h) on the colour removal efficiency.

Experimentally determined colour removal % with the expected values.

3D surface plot depicting the expected colour removal % in relation to: (a) H2O2 amount and Fe(II) concentration, (b) pH and wastewater flow rate.
The regression analysis resulted in a coefficient of determination (R2) of 90.6%, indicating a strong correlation between the process variables and COD removal percentage. Table 6 presents the analysis of variance (ANOVA) results, and Table 7 lists the coefficient values, p-values, standard errors, and t-test results. A p-value less than 0.05 represents a statistically significant term in the correlation. Figure 15 compares the experimentally determined COD removal percentages to the modeled values. Figure 16 exposes a 3D surface plot depicting the expected COD removal percentage as a function of the process factors. In Fig. 16a, the first 3D surface plot illustrates the relationship between Fe(II) concentration (mg/L) and H2O2 amount (mL/L), and their impact on the COD removal efficiency. Figure 16b, the second 3D surface plot, showcases the influence of solution pH and wastewater flow rate (L/h) on the COD removal efficiency.

Experimentally determined COD removal % with the expected values.

3D surface plot depicting the expected COD removal % in relation to: (a) H2O2 amount and Fe(II) concentration, (b)pH and wastewater flow rate.
The regression analysis yielded a coefficient of determination (R2) of 98.1%, demonstrating a strong correlation between the process variables and the TOC removal percentage. Table 8 displays the analysis of variance (ANOVA) results, and Table 9 provides the coefficient values, p-values, standard errors, and t-test outcomes. A p-value less than 0.05 denotes a statistically significant term in the correlation. Figure 17 compares the experimentally determined TOC removal percentages to the modeled values. Figure 18 exhibits a 3D surface plot illustrating the expected TOC removal percentage as a function of the various process factors. The first 3D surface plot (Fig. 18a) demonstrates the impact of Fe(II) concentration (mg/L) and H2O2 amount (mL/L) on the TOC removal efficiency. The second 3D surface plot (Fig. 18b) showcases the influence of solution pH and wastewater flow rate (L/h) on the TOC removal efficiency.

Experimentally determined TOC removal % with the expected values.

3D surface plot depicting the expected TOC removal % in relation to: (a) H2O2 amount and Fe(II) concentration, (b) pH and wastewater flow rate.
Conclusion
This study presents a pioneering integrated wastewater treatment approach that addresses major gaps in implementing solar photo-Fenton oxidation for textile industry effluents. Unlike previous studies, it combines conventional pretreatment processes (sedimentation, screening, adsorption) with an optimized solar photo-Fenton advanced oxidation stage in a unified system. A key innovation is the use of a novel parabolic collector reactor with increased absorber tube diameter, enabling efficient solar radiation capture at lower catalyst doses—a substantial improvement over conventional designs.
Through comprehensive multivariate experimentation and optimization, remarkable treatment efficiencies were achieved—85% COD removal, 82% TOC removal, and complete decolorization under optimal conditions of pH 3, 0.2 g/L Fe(II), 1 mL/L H2O2, 40 °C, and 100 L/h flow rate after 60 min . Kinetic analysis revealed the pollutant degradation followed 2nd -order reaction kinetics. Moreover, this study derived efficiency prediction models through multivariate regression analysis, correlating process params like Fe(II) dose, H2O2 concentration, pH, temperature, and flow rate to the removal efficiencies. These models provide valuable guidelines for implementing solar photo-Fenton at an industrial scale for textile wastewater treatment.
The novel integrated system design combining conventional and advanced oxidation technologies, optimized photo-Fenton process, innovative reactor configuration, kinetic modelling, and predictive modelling frameworks constitute significant value additions. They provide a comprehensive green methodology for effective treatment and potential reuse of recalcitrant textile wastewaters. In contrast to conventional approaches limited by sludge generation and partial pollutant removal, this study offers an economical solution enabling sustainable industrial wastewater management.
With its multi-pronged treatment strategy, solar-driven process, reduced chemical usage through optimized operation, and valorisation of modelling insights, this work presents a transformative pathway for the textile sector. It paves the way for industrial implementation of solar-assisted advanced oxidation, ensuring regulatory compliance while promoting water conservation—a urgent need for developing economies with significant textile manufacturing. Overall, this study marks a notable advance in realizing the full potential of solar photo-Fenton for environmental remediation.
In summary, the key innovations are the integrated treatment system design, optimization of the solar photo-Fenton process, use of a novel collector reactor configuration, kinetic modelling, and development of prediction models—which provide an effective treatment methodology for textile industry wastewater. This approach offers an effective treatment methodology and valuable prediction models, contributing significantly to the field of industrial wastewater treatment.
Data availability
All the data and materials as well as software application or custom code support our published claims and comply with field standards.
Abbreviations
- COD:
-
Chemical oxygen demand
- BOD:
-
Biological oxygen demand
- TOC:
-
Total organic carbon
- TSS:
-
Total suspended solid
- TKN:
-
Total Kjeldahl nitrogen
- AOP:
-
Advanced oxidation process
- CPC:
-
Concentrating parabolic collector
- UV:
-
Ultraviolet
References
Arslan, I., AkmehmetBalcioglu, I. & Tuhkanen, T. Advanced treatment of dyehouse effluents by Fe(II) and Mn(II)-catalyzed ozonation and the H2O2/O3 process. Water Sci. Technol. 42, 13–18 (2000).
Sevimli, M. F. & Kinaci, C. Decolorization of textile wastewater by ozonation and Fenton’s process. Water Sci. Technol. 45, 279–286 (2002).
InanBeydilli, M. & Pavlostathis, S. G. Decolorization kinetics of the azo dye Reactive Red 2 under methanogenic conditions: effect of long-term culture acclimation. Biodegradation 16, 135–146 (2005).
Moreira, M. T., Mielgo, I., Feijoo, G. & Lema, J. M. Evaluation of different fungal strains in decolorization of synthetic dyes. Biotechnol. Lett. 22, 1499–1503 (2000).
Arslan-Alaton, I. A review of the effects of dye-assisting chemicals on advanced oxidation of reactive dyes in wastewater. Color. Technol. 119, 345–353 (2003).
Yasar, A., Ahmad, N. & Khan, A. A. A. Energy requirement of ultraviolet and AOPs for the post-treatment of treated combined industrial effluent. Color. Technol. 122, 201–206 (2006).
Huang, Y.-H., Huang, Y.-F., Chang, P.-S. & Chen, C.-Y. Comparative study of oxidation of dye-reactive black B by different advanced oxidation processes: Fenton, electro-Fenton and photo-Fenton. J. Hazard. Mater. 154, 655–662 (2008).
Ghaly, M. Y., Härtel, G., Mayer, R. & Haseneder, R. Effect of pH, UV irradiation and hydrogen peroxide on the ozonation process of p-Chlorophenol. Afinidad Rev. química teórica y Apl. 57, 424–430 (2000).
Ghaly, M. Y., Harte, G., Mayer, R. & Haseneder, R. Aromatic compounds degradation in water by using ozone and AOPS.= A comparative study. O-Nitrotoluene as a model substrate. Ozone Sci. Eng. 23, 127–138 (2001).
Ghaly, M. Y., Härtel, G., Mayer, R. & Haseneder, R. Photochemical oxidation of p-chlorophenol by UV/H2O2 and photo-Fenton process. A comparative study. waste Manag. 21, 41–47 (2001).
Malato, S. et al. Photocatalytic decontamination and disinfection of water with solar collectors. Catal. Today 122, 137–149 (2007).
Vilar, V. J. P., Maldonado, M. I., Oller, I., Malato, S. & Boaventura, R. A. R. Solar treatment of cork boiling and bleaching wastewaters in a pilot plant. Water Res. 43, 4050–4062 (2009).
Thakur, A. K. et al. Pharmaceutical waste-water treatment via advanced oxidation based integrated processes: An engineering and economic perspective. J. Water Process Eng. 54, 103977 (2023).
Thakur, A. K., Singh, R., Pullela, R. T. & Pundir, V. Green adsorbents for the removal of heavy metals from Wastewater: A review. Mater. Today Proc. 57, 1468–1472 (2022).
Thakur, A. K., Kumar, R., Chaudhari, P. & Shankar, R. Removal of heavy metals using bentonite clay and inorganic coagulants. Remov. Emerg. Contam. Through Microb. Process. https://doi.org/10.1007/978-981-15-5901-3_3 (2021).
Bello, M. M. & Raman, A. A. A. Synergy of adsorption and advanced oxidation processes in recalcitrant wastewater treatment. Environ. Chem. Lett. 17, 1125–1142 (2019).
Kim, J. R., Huling, S. G. & Kan, E. Effects of temperature on adsorption and oxidative degradation of bisphenol A in an acid-treated iron-amended granular activated carbon. Chem. Eng. J. 262, 1260–1267 (2015).
Bazrafshan, A. A., Ghaedi, M., Hajati, S., Naghiha, R. & Asfaram, A. Synthesis of ZnO-nanorod-based materials for antibacterial, antifungal activities, DNA cleavage and efficient ultrasound-assisted dyes adsorption. Ecotoxicol. Environ. Saf. 142, 330–337 (2017).
Khataee, A. et al. Ultrasound-assisted removal of Acid Red 17 using nanosized Fe3O4-loaded coffee waste hydrochar. Ultrason. Sonochem. 35, 72–80 (2017).
Yasar, A. & Yousaf, S. Solar assisted photo Fenton for cost effective degradation of textile effluents in comparison to AOPs. Glob. Nest J 14, 477–486 (2012).
Da Silva, M. R. A., De Oliveira, M. C. & Nogueira, R. F. P. Estudo da aplicação do processo foto-Fenton solar na degradação de efluentes de indústria de tintas. Eclética Química 29, 19–26 (2004).
Lapertot, M. et al. Enhancing biodegradability of priority substances (pesticides) by solar photo-Fenton. Water Res. 40, 1086–1094 (2006).
Xu, M., Wang, Q. & Hao, Y. Removal of organic carbon from wastepaper pulp effluent by lab-scale solar photo-Fenton process. J. Hazard. Mater. 148, 103–109 (2007).
El-Gawad, H. A., Ebrahiem, E. E., Ghaly, M. Y., Afify, A. A. & Mohamed, R. M. An application of advanced oxidation process on industrial crude oily wastewater treatment. Sci. Rep. 13, 3420 (2023).
Tanveer, M. & Guyer, G. T. Solar assisted photo degradation of wastewater by compound parabolic collectors: Review of design and operational parameters. Renew. Sustain. Energy Rev. 24, 534–543 (2013).
Georgiou, D., Melidis, P., Aivasidis, A. & Gimouhopoulos, K. Degradation of azo-reactive dyes by ultraviolet radiation in the presence of hydrogen peroxide. Dye. Pigment. 52, 69–78 (2002).
Hu, E., Li, Y. & Zou, L. Solar Powered Colour Removal of Dyes Using Ferrioxalate/H2O2 (Australian and New Zealand Solar Energy Society, 2004).
Rice, E. W., Bridgewater, L. & Association, A. P. H. Standard Methods for the Examination of Water and Wastewater Vol. 10 (American public health association Washington, 2012).
Trittin, J. Der Bundsminister für Umwelt, Naturschutz und Reaktorsicherheit. Bekanntung der Neufassung der Abwasserverordung vom 17, (2004).
Fathy, A. M., Farah, J. Y. & Ghaly, M. Y. Effect of catalyst type and dose on solar photocatalytic oxidation for the degradation of zenafix yellow reactive dye aqueous solution. Afinidad Rev. química teórica y Apl. 63, 308–314 (2006).
Badawy, M. I., Gad-Allah, T. A., Ghaly, M. Y. & Lopez, A. Combination of photocatalytic and biological processes as an integrated system for treatment and recovery of industrial wastewater containig pesticides. Afinidad Rev. química teórica y Apl. 63, 478–487 (2006).
Association, A. P. H. Standard Methods for the Examination of Water and Wastewater Vol. 6 (American Public Health Association, 1926).
Badawy, M. I., Ghaly, M. Y. & Gad-Allah, T. A. Advanced oxidation processes for the removal of organophosphorus pesticides from wastewater. Desalination 194, 166–175 (2006).
Babaei, A. A. et al. Comparative treatment of textile wastewater by adsorption, Fenton, UV-Fenton and US-Fenton using magnetic nanoparticles-functionalized carbon (MNPs@ C). J. Ind. Eng. Chem. 56, 163–174 (2017).
Ghaly, M., Härtel, G. & Haseneder, R. Integrated coupled systems as biodegradability enhancement of textile wastewater by photo-Fenton process. Afinidad 66, 420–428 (2009).
Sajjad, T. A. & Al-zobai, K. M. M. Investigation the effect of intensity and direction of light on the removal of reactive blue dye from simulated wastewater using photo-Fenton oxidation under UV irradiation: Batch and continuous methods. in IOP Conference Series: Materials Science and Engineering vol. 928 22132 (IOP Publishing, 2020).
Hassan, A. A. & Al-zobai, K. M. M. Chemical oxidation for oil separation from oilfield produced water under UV irradiation using titanium dioxide as a nano-photocatalyst by batch and continuous techniques. Int. J. Chem. Eng. 2019, 1–8 (2019).
Al-Jaberi, F. Y. & Mohammed, W. T. Effecting of pH parameter on simulated wastewater treatment using electrocoagulation method. J. Eng. 24, 73–88 (2018).
Selvam, K., Muruganandham, M., Sobana, N. & Swaminathan, M. Enhancement of UV-assisted photo-Fenton degradation of reactive orange 4 using TiO2-P25 nanoparticles. Sep. Purif. Technol. 54, 241–247 (2007).
Sreeja, P. H. & Sosamony, K. J. A comparative study of homogeneous and heterogeneous photo-Fenton process for textile wastewater treatment. Procedia Technol. 24, 217–223 (2016).
Lucas, M. S. & Peres, J. A. Decolorization of the azo dye reactive black 5 by Fenton and photo-Fenton oxidation. Dye. Pigment. 71, 236–244 (2006).
Ghaly, M. Destruction of the environmental organic pollutant through activated hydrogen peroxide oxidation. Afinidad Rev. química teórica y Apl. 62, 314–320 (2005).
Ercan, Ö., Deniz, S., Yetimoğlu, E. K. & Aydın, A. Degradation of reactive dyes using advanced oxidation method. CLEAN Soil Air Water 43, 1031–1036 (2015).
Arshad, R. et al. Degradation product distribution of Reactive Red-147 dye treated by UV/H2O2/TiO2 advanced oxidation process. J. Mater. Res. Technol. 9, 3168–3178 (2020).
Kang, S.-F., Liao, C.-H. & Po, S.-T. Decolorization of textile wastewater by photo-Fenton oxidation technology. Chemosphere 41, 1287–1294 (2000).
Abo-Farha, S. A. Comparative study of oxidation of some azo dyes by different advanced oxidation processes: Fenton, Fenton-like, photo-Fenton and photo-Fenton-like. J. Am. Sci. 6, 128–142 (2010).
AlJaberi, F. Y. Studies of autocatalytic electrocoagulation reactor for lead removal from simulated wastewater. J. Environ. Chem. Eng. 6, 6069–6078 (2018).
Chan, K. H. & Chu, W. The dose and ratio effects of Fe(II) and H2O2 in Fenton’s process on the removal of atrazine. Environ. Technol. 24, 703–710 (2003).
Fernandez, J., Bandara, J., Lopez, A., Buffat, P. & Kiwi, J. Photoassisted Fenton degradation of nonbiodegradable azo dye (Orange II) in Fe-free solutions mediated by cation transfer membranes. Langmuir 15, 185–192 (1999).
Peternel, I. T., Koprivanac, N., Božić, A. M. L. & Kušić, H. M. Comparative study of UV/TiO2, UV/ZnO and photo-Fenton processes for the organic reactive dye degradation in aqueous solution. J. Hazard. Mater. 148, 477–484 (2007).
Muruganandham, M. & Swaminathan, M. Photochemical oxidation of reactive azo dye with UV–H2O2 process. Dye. Pigment. 62, 269–275 (2004).
Rodriguez, M., Sarria, V., Esplugas, S. & Pulgarin, C. Photo-Fenton treatment of a biorecalcitrant wastewater generated in textile activities: biodegradability of the photo-treated solution. J. Photochem. Photobiol. A Chem. 151, 129–135 (2002).
Panizza, M. & Cerisola, G. Electro-Fenton degradation of synthetic dyes. Water Res. 43, 339–344 (2009).
Rubio-Clemente, A., Chica, E. & Peñuela, G. A. Petrochemical wastewater treatment by photo-Fenton process. Water Air Soil Pollut. 226, 1–18 (2015).
Alshamsi, H. A. H. & Shdood, A. UV-ClO2 assisted decolorization of methylene blue. J. Chem. Pharm. Res. 7, 36–44 (2015).
Alshamsi, H. A. H. & Al Shdood, H. A. K. Color and cod removal of azure a dye by uv-clo2 photochemical oxidation.
Deepa, N., Meghna, P. & Kandasamy, S. Experimental studies on decolonisation of malachite dye using continuous photocatalytic reactor. Int. Res. J. Environ. Sci 3, 14 (2014).
Acknowledgements
The authors thank the Canal Higher Institute of Engineering and Technology, Chemical Engineering Department, Suez, Egypt for financial support. The authors also thank Higher Institute of Engineering, El-Shorouk Academy, Cairo, Egypt, for financial support.
Funding
Open access funding provided by The Science, Technology & Innovation Funding Authority (STDF) in cooperation with The Egyptian Knowledge Bank (EKB). This research received no external funding.
Author information
Authors and Affiliations
Contributions
Conceptualization: Montaser Y.Ghaly, Y.Reda. and Heba A. El- Gawad. Methodology: M.Abdel kreem. and N. F.El Hussieny. Formal analysis and investigation: Montaser Y.Ghaly, Heba A. El- Gawad. and Y.Reda. Writing original draft preparation: M. Abdel kreem, Heba A. El- Gawad. and N. F.El Hussieny. Writing review and editing: Heba A. El- Gawad. and Y.Reda. All authors read and approved the final manuscript.
Corresponding author
Ethics declarations
Competing interests
The authors declare no competing interests.
Additional information
Publisher's note
Springer Nature remains neutral with regard to jurisdictional claims in published maps and institutional affiliations.
Rights and permissions
Open Access This article is licensed under a Creative Commons Attribution 4.0 International License, which permits use, sharing, adaptation, distribution and reproduction in any medium or format, as long as you give appropriate credit to the original author(s) and the source, provide a link to the Creative Commons licence, and indicate if changes were made. The images or other third party material in this article are included in the article's Creative Commons licence, unless indicated otherwise in a credit line to the material. If material is not included in the article's Creative Commons licence and your intended use is not permitted by statutory regulation or exceeds the permitted use, you will need to obtain permission directly from the copyright holder. To view a copy of this licence, visit http://creativecommons.org/licenses/by/4.0/.
About this article

Cite this article
El-Gawad, H.A., Ghaly, M.Y., El Hussieny, N.F. et al. Novel collector design and optimized photo-fenton model for sustainable industry textile wastewater treatment. Sci Rep 14, 8573 (2024). https://doi.org/10.1038/s41598-024-58610-w
Received:
Accepted:
Published:
DOI: https://doi.org/10.1038/s41598-024-58610-w
Keywords
Comments
By submitting a comment you agree to abide by our Terms and Community Guidelines. If you find something abusive or that does not comply with our terms or guidelines please flag it as inappropriate.
