
Abstract
The crystal structure of the domain of unknown function family 507 protein from Aquifex aeolicus is reported (AaDUF507, UniProt O67633, 183 residues). The structure was determined in two space groups (C2221 and P3221) at 1.9 Å resolution. The phase problem was solved by molecular replacement using an AlphaFold model as the search model. AaDUF507 is a Y-shaped α-helical protein consisting of an anti-parallel 4-helix bundle base and two helical arms that extend 30-Å from the base. The two crystal structures differ by a 25° rigid body rotation of the C-terminal arm. The tertiary structure exhibits pseudo-twofold symmetry. The structural symmetry mirrors internal sequence similarity: residues 11–57 and 102–148 are 30% identical and 53% similar with an E-value of 0.002. In one of the structures, electron density for an unknown ligand, consistent with nicotinamide or similar molecule, may indicate a functional site. Docking calculations suggest potential ligand binding hot spots in the region between the helical arms. Structure-based query of the Protein Data Bank revealed no other protein with a similar tertiary structure, leading us to propose that AaDUF507 represents a new protein fold.
Introduction
The interrelationship among amino acid sequence, three-dimensional structure, and protein function is a fundamental pillar of biology. The sequence-structure–function principle enables the classification of proteins into groups with shared characteristics and the annotation of possible functions. The utility of the sequence-structure–function principle is especially notable in the post-genomic era where the number of known protein sequences far exceeds the capacity of experimental characterization.
Nearly 40% of known proteins lack any annotation within public databases and are usually referred to as hypothetical proteins1. These proteins lack sufficient sequence similarity to proteins of known function to apply sequence-structure–function relationships. Hypothetical proteins may be grouped into families, such as domains of unknown function (DUFs). DUFs are a large set of families within the Pfam database2 (now part of InterPro database3) that do not include any protein of known function4. DUFs constitute an appreciable fraction of the protein family universe. Pfam 26.0 includes 3526 DUF families, corresponding to 26% of all the Pfam-A (curated) families2.
Goodacre et al. conceived the idea of “essential” DUFs as a way to prioritize DUFs for experimental and computational characterization5. By intersecting the Database of Essential Genes with the Pfam DUF database, they generated a list of over 300 essential proteins in 16 model bacterial species containing 238 DUFs, most of which represent single-domain proteins. Here we have studied an essential DUF from the DUF507 family. DUF507 corresponds to Pfam family PF04368, which has been integrated to InterPro family IPR007463. The family comprises approximately 3000 proteins from 231 proteomes. DUF507 proteins have two architectures, having either ~ 90 or ~ 180 residues.
Herein we report two crystal structures of the DUF507 family protein from the hyperthermophilic bacterium Aquifex aeolicus (AaDUF507, UniProt O67633, 183 residues). The structure of AaDUF507 reveals a pseudo-twofold symmetric Y-shaped protein consisting of a 4-helix bundle base and two 30-Å helical arms. In one of the structures, electron density for an unknown ligand may indicate a functional site. AaDUF507 appears to represent a new protein fold.
Results
Secondary and tertiary structure of AaDUF507
Circular dichroism (CD) was used to study the secondary structure of AfDUF507 in solution. The far UV CD spectrum exhibited features near 222 and 208 nm, characteristic of proteins with high α-helical content6 (Fig. 1).

Far-UV circular dichroism spectra of AaDUF507 collected at 24 °C.
The crystal structure of AaDUF507 was determined at 1.9 Å resolution in two different space groups (C2221 and P3221) (Table 1). The phase problem was solved with molecular replacement using a model from AlphaFold7 as the search model. Use of the AlphaFold model was motivated by the lack of detectable sequence similarity of AaDUF507 to any protein in the Protein Data Bank (PDB8,9). The final refined 2Fo − Fc electron density was strong throughout the entire chain, allowing all 183 residues to be modeled in both structures.
AaDUF507 is a Y-shaped predominantly α-helical protein (Fig. 2). The base of the Y consists of an up–down–up–down antiparallel 4-helix bundle formed by α-helices αA and αE, plus the N-terminal halves of αB and αF (Fig. 2A). A short, anti-parallel 2-stranded β-sheet connects the two halves of the bundle. The arms of the Y are connected to the base by the long αB and αF helices, which belong to both the base and the arms. The N-terminal arm consists of the C-terminal half of αB, plus αC and αD. The C-terminal arm consists of the C-terminal half of αF, plus αG.

Fold of AaDUF507. (A) Cartoon representation of AaDUF507 (P3221 structure). The chain is colored in a rainbow scheme with blue at the N-terminus and red at the C-terminus. Secondary structure elements are labeled (letters for α-helices, numbers for β-strands). (B) Superposition of the P3221 (hot pink) and C2221 (white) structures. (C) Surface representations of the P3221 and C2221 structures.
The two crystal structures reveal the same fold and differ mainly in the angle of the C-terminal arm (Fig. 2B). The RMSD between the two structures is 2.4 Å for Cα atoms, calculated after superposition of all Cα atoms in CNS10. Most of this rather large deviation is contributed by the C-terminal arm (residues 141–183). For example, with the superposition based on all Cα atoms, the RMSD for residues 1–140 is only 1.2 Å, while that of residues 141–183 is 4.3 Å. The structural differences in the C-terminal domain may be described as 25° rigid body rotation, as determined with DynDom11. Because of the rigid body rotation, the arms are farther apart in the P3221 structure than in the C2221 structure (Fig. 2C).
The tertiary structure of AaDUF507 exhibits pseudo-twofold symmetry. This aspect of the structure is most apparent for the P3221 structure (Fig. 3). The pseudo-twofold axis runs between the two β-strands of the base of the Y, and the protein may be split into two structurally similar halves corresponding to residues 1–91 and 92–183 (Fig. 3A). Structure alignment calculations with PDBeFold12 show that the N- and C-terminal halves align with a Q-score of 0.47 and RMSD of 1.98 Å over 75 aligned residues (Fig. 3B). The two halves of the fold differ mainly in the connecting segments at the tips of the arms, between αB and αD in the N-terminal half, and between αF and αG in the C-terminal half. These two connectors differ in secondary structure, with αB and αD linked by a helix (αC), and αF and αG connected by a loop. The two halves of the protein are also similar in sequence. Pairwise sequence alignment performed with BLASTP13 using the default options shows that residues 11–57 and 102–148 are 30% identical and 53% similar with an E-value of 0.002 (Fig. 3C). This region of the structure corresponds to αA and αB of the N-terminal half, and αE and αF of the C-terminal half, along with the β-sheet (Fig. 3C).
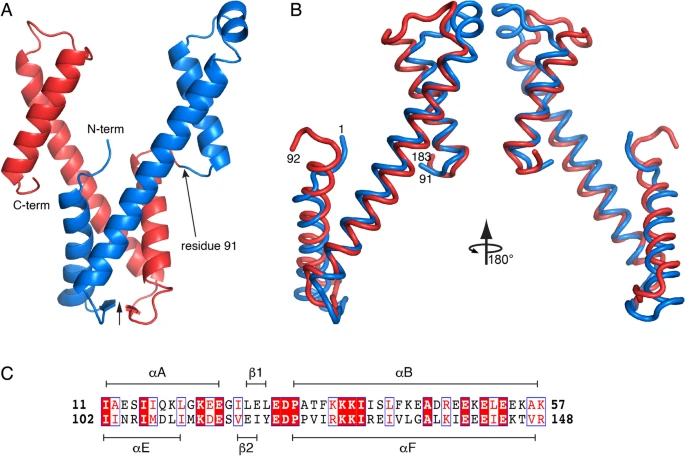
Pseudo-twofold symmetry of AaDUF507, as observed in the P3221 structure. (A) Cartoon representation showing the location of the pseudo-twofold axis (vertical arrow) and the splitting of the protein into structurally similar N-terminal (blue) and C-terminal (red) halves at residue 91. (B) Superposition of the C-terminal half of AaDUF507 (red) onto the N-terminal half (blue). (C) Local sequence alignment of the two halves of AaDUF507 (30% identity, 53% similarity, E-value = 0.002).
Oligomeric structure of AaDUF507
The oligomeric structure of AaDUF507 was studied with small-angle X-ray scattering (SAXS). SAXS data were measured at several protein concentrations between 1 mg/mL and 16 mg/mL. Visual inspection of the scattering curves and Guinier analysis suggested the presence of nonspecific aggregation at protein concentrations above 1 mg/mL. Therefore, only the data set collected at 1 mg/mL was kept for analysis (Fig. 4A). Guinier analysis yields a radius of gyration (Rg) of 23 Å (Fig. 4B, Table 2). Calculations of the distance distribution function suggest an Rg of 24 Å and maximum particle dimension of ~ 90 Å (Fig. 4C). For reference, the Rg of the crystal structure is 20 Å. These results suggest that the protein is not substantially self-associated in solution at 1 mg/mL. Furthermore, the molecular weight estimated from SAXS is 20.0–22.6 kDa, which is within 3–9% of the predicted molecular weight of 21.9 kDa for the monomer (Table 2). These results suggest that AaDUF507 is mainly monomeric at 1 mg/mL.

SAXS analysis of AaDUF507. (A) SAXS curve measured at 1 mg/mL. (B) Guinier plot. (C) Distance distribution function. (D) Comparison of the experimental SAXS curve (symbols) with the curve calculated from the crystal structure model (P3221 structure). The goodness-of-fit parameter from FoXS (χ2) is 0.13.
The SAXS data were further analyzed by calculating theoretical SAXS data from the crystal structure using FoXS14,15. The curves calculated from the two structures show good agreement with the experimental curve, as characterized by FoXS χ2 values of 0.13 and 0.17 for the trigonal and C-orthorhombic structures, respectively (Fig. 4D).
The crystal structures also imply a monomeric protein. Analysis of the protein–protein interfaces in the two crystal structures using PDBePISA16 did not reveal any assemblies predicted to be stable in solution. In summary, considering the SAXS data, which reports on the oligomeric state at low protein concentration, and the crystal structures, which provide information on oligomeric structure at high protein concentration, we conclude that AaDUF507 is predominantly monomeric in solution.
AaDUF507 represents a new protein fold
The structure of AaDUF507 was compared to those in the PDB to uncover potential relationships to functionally characterized proteins and explore the possibility that it represents a new fold. Searching the PDB using TopSearch17, PDBeFold and DALI18 with either crystal structure as the query failed to return a global match. The top hits covered less than 60% of the query structure and displayed diverse functionalities. Some of the hits matched the 4-helix bundle base, while others recognized non-contiguous helices in larger proteins such as integral membrane proteins and dynein heavy chain. More meaningful hits were obtained when the 4-helix bundle was used as the query, as expected for a fold that is highly represented in the PDB19. The best of these hits had 80–90% query coverage and RMSD of 2.4–2.6 Å and displayed diverse functionalities (e.g., phenylalanine ammonia-lyase, PDB 1Y2M; α-domain of Transcription factor TFIIA, PDB 5M4S). These results suggest that AaDUF507 represents a new protein fold containing a 4-helix bundle domain.
Adventitious ligand bound to AaDUF507
The electron density map for the C2221 structure indicated an unknown ligand bound to the protein. The electron density resembled a 6-membered aromatic ring with a small, planar functional group attached (Fig. 5A). This molecular topology does not match any of the components of the protein buffer or crystallization solution. The density could be modeled satisfactorily as nicotinamide, although its true identity is unknown. Nicotinamide seems plausible because of the good fit to the electron density, and as a molecule of NAD metabolism, it presumably is present in the Escherichia coli cell cultures used to express the recombinant protein20. Trial refinement of nicotinamide with occupancy of 1.0 resulted in a mean atomic displacement parameter of 39.2 Å2, which is comparable to the mean B-factor of the protein of 37.3 Å2. Nevertheless, nicotinamide was not included in the final coordinates deposited in the PDB.

Unknown ligand site in the C2221 structure. (A) Location of the ligand site (left) and electron density (Fo − Fc, 3σ) (right). For illustration purposes, the ligand has been modeled as nicotinamide. (B) Surface representation of the binding pocket. The surface is colored according to sequence conservation calculated with ConSurf.
The unknown ligand site is a pocket located in the junction between the 4-helix bundle and the C-terminal arm, near the intersection of αA, αF, and αG (Fig. 5A). The ring of the ligand is buried inside the protein and the functional group protrudes out into the solvent (Fig. 5B). Multiple sequence alignment analysis with ConSurf21 shows that this site is highly conserved (Fig. 5B). The modeled ligand forms no hydrogen bonds with the protein, as judged by a cutoff distance of 3.2 Å, and appears to be stabilized mainly by nonpolar interactions. However, there are a few charged and polar groups near the ligand, which might provide some electrostatic stabilization. For example, Arg6 and a water molecule are within 4.6 Å and 3.3 Å of the amide, and Glu140 is 3.5 Å from the N heteroatom (Fig. 5A). Interestingly, the unknown ligand is not present in the trigonal structure in which the rigid body rotation of the C-terminal arm eliminates the binding pocket.
Identification of potential ligand binding hot spots
Docking of small organic molecules as implemented in FTMap was used to identify potential ligand binding hot spots22. Docking of 16 organic molecules against the P3221 structure produced nine consensus clusters of poses (Fig. 6A). Six of the clusters are close together, forming a supercluster (clusters 1, 4, 5, 7, 8, 9). The supercluster maps out a potential binding site formed by αB and αE, as well as the N-terminus. This hot spot is notable for its deep pocket, which contains the largest consensus cluster (#1 in cyan in Fig. 6A). Two smaller clusters are in shallow depressions on the surface of the C-terminal arm (#3 and #6). Cluster 2 marks a pocket on the side of the 4-helix bundle. The supercluster, as well as clusters 3 and 6, occupy regions of higher-than-average sequence conservation, especially cluster 6 and the deep pocket containing cluster 1 (Fig. 6A, right).

FTMap and ConSurf results. (A) Consensus clusters of the P3221 structure. Clusters are labeled with numbers. Helices are labeled with letters. The protein is colored according to sequence conservation calculated with ConSurf. (B) Consensus clusters of the C2221 structure. Clusters are labeled with numbers. Helices are labeled with letters. The protein is colored according to sequence conservation calculated with ConSurf.
Docking against the C2221 structure generated six consensus clusters located in the groove between the two helical arms (Fig. 6B). Clusters 1, 2, and 4–6 are close together, forming another supercluster. Cluster 1/4 is unique to the C2221 structure; apparently, the 25° rigid body rotation of the C-terminal arm opens this site. Cluster 7 is the smallest and corresponds to the nicotinamide site. FTMap docked one molecule each of acetonitrile and methylamine into the nicotinamide pocket. Clusters 2, 3, and 6 occupy regions of relatively high sequence conservation (Fig. 6B, right).
Accuracy of the AlphaFold model of AaDUF507
We used the crystal structures of AaDUF507 to assess the accuracy of the AlphaFold model. AlphaFold correctly predicted both the secondary and tertiary structure. The backbone Cα RMSD between the AlphaFold model and the P3221 structure is only 1.2 Å (Fig. 7A). This value is impressive considering that the RMSD between the two crystal structures is twice as high at 2.4 Å. The RMSD between the AlphaFold model and the C2221 is considerably higher at 2.8 Å (Fig. 7B). The high deviation is due to a rotation of the C-terminal arm; compared to the C2221 structure, the C-terminal arm domain is rotated by 29° in the AlphaFold model.

Comparison of the AlphaFold model to the crystal structures. (A) Superposition of the AlphaFold model (blue) and the P3221 structure (hot pink). (B) Superposition of the AlphaFold model (blue) and the C2221 structure (white). (C) Sidechain RMSDs mapped onto the AlphaFold model. The width and color of the tube represents the sidechain RMSD between the AlphaFold model and the P3221 structure. (D) Histogram of sidechain RMSDs (AlphaFold versus the P3221 structure). (E) Example of sidechain conformational differences between the AlphaFold model (blue) and the P3221 structure (pink). The mesh represents 2Fo − Fc density (1σ).
The accuracy of the sidechains in the AlphaFold model was also assessed. This analysis was performed with the trigonal structure since it has the lower backbone RMSD to the AlphaFold model. AlphaFold predicted the sidechain conformations to within 1 Å RMSD of the crystal structure for 65% of the residues (Fig. 7D). Most of the sidechains with high RMSD (> 2 Å) are charged residues on the surface of the protein (Fig. 7C), and of these, many are involved in crystal contacts (e.g., Lys50, Arg61, Arg75, Arg126, Lys127, Glu164, and Lys170). An ion pair network on the surface of αB is one area where the AlphaFold model and crystal structure differ significantly (Fig. 7E). In both crystal structures, Arg47 ion pairs to Glu44 and Glu51; however, the former two sidechains have different conformations in the AlphaFold model and these ion pairs were not predicted.
Discussion
Our results provide new information relevant to the classification of the DUF507 family. DUF507 proteins are found in bacteria and have two architectures. AaDUF507 represents the larger architecture, which consists of ~ 180 residues. The shorter architecture proteins have ~ 90 residues and are similar in sequence to the C-terminal half of AaDUF507. Presumably the structure of the shorter DUF507 proteins resembles the C-terminal half of AaDUF507. Thus, we suggest that the 3-helix motif found in the C-terminal half of AaDUF507 is the defining structural feature of the family, and that it is duplicated in the longer architecture DUF507 proteins, such as AaDUF507. The pseudo-twofold structural symmetry of AaDUF507 may have arisen through gene duplication and fusion, which has been proposed to be an origin of internal symmetric structure of monomeric proteins23. The structural symmetry also suggests that the shorter DUF507 proteins may dimerize via an intermolecular 4-helix bundle that mimics the intramolecular 4-helix bundle described here.
The structures may be useful for determining the function of DUF507 proteins. The electron density for one of the structures indicated an unknown small molecule, possibly nicotinamide, bound in a pocket of high sequence conservation. Unknown ligands are common in structures of proteins of unknown function. A survey of structures determined in the Protein Structure Initiative indicates that 5% of structures of proteins of unknown function have unknown ligands bound24. For example, a similar electron density feature was observed in another structure of a helical protein with unknown function25. In the structure of HP0721 from Helicobacter pylori (PDB 2XRH), the unknown ligand was modeled as nicotinic acid based on the strong interaction with an arginine sidechain, implying a carboxylate functional group. The lack of a positively charged sidechain or hydrogen bond donors close to the ligand functional group in our structure made nicotinamide seem more plausible than nicotinic acid. Also, similarly shaped electron density features representing an unknown ligand with the topology of a 6-membered ring with a sp2 functional group have been observed in structures deposited by the JCSG structural genomics project, including PDB entries 3GBH, 3NRB, 4J8P, and 2IG6.
Adventitious, unknown ligands in crystal structures can often aid in functional characterization26. The unknown ligand in AaDUF507 binds in the junction between the 4-helix bundle base and the C-terminal arm. The appearance of this pocket is correlated with the angle of the C-terminal domain. With the C-terminal domain rotated as in the C2221 structure, the arms of the Y are closer together and the pocket opens. Rotation of the C-terminal domain in the opposite direction, as in the P3221 structure, opens the arms of the Y and closes the nicotinamide pocket. The disappearance of the nicotinamide pocket is accompanied by the appearance of a deep pocket near the N-terminal arm of the P3221 structure, which was found by fragment mapping. These results suggest the possibility that the unknown ligand pocket is an allosteric site that tunes a larger functional ligand binding site between the arms.
Finally, AlphaFold correctly predicted both the secondary and tertiary structures of AaDUF507. Further, 65% of the sidechains were correctly predicted to within 1 Å RMSD of the crystal structure. The tertiary structure of the AlphaFold model is more similar to the P3221 structure (RMSD of 1.2 Å) than the C2221 structure (RMSD of 2.8 Å), reflecting a difference in the angle of the C-terminal domain in the two crystal structures. Nevertheless, the AlphaFold model proved to be a suitable molecular replacement search model for the C2221 structure.
Methods
Protein expression and purification
A synthetic gene encoding DUF507 from Aquifex aeolicus (AaDUF507, UniProt O67633, 183 residues) with codons optimized for expression in Escherichia coli was synthesized and ligated into plasmid pET-24b( +) by GenScript. The expressed protein includes an N-terminal His-tag and TEVP cleavage site with the sequence MHHHHHHSSGVDLGTENLYFQ|S.
AaDUF507 was expressed in E. coli as follows. The plasmid was transformed into Invitrogen One-Shot BL21(DE3) competent cells. The transformed cells were then plated onto LB agar plates with 50 µg/mL kanamycin. 15 mL cultures were grown overnight on an orbital shaker at 195 rpm and 37 °C, and then used to inoculate 1 L cultures of TB media. The 1 L cultures were grown at 37 °C and 200 rpm until approximately 0.9 OD600 was obtained. The temperature was then reduced to 18 °C and protein expression was induced with 0.5 mM IPTG and continued overnight. The cells were collected by centrifugation at 4 °C for 30 min using a SLC6000 rotor at 5000 rpm. The resulting pellet was stored at -20 °C until ready for purification.
Expressed AaDUF507 was extracted from E. coli cells as follows. The frozen cells were thawed and resuspended in lysis buffer on ice. The lysis buffer contained 20 mM HEPES, 300 mM NaCl, 5% glycerol, and Pierce™ EDTA-free protease inhibitor tablets, 1 tablet per 50 mL of resuspended cells. The resuspended cells were lysed on ice using sonication. Sonication (Branson Sonifier 450 with duty cycle of 50% and Output control of 7) was applied in 2 min intervals (2 min on, 2 min rest) for a total of 14 min. The mixture was then centrifuged at 16,500 rpm using a SS-34 rotor (4 °C for 1 h) and the supernatant collected for chromatography steps.
AaDUF507 was purified as follows. The crude lysate from cell disruption was applied to a Cytiva 5 mL Histrap™ HP column (charged with Ni2+) at 2.5 mL/min using an Akta Start protein purification system. The column had been pre-equilibrated with buffer A consisting of 20 mM HEPES pH 7.5, 300 mM NaCl, 3% glycerol, and 30 mM imidazole. The resin was washed with 3–4 column volumes of buffer A at 1.5 mL/min. A linear elution gradient from 30 mM imidazole to 300 mM imidazole was applied over 50 column volumes. Fractions were analyzed with SDS-PAGE and pooled. The His-tag was removed by adding TEVP to the AaDUF507 sample and then dialyzing at room temperature overnight against 20 mM HEPES pH 7.5, 300 mM NaCl, 3% glycerol, and 1 mM TCEP. The next day, the sample was passed over the Histrap column and tag-free AaDUF507 was collected in the flow-through. The sample was then concentrated using an Amicon Ultra 15 10 k MWCO centrifugal concentrator to 13 mg/mL in preparation for size exclusion chromatography. Size exclusion chromatography was performed on an Akta Pure instrument with a HiLoad™ 16/600 Superdex™ 200 pg column. The column buffer contained 20 mM HEPES pH 7.5, 150 mM NaCl, and 3% glycerol. Fractions were pooled based on the chromatogram and concentrated to approximately 16 mg/mL. The concentration was estimated using absorbance at 280 nm assuming Abs 0.1% of 0.78 calculated with ProtParam27.
Crystallization
Initial crystallization conditions were identified by screening the protein against several commercial crystal screens, including Hampton Crystal Screen HT and Molecular Dimensions BCS Eco Screen. The screens were performed in Swissci MRC 2 sitting drop plates set up with an Oryx-8 robot. The concentration of the protein stock solution was 16 mg/mL. The crystallization drop size consisted of 0.70 µL of protein and 0.30 µL of reservoir. Two crystal forms suitable for high resolution structure determination were obtained (centered orthorhombic and trigonal). The centered orthorhombic crystals were grown using a reservoir containing 0.01 M Co(II)Cl2 hexahydrate, 0.1 M sodium acetate pH 4.6, and 1.0 M 1,6-hexanediol, which was obtained after optimization of the hit from Crystal Screen HT condition E11. The trigonal crystal used for structure determination was harvested directly out of the crystal screen (Molecular Dimensions BCS Eco Screen kit well D8), which had a reservoir solution of 0.1 M MES monohydrate pH 6.5 and 12% w/v PEG 20,000. The centered orthorhombic crystals were cryoprotected in 35% ethylene glycol. The trigonal crystals were cryoprotected in 25% PEG200.
X-ray diffraction data collection, phasing and refinement
Shutterless X-ray diffraction data were collected at beamline 4.2.2 of the Advanced Light Source using a Taurus-1 CMOS detector. The data were integrated and scaled with XDS28. Intensities were converted to amplitudes with Aimless29. Analysis of the data sets with Phenix30 Xtriage indicated a pathology of “moderate anisotropy” for the centered orthorhombic data and no obvious pathologies for the trigonal data set. Data processing statistics are listed in Table 1.
The phase problem was solved using molecular replacement as implemented in MOLREP31 and Phaser32. The centered orthorhombic structure was solved first. Because AaDUF507 has no detectable sequence similarity to any protein in the PDB, an AlphaFold model obtained from UniProt was used as the search model33. The cross rotation function calculated in MOLREP showed a single prominent peak, consistent with one molecule in the asymmetric unit. Molecular replacement calculations in Phaser produced a solution with one molecule in the asymmetric unit of space group C2221, implying a solvent content of 59% and VM of 3.0 Å3/Da34. Visual inspection of the model and map from Phaser showed no severe intermolecular steric clashes and strong electron density throughout the protein chain except for residues 146–183, which correspond to the C-terminal arm. Attempts to obtain a solution with two molecules in the asymmetric unit were unsuccessful (returned the one-molecule solution).
Automated model building and refinement in Phenix35,36,37 were used to validate the molecular replacement solution and complete the model. The model from molecular replacement was input to simulated annealing refinement in Phenix, which resulted in Rwork of 0.37 and Rfree of 0.43. The map from simulated annealing refinement was then input to automated building in Phenix Autobuild. To reduce model bias, the model from refinement was not used in automated building. The model from the first round of automated building included residues 7–182 assigned to sequence (out of 183 total) with Rwork of 0.25 and Rfree of 0.30. The model from automated building was improved through manual building in Coot38,39 and refinement in Phenix. A few more iterations of automated building followed by manual building and crystallographic refinement were performed until a nearly complete structure was obtained. Then several cycles of manual building followed by refinement in Phenix were performed to complete the structure. The final C2221 structure includes residues 1–183, 91 water molecules, and one molecule of 1,6-hexanediol. Structure validation was performed using MolProbity and the wwPDB validation server40,41. Refinement statistics are listed in Table 1.
The final C2221 structure served as the search model to solve the trigonal structure. The search model was prepared by removing solvent and trimming sidechains to the Cγ atoms. Molecular replacement calculations in Phaser returned a solution having one molecule in the asymmetric unit of space group P3221, implying 60% solvent and VM of 3.1 Å3/Da. The structure was completed using the strategy outlined for the C2221 structure. The final structure includes residues 1–183, 55 water molecules, a sodium ion, and two PEG fragments. Refinement statistics are listed in Table 1. Coordinates and structure factor amplitudes for both structures have been deposited in the PDB under the accession codes 8T8K and 8T8L.
Circular dichroism
The secondary structure of AaDUF507 was studied with CD. The protein sample was exchanged into a buffer containing 10 mM potassium phosphate at pH 7.5 (CD buffer) using an Amicon Ultra 4 10,000 NMWL centrifugal concentrator, adding CD buffer to sample and spinning (repeated 3 times). The sample was then diluted with CD buffer to 0.47 mg/mL. The CD spectrum was recorded on a Chirascan V100 instrument at 24 °C using 1 mm pathlength matching cuvettes.
Small-angle X-ray scattering (SAXS)
In preparation for SAXS, a sample of purified AaDUF507 was dialyzed into 20 mM HEPES pH 7.2 and 400 mM NaCl using a Slide-A-Lyzer mini dialysis 10,000 MWCO unit. The sample was concentrated to 16 mg/mL using an Amicon 4 centrifugal concentrator. Samples were diluted to concentrations of 1–16 mg/mL and pipetted into a 96-well flat bottom plate and shipped at 4 °C to ALS beamline 12.3.1. SAXS buffer and concentrator flow-through were included in the plate bracketing the protein samples for buffer subtraction.
SAXS data collection was performed at 20 °C using a Pilatus detector at beamline 12.3.1 of the Advanced Light Source through the SIBYLS Mail-in HT-SAX program42. Data were collected in shutterless mode with a total exposure of 10 s, framed every 0.3 s. The sample-to-detector distance was 2 m and the wavelength was 1.234 Å. Buffer-subtracted frames were averaged using SAXS FrameSlice43. For the data reported here (1 mg/mL), the following frames were used in averaging: Guinier region, frames 1–2; Porod region, frames 1–15; wide region, frames 1–25. Primus 3.2.1 was used for Guinier analysis and calculations of the distance distribution function44. The molecular weight was estimated using the methods of volume of correlation45, SAXS MoW46, and Bayesian inference47 as implemented in the Primus 3.2.1 Molecular Weight utility. FoXS was used to calculate scattering curves from the crystal structure14,15. The SAXS data, P(r) curve, and best fit model have been deposited in the SASBDB under accession code SASDSX6.
Computational analysis
Domain rotations were analyzed with DynDom11. Structural queries of the PDB were performed with TopSearch17, DALI18, and PDBeFold12. Sequence alignments were performed with NCBI BLASTP13 and Clustal Omega48, and visualized with ESPript 3.049. RMSD calculations were done with CNS10. The sidechain RMSD for each residue was calculated after first superimposing the backbone of the residue, and care was taken to exclude spurious differences that arise for amino acids with groups exhibiting mirror symmetry (i.e., rings of Phe and Tyr; carboxylates of Asp and Glu). The ConSurf server21 was used to calculate multiple sequence alignments and map the results onto the structure.
Data availability
The coordinates and structure factor amplitudes of AaDUF507 are available from the Protein Data Bank under access codes 8T8K and 8T8L. The diffraction images for both structures have been deposited at proteindiffraction.org.50 The SAXS data, P(r) curve, and best fit model have been deposited in the SASBDB under accession code SASDSX6.
Abbreviations
- AaDUF507:
-
DUF507-containing protein from Aquifex aeolicus
- CD:
-
Circular dichroism
- DUF:
-
Domain of unknown function
- SAXS:
-
Small-angle X-ray scattering
References
Jaroszewski, L. et al. Exploration of uncharted regions of the protein universe. PLoS Biol. 7, e1000205. https://doi.org/10.1371/journal.pbio.1000205 (2009).
Punta, M. et al. The Pfam protein families database. Nucleic Acids Res. 40, D290-301. https://doi.org/10.1093/nar/gkr1065 (2012).
Paysan-Lafosse, T. et al. InterPro in 2022. Nucleic Acids Res. 51, D418–D427. https://doi.org/10.1093/nar/gkac993 (2023).
Finn, R. D. et al. The Pfam protein families database. Nucleic Acids Res. 36, D281-288. https://doi.org/10.1093/nar/gkm960 (2008).
Goodacre, N. F., Gerloff, D. L. & Uetz, P. Protein domains of unknown function are essential in bacteria. MBio 5, e00744-e713. https://doi.org/10.1128/mBio.00744-13 (2013).
Kelly, S. M., Jess, T. J. & Price, N. C. How to study proteins by circular dichroism. Biochem. Biophys. Acta. 1751, 119–139. https://doi.org/10.1016/j.bbapap.2005.06.005 (2005).
Jumper, J. et al. Highly accurate protein structure prediction with AlphaFold. Nature 596, 583–589. https://doi.org/10.1038/s41586-021-03819-2 (2021).
Rose, P. W. et al. The RCSB protein data bank: Integrative view of protein, gene and 3D structural information. Nucleic Acids Res. 45, D271–D281. https://doi.org/10.1093/nar/gkw1000 (2017).
Berman, H. M. et al. The protein data bank. Nucleic Acids Res. 28, 235–242 (2000).
Brunger, A. T. Version 1.2 of the Crystallography and NMR system. Nat. Protoc. 2, 2728–2733. https://doi.org/10.1038/nprot.2007.406 (2007).
Girdlestone, C. & Hayward, S. The DynDom3D webserver for the analysis of domain movements in multimeric proteins. J. Comput. Biol. 23, 21–26. https://doi.org/10.1089/cmb.2015.0143 (2016).
Krissinel, E. & Henrick, K. Secondary-structure matching (SSM), a new tool for fast protein structure alignment in three dimensions. Acta Crystallogr. D Biol. Crystallogr. 60, 2256–2268 (2004).
Johnson, M. et al. NCBI BLAST: A better web interface. Nucleic Acids Res 36, W5-9. https://doi.org/10.1093/nar/gkn201 (2008).
Schneidman-Duhovny, D., Hammel, M., Tainer, J. A. & Sali, A. Accurate SAXS profile computation and its assessment by contrast variation experiments. Biophys. J. 105, 962–974. https://doi.org/10.1016/j.bpj.2013.07.020 (2013).
Schneidman-Duhovny, D., Hammel, M. & Sali, A. FoXS: A web server for rapid computation and fitting of SAXS profiles. Nucleic Acids Res. 38, W540-544. https://doi.org/10.1093/nar/gkq461 (2010).
Krissinel, E. & Henrick, K. Inference of macromolecular assemblies from crystalline state. J. Mol. Biol. 372, 774–797. https://doi.org/10.1016/j.jmb.2007.05.022 (2007).
Wiederstein, M., Gruber, M., Frank, K., Melo, F. & Sippl, M. J. Structure-based characterization of multiprotein complexes. Structure 22, 1063–1070. https://doi.org/10.1016/j.str.2014.05.005 (2014).
Holm, L., Laiho, A., Toronen, P. & Salgado, M. DALI shines a light on remote homologs: One hundred discoveries. Protein Sci. 32, e4519. https://doi.org/10.1002/pro.4519 (2023).
Rhys, G. G. et al. Navigating the structural landscape of de novo alpha-helical bundles. J. Am. Chem. Soc. 141, 8787–8797. https://doi.org/10.1021/jacs.8b13354 (2019).
Baquero, F., Del Campo, R. & Martinez, J. L. Interventions in nicotinamide adenine dinucleotide metabolism, the intestinal microbiota and microcin peptide antimicrobials. Front. Mol. Biosci. 9, 861603. https://doi.org/10.3389/fmolb.2022.861603 (2022).
Yariv, B. et al. Using evolutionary data to make sense of macromolecules with a “face-lifted” ConSurf. Protein Sci. 32, e4582. https://doi.org/10.1002/pro.4582 (2023).
Kozakov, D. et al. The FTMap family of web servers for determining and characterizing ligand-binding hot spots of proteins. Nat. Protoc. 10, 733–755. https://doi.org/10.1038/nprot.2015.043 (2015).
Shen, X., Huang, T., Wang, G. & Li, G. How the sequence of a gene specifies structural symmetry in proteins. PLoS ONE 10, e0144473. https://doi.org/10.1371/journal.pone.0144473 (2015).
Kumar, A. et al. Ligands in PSI structures. Acta Crystallogr. Sect. F Struct. Biol. Cryst. Commun. 66, 1309–1316. https://doi.org/10.1107/S1744309110008092 (2010).
Cioci, G., Terradot, L., Dian, C., Mueller-Dieckmann, C. & Leonard, G. Crystal structure of HP0721, a novel secreted protein from Helicobacter pylori. Proteins 79, 1678–1681. https://doi.org/10.1002/prot.22988 (2011).
Speers, A. E. & Cravatt, B. F. Ligands in crystal structures that aid in functional characterization. Acta Crystallogr. Sect. F Struct. Biol. Cryst. Commun. 66, 1306–1308. https://doi.org/10.1107/S1744309110035748 (2010).
Gasteiger, E. et al. Protein Identification and Analysis Tools on ExPASy server (Humana Press, 2005).
Kabsch, W. XDS. Acta Crystallogr. D Biol. Crystallogr. 66, 125–132. https://doi.org/10.1107/S0907444909047337 (2010).
Evans, P. R. & Murshudov, G. N. How good are my data and what is the resolution? Acta Crystallogr. D Biol. Crystallogr. 69, 1204–1214. https://doi.org/10.1107/S0907444913000061 (2013).
Adams, P. D. et al. PHENIX: A comprehensive Python-based system for macromolecular structure solution. Acta Crystallogr. D Biol. Crystallogr. 66, 213–221. https://doi.org/10.1107/S0907444909052925 (2010).
Vagin, A. & Teplyakov, A. MOLREP: An automated program for molecular replacement. J. Appl. Crystallogr. 30, 1022–1025 (1997).
McCoy, A. J. et al. Phaser crystallographic software. J. Appl. Crystallogr. 40, 658–674. https://doi.org/10.1107/S0021889807021206 (2007).
UniProt-Consortium. UniProt: The universal protein knowledgebase in 2021. Nucleic Acids Res. 49, D480–D489. https://doi.org/10.1093/nar/gkaa1100 (2021).
Matthews, B. W. Solvent content of protein crystals. J. Mol. Biol. 33, 491–497 (1968).
Afonine, P. V. et al. Towards automated crystallographic structure refinement with phenix.refine. Acta Crystallogr. D Biol. Crystallogr. 68, 352–367. https://doi.org/10.1107/S0907444912001308 (2012).
Zwart, P. H. et al. Automated structure solution with the PHENIX suite. Methods Mol. Biol. 426, 419–435 (2008).
Terwilliger, T. C. et al. Iterative model building, structure refinement and density modification with the PHENIX AutoBuild wizard. Acta Crystallogr. D Biol. Crystallogr. 64, 61–69. https://doi.org/10.1107/S090744490705024X (2008).
Emsley, P., Lohkamp, B., Scott, W. G. & Cowtan, K. Features and development of Coot. Acta Cryst. D Biol. Crystallogr. 66, 486–501. https://doi.org/10.1107/S0907444910007493 (2010).
Emsley, P. & Cowtan, K. Coot: Model-building tools for molecular graphics. Acta Cryst. D60, 2126–2132 (2004).
Chen, V. B. et al. MolProbity: All-atom structure validation for macromolecular crystallography. Acta Crystallogr. D Biol. Crystallogr. D66, 12–21. https://doi.org/10.1107/S0907444909042073 (2010).
Gore, S. et al. Validation of structures in the protein data bank. Structure 25, 1916–1927. https://doi.org/10.1016/j.str.2017.10.009 (2017).
Dyer, K. N. et al. High-throughput SAXS for the characterization of biomolecules in solution: A practical approach. Methods Mol. Biol. 1091, 245–258. https://doi.org/10.1007/978-1-62703-691-7_18 (2014).
Shin, D. S. & Hura, G. L. SAXS FrameSlice Version 1.4.13, https://bl1231.als.lbl.gov/ran (2022).
Manalastas-Cantos, K. et al. ATSAS 3.0: Expanded functionality and new tools for small-angle scattering data analysis. J Appl Crystallogr. 54, 343–355. https://doi.org/10.1107/S1600576720013412 (2021).
Rambo, R. P. & Tainer, J. A. Accurate assessment of mass, models and resolution by small-angle scattering. Nature 496, 477–481. https://doi.org/10.1038/nature12070 (2013).
Piiadov, V., Ares de Araujo, E., Oliveira Neto, M., Craievich, A. F. & Polikarpov, I. SAXSMoW 2.0: Online calculator of the molecular weight of proteins in dilute solution from experimental SAXS data measured on a relative scale. Protein Sci 28, 454–463. https://doi.org/10.1002/pro.3528 (2019).
Hajizadeh, N. R., Franke, D., Jeffries, C. M. & Svergun, D. I. Consensus Bayesian assessment of protein molecular mass from solution X-ray scattering data. Sci. Rep. 8, 7204. https://doi.org/10.1038/s41598-018-25355-2 (2018).
Sievers, F. et al. Fast, scalable generation of high-quality protein multiple sequence alignments using Clustal Omega. Mol. Syst. Biol. 7, 539. https://doi.org/10.1038/msb.2011.75 (2011).
Robert, X. & Gouet, P. Deciphering key features in protein structures with the new ENDscript server. Nucleic Acids Res. 42, W320-324. https://doi.org/10.1093/nar/gku316 (2014).
Grabowski, M. et al. A public database of macromolecular diffraction experiments. Acta Crystallogr. D Struct. Biol. 72, 1181–1193. https://doi.org/10.1107/S2059798316014716 (2016).
Acknowledgements
The authors thank J. Nix for help with remote X-ray diffraction data collection at beamline 4.2.2. Beamline 4.2.2 of the Advanced Light Source, a DOE Office of Science User Facility under Contract No. DE-AC02-05CH11231, is supported in part by the ALS-ENABLE program funded by the National Institutes of Health, National Institute of General Medical Sciences, grant P30 GM124169-01. We thank Kathryn Burnett and Greg Hura for collecting the SAXS data and performing initial data processing. The SAXS experiments were conducted at the Advanced Light Source (ALS), a national user facility operated by Lawrence Berkeley National Laboratory on behalf of the Department of Energy, Office of Basic Energy Sciences, through the Integrated Diffraction Analysis Technologies (IDAT) program, supported by DOE Office of Biological and Environmental Research. Additional support comes from the National Institute of Health project ALS-ENABLE (P30 GM124169) and a High-End Instrumentation Grant S10OD018483.
Funding
Research reported in this publication was supported by the National Institute of General Medical Sciences of the National Institutes of Health under award number R01GM093123. Some of the data reported here were collected on a Chirascan V100 circular dichroism spectrometer funded by National Institutes of Health Grant 1S10OD026703.
Author information
Authors and Affiliations
Contributions
C.E.M: Investigation, writing-review and editing. J.C.: Conceptualization, project administration, funding acquisition, writing-review. J.J.T.: Conceptualization, methodology, investigation, writing-original draft, writing-review and editing, visualization, validation, supervision, project administration, funding acquisition.
Corresponding author
Ethics declarations
Competing interests
The authors declare no competing interests.
Additional information
Publisher's note
Springer Nature remains neutral with regard to jurisdictional claims in published maps and institutional affiliations.
Rights and permissions
Open Access This article is licensed under a Creative Commons Attribution 4.0 International License, which permits use, sharing, adaptation, distribution and reproduction in any medium or format, as long as you give appropriate credit to the original author(s) and the source, provide a link to the Creative Commons licence, and indicate if changes were made. The images or other third party material in this article are included in the article's Creative Commons licence, unless indicated otherwise in a credit line to the material. If material is not included in the article's Creative Commons licence and your intended use is not permitted by statutory regulation or exceeds the permitted use, you will need to obtain permission directly from the copyright holder. To view a copy of this licence, visit http://creativecommons.org/licenses/by/4.0/.
About this article

Cite this article
McKay, C.E., Cheng, J. & Tanner, J.J. Crystal structure of domain of unknown function 507 (DUF507) reveals a new protein fold. Sci Rep 13, 13496 (2023). https://doi.org/10.1038/s41598-023-40558-y
Received:
Accepted:
Published:
DOI: https://doi.org/10.1038/s41598-023-40558-y
Comments
By submitting a comment you agree to abide by our Terms and Community Guidelines. If you find something abusive or that does not comply with our terms or guidelines please flag it as inappropriate.
