
Abstract
The relation between earthquakes and volcanic eruptions, each of which is manifested by large-scale tectonic plate and mantle motions, has been widely discussed. Mount Fuji, in Japan, last erupted in 1707, paired with a magnitude (M)-9-class earthquake 49 days prior. Motivated by this pairing, previous studies investigated its effect on Mount Fuji after both the 2011 M9 Tohoku megaquake and a triggered M5.9 Shizuoka earthquake 4 days later at the foot of the volcano, but reported no potential to erupt. More than 300 years have already passed since the 1707 eruption, and even though consequences to society caused by the next eruption are already being considered, the implications for future volcanism remain uncertain. This study shows how volcanic low-frequency earthquakes (LFEs) in the deep part of the volcano revealed unrecognized activation after the Shizuoka earthquake. Our analyses also show that despite an increase in the rate of occurrence of LFEs, these did not return to pre-earthquake levels, indicating a change in the magma system. Our results demonstrate that the volcanism of Mount Fuji was reactivated by the Shizuoka earthquake, implying that this volcano is sufficiently sensitive to external events that are considered to be enough to trigger eruptions.
Introduction
When earthquakes accompany volcanic eruptions, there is the possibility of a causal relationship between them1,2. Many researchers studied how volcanic eruptions are triggered by earthquakes3,4,5,6,7,8, motivated by a physical viewpoint in which the stress7 and/or strain8 of an eruption needs to change, with earthquakes causing rapid and sometimes large changes in that stress and/or strain. We draw on a specific case in California, where the 1992 Landers earthquake triggered seismicity at very large distances, including the magmatically active Long Valley caldera region, which also experienced a significant coincident deformation transient5,6. Another case1 complements the search for direct evidence of the pairing of earthquakes and eruptions, having examined the historical record of large earthquakes and explosive eruptions to show that eruptions occurred in the vicinity of a large earthquake more often than is expected by chance7. In contrast, many large earthquakes have no immediate effect on volcanoes.
The March 11, 2011 magnitude (M) 9.0 Tohoku, Japan earthquake and the following large earthquakes that occurred in eastern Japan caused large changes in stress/strain (Fig. 1a). The Japan Meteorological Agency (JMA)9 reported active seismicity in about 20 volcanoes after this earthquake, although no eruptions occurred. Recent studies10,11,12 that examined seismic waveforms revealed the detailed behavior of seismic activation beneath the Zao volcano and quiescence beneath the Azuma and Nasudake volcanoes in northeastern Japan after the Tohoku earthquake. Another study13, which also examined seismic waveforms, showed remotely-triggered and unrecognized seismicity in the Hakone volcano in central Japan at an epicentral distance of 450 km from the Tohoku earthquake.

Mount Fuji and Japanese earthquakes. (a) Map showing Mount Fuji (red triangle) and the source area of the Tohoku earthquake (rectangular area surrounded by broken lines)70. Active volcanoes are indicated by black triangles. Grey dots indicate LFEs in the JMA catalog. (b) Left panel shows LFEs (grey circles) around Mount Fuji (summit is indicated by a triangle). Black circles indicate 87 template LFEs. The source area of the Shizuoka earthquake is indicated by a rectangular area19. Right panel shows a cross-sectional view of the LFEs and the source area. (c) M-time diagram of LFEs (y-axis on the left side). Overlapped is the cumulative number of LFEs as a function of time since 2003 (y-axis on the right side). Vertical line indicates the moments of the Tohoku and Shizuoka earthquakes, which overlap. (d) Same as (c) for a zoom-in plot at times before and after both earthquakes from 2011.1, as a decimal year (Feb. 6, 2011, 12:00:00) to 2011.3, as a decimal year (Apr. 20, 2011, 12:00:00).
Mount Fuji is the Japan’s highest mountain and is also an active volcano. In addition, it has repeatedly erupted, causing lava flows into its vicinity several times. In 1707, the large Hoei eruption during the Hoei era also deposited volcanic ash in Tokyo on the east side of Mount Fuji14,15,16. In the approximately 300 years since that eruption, Mount Fuji has not erupted and volcanic activity has been low, so the risks of eruption-related disasters caused by Mount Fuji have been neglected. However, a swarm of volcanic low-frequency earthquakes (LFEs) from the fall of 2000 to the spring of 200117 changed this situation completely, and the possibility of eruption-related disasters by Mount Fuji has been reassumed while disaster response plans have been developed to counter them18. Therefore, it can be stated that the importance of monitoring the volcanic activity of Mount Fuji is increasing.
Mount Fuji exhibited increased seismicity, culminating in the triggered M5.9 earthquake that occurred in Shizuoka prefecture 4 days after the Tohoku earthquake. This volcano experienced the 1707 M9-class Hoei earthquake 49 days prior to its eruption. This unique experience led to an evaluation of the Tohoku and Shizuoka earthquakes19, revealing that crustal deformation due to these earthquakes induced changes in stress of Mount Fuji’s magma reservoir in the order of 0.001–1 MPa. The values are considered to be sufficient to trigger an eruption, if that magma is ready to erupt20,21. However, no LFEs were reportedly activated, suggesting that Mount Fuji did not have the potential to erupt9,19. It is not easy to characterize LFEs that are ubiquitous and indicative of seismic activities in the deep parts of volcanoes due to their low signal-to-noise ratio22.
This study was motivated by previous studies10,11,12,13, which suggested that the source mechanism of LFEs was quite important to interpret the impact of large earthquakes on the activity of LFEs and deep magmatic processes. We examined if no LFEs beneath Mount Fuji were indeed activated immediately following the Tohoku and Shizuoka earthquakes. A seismic catalog produced in this study revealed that there were LFEs just after the Shizuoka earthquake. Moreover, seismic activation due to this earthquake continued for at least the next eight years, confirmed by using data until 2019. Evidence was shown that the Shizuoka earthquake and crustal deformation19 triggered reactivation of the volcano. Given that Mount Fuji is sensitive to such external influences, it is important to carefully monitor its development, especially when events external to the volcano might cause a disturbance.
Results
In this section, we examine the temporal change in the activity of LFEs beneath Mount Fuji, Japan, and discuss the possibility of an increase in magmatic activities in the lower crust which was triggered by the 2011 Tohoku and Shizuoka earthquakes. We first obtain new catalogs of LFEs, and then apply statistical analyses to examine the temporal changes in LFE activity. Based on the results of these analyses, we conclude that the change in stress caused by the 2011 Shizuoka earthquake enhanced the creation of fractures and resultant change in activity of LFEs around the deep magma reservoir in the lower crust. We also suggest that the activation of LFEs may reflect the sensitivity of Mount Fuji to external disturbances and that the volcano may have the potential to erupt after a 300-year quiescent period.
First, we show the influence of the 2011 Japanese earthquakes on LFEs manifested in the magma system of Mount Fuji. Second, we offer support that this magma system was disturbed due to such events, which played a role on activated LFEs. For inference on volcanic hazards of Mount Fuji, implications for future volcanism based on our observations will be discussed later.
Influence on LFE activity after the 2011 Japanese earthquakes
To resolve the difficulty in detecting LFEs by conventional event‐detection methods, we produced seismicity catalogs using the matched-filter (MF) method, which cross-correlated a template to continuous seismic signals22,23,24,25,26 (details of the “MF method” in “Methods” and Supplementary Figs. S1–S4). In this method, which considers a continuum of seismic signals, an LFE is identified when the timing of a seismic signal and the timing of a template signal overlap. Our resultant catalog includes ~ 16,000 LFEs (Supplementary Fig. S1) whose correlation coefficients (CC) to quantify signal similarity range from 0.1 (poor correlation) to 1 (strong correlation and most likely a template LFE). Histograms of CC-values show a tall peak at CC ~ 0.2 (Supplementary Fig. S1). The minimum threshold for CC (CCth), above which LFEs are used for subsequent analysis, should be above the upper noise limit. A low CCth would result in a large number of false detections while a high CCth would result in a reduced number of available LFEs. We selected CCth = 0.25, at the 2-sigma level of a normal distribution, as is expected for the random correlation between signal and noise27,28,29. Higher values of CCth = 0.3, 0.35, and 0.5 above the 3-sigma level were also considered to examine the dependence of the result on CCth. Mainly the results for CCth = 0.25 are shown in the text.
The number of LFEs in our catalog of CCth = 0.25 is about three times larger than in the JMA catalog, which lists about 2,000 LFEs detected in 2003–2019 by a conventional method that is not based on CC (Figs. 1c and 2a). Our catalogs of CCth = 0.25, 0.3, and 0.35 include LFEs immediately after the Shizuoka earthquake (Fig. 2a and Supplementary Fig. S1) while the JMA catalog does not (Fig. 1d). One may see that there are just a handful of LFEs next to the line that indicates the timing of the Shizuoka earthquake (Fig. 2b). There may be doubts as to whether high-frequency (ordinary) aftershocks were mis-detected as LFEs, since the source area of the Shizuoka earthquake and the occurrence area of LFEs were close to each other (Fig. 1b). If CCth was selected to be below the upper noise limit, there would be a chance that our catalogs inadvertently included many non-volcanic seismic events. However, our choice of CCth (= 0.25, 0.3, 0.35) indicates that events with low-frequency signals truly occurred immediately after the Shizuoka earthquake. Given that the number of LFEs in our CCth = 0.5 catalog is about one-fourth of that in the JMA catalog (Supplementary Fig. S1), there were no LFEs immediately after the Shizuoka earthquake.
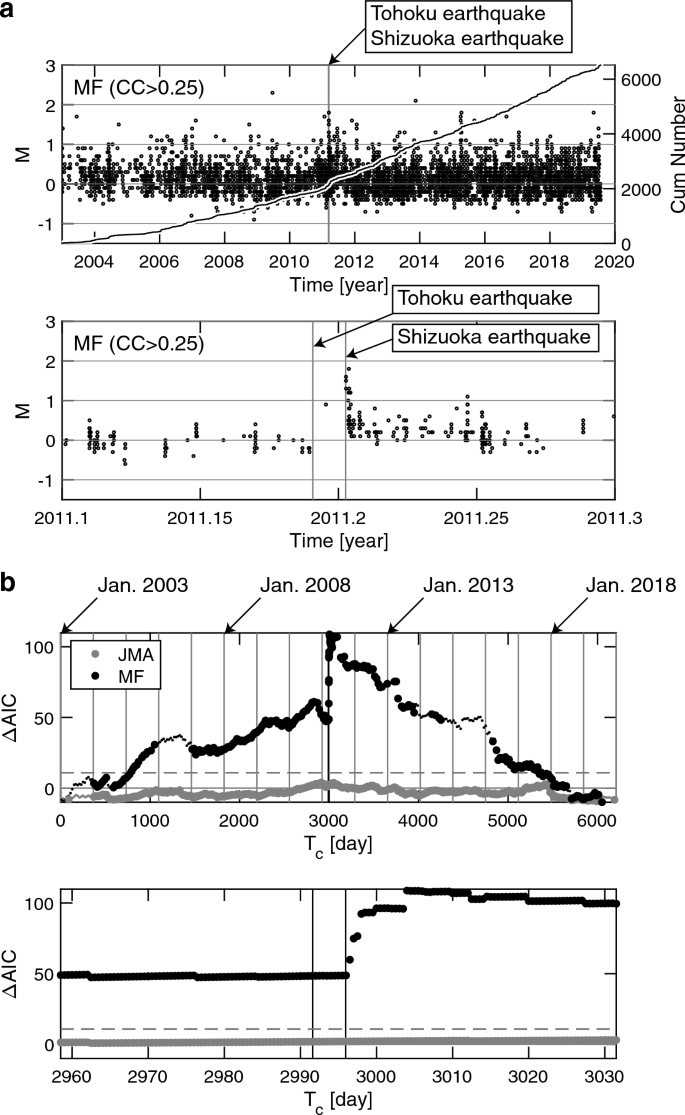
MF method of LFEs. (a) Same as Fig. 1c,d for LFEs in the MF catalog (CC > 0.25). (b) Top panel: ΔAIC = AICsingle − AIC2stage as a function of Tc since 2003, where LFEs (M ≥ 0.3) in the MF catalog (CC > 0.25) (black) and LFEs (M ≥ 0.5) in the JMA catalog (grey) were used. The minimum magnitudes (Mth = 0.3 and 0.5) for the MF and JMA catalogs, respectively, were used, taking homogeneity of seismicity recordings of both catalogs into consideration (details of catalog quality evaluation in “Methods”). Small points show that the model-fitting analysis did not converge when assuming the corresponding Tc. As a reference, thin vertical lines indicate Jan. 1 for 2004–2019. The timings of the Tohoku and Shizuoka earthquakes overlap, showing a single thick vertical line. Horizontal dashed lines representing 2q for the MF and JMA catalogs overlap, where q is the degree of freedom imposed when searching Tc based on the data over the entire period (see “Methods” for details of the ETAS model). Bottom panel: same as the top panel for zoom-in from Feb. 6, 2011, 12:00:00 to Apr. 20, 2011, 12:00:00.
The cumulative number of LFEs as a function of time in Fig. 2a shows that the rates of occurrence changed around the moments of the Tohoku and Shizuoka earthquakes. To support the observation that either earthquake very likely played a role in reactivation, a statistical analysis was conducted. We introduced the epidemic type aftershock sequence (ETAS) model30, assuming that this model, which was originally developed for ordinary earthquakes, was applicable to LFEs (details of the ETAS model in “Methods”). Even though the ETAS model provides a good fit to standard earthquake occurrence, it is known that transient non-standard cases are poorly fitted by the standard ETAS model31,32,33. We focused on differences between the standard ETAS model and an extended two-stage ETAS model, which covers non-standard cases in fitting LFE timeseries, whereas the two-stage ETAS model is the simplest alternative to the standard model32,33. This two-stage model assumes different parameter values in subperiods before and after a particular time (change point, Tc), and the whole period is divided into two adjoining periods to fit the ETAS models separately. This is best applied to cases where there is a clear-cut time instant across which ETAS parameter values change32,33. To test whether or not there are changes in seismicity pattern at Tc in a given period, the problem of model selection is reduced by using AIC (Akaike Information Criterion)34. We compared AICsingle (AIC for a single ETAS fitting) with AIC2stage (AIC for a two-stage ETAS fitting) to select the model with the smaller value, where AIC2stage = AIC1 + AIC2 (AIC1 and AIC2 for fitting to the 1st and 2nd subperiods, respectively).
ΔAIC (= AICsingle − AIC2stage), as a function of Tc during 2003–2019 (Fig. 2b), shows that the two-stage ETAS model was much better than the single ETAS model, indicating that the most significant Tc was around the time of the Tohoku and Shizuoka earthquakes. This feature was observed regardless of the CCth value (Supplementary Fig. S5). There was a pronounced discontinuation in smoothing at the time of the Shizuoka earthquake due to triggered LFEs for CCth = 0.25 (Fig. 2b), 0.3, and 0.35, but this was not the case for CCth = 0.5 due to few LFEs around the time of the Shizuoka earthquake. AIC when the JMA catalog was used (grey data in Fig. 2b) also showed a better (but insignificant) outcome when the two-stage ETAS model, rather than the single ETAS model, was used (Supplementary Fig. S5). Namely, ΔAIC was higher than 0 (ΔAIC > 0) when Tc was around the time of the Shizuoka earthquake, but it was below the horizontal dashed line in Fig. 2b. This line indicates a hurdle to the selection of the two-stage ETAS model, given that Tc was searched from the data during 2003–201932,33.
Visual inspection of Tc immediately before the Shizuoka earthquake confirmed that fitting by the two-stage ETAS model (Fig. 3a,b) was better than that by the single ETAS model (Fig. 3c). An AIC1 of 216.7, when seismicity since 2003 until immediately before the Shizuoka earthquake was fitted, shows that the occurrence rates (black) were significantly larger than the extrapolated rates (red) after the Shizuoka earthquake (Fig. 3a). This significant difference continued until more recent times (until 2019). This continuation (AIC2 = − 4234.6) (Fig. 3b) was confirmed by switching fitting and extrapolating periods. The fitting of the single ETAS model to seismicity during the entire period (AICsingle = − 3969.4) was visually poor (Fig. 3c), with ΔAIC = 48.5 {= − 3969.4–(216.7–4234.6)}.

Change point analysis of LFEs. (a) Cumulative function of M ≥ 0.3 LFEs is plotted against ordinary time (left panel) and transformed time (right panel), showing the ETAS fitting in the target interval from 2003 until immediately before the Shizuoka earthquake and then extrapolated until July 2019. The parabola represents the 95% confidence intervals of the extrapolation. Note that K0 = 4.51 × 10⁻⁵ for M = 2 (details in the ETAS model in “Methods”), although “K0 = 0.00” is shown in the graph. The smaller panel below each larger panel indicates an M-time diagram. (b) As in (a) except that the target is the later time interval after the Shizuoka earthquake. Because K0 = 6.16 × 10⁻⁵ obtained is too small, it is shown as “K0 = 0.00” in the graph. (c) As in (a) except that the target is the entire time interval.
Disturbed magma system plays a role on activated LFEs
A challenge in exploring the reason for the changes in the rate of occurrence of LFEs (Figs. 2 and 3) is that the magma system, which is underground, i.e., beneath Mount Fuji, and directly unobservable, results in highly clustered and heterogeneous occurrence times of LFEs. A solution to this problem is to take a reductionism approach, by decomposing LFEs into primary LFEs and secondary-triggered LFEs. Measuring the occurrence rate of the former LFEs (indicative of Poisson background activity) and the latter LFEs (indicative of aftershock activity), allows the magma system and the interactions (triggering) among LFEs to be inferred. The ETAS model can be applied to offer a solution30,31,32,33. In the ETAS model30, seismic activity is expressed by two terms, one for Poisson background activity and another for aftershock activity, assuming that each earthquake (including the aftershocks of another earthquake) is followed by aftershocks (details of the ETAS model in “Methods”).
As a preliminary analysis, we examined whether decomposing the LFE sequence was really meaningful, i.e., if secondary triggering played a role in the LFE sequence. Using AIC for the two-stage ETAS model (same model as for Fig. 2b and Supplementary Fig. S5) and the two-stage Poisson model (same as the two-stage ETAS model except that the aftershock activity term was ignored), we compared the goodness-of-fits between them applied to the same dataset. For this comparison, the same procedure as for Fig. 2b and Supplementary Fig. S5 was used except that the single ETAS model was replaced by the two-stage Poisson model. The difference in AIC between the ETAS and Poisson models shows that the former model is superior to the latter one (Supplementary Fig. S6), indicating that the aftershock activity term is not negligible. This result allowed us to examine whether or not the changes in occurrence rate were due to enhanced Poisson background and aftershock activities (Fig. 4 and Supplementary Table S1).

Background and aftershock seismicity. (a,b) μ and K0 as a function of CCth, calculated for two time-windows before Jan. 1, 2011 (solid line) and after Dec. 31 2011 (broken line). We considered the minimum magnitudes Mth = 0.2 (blue), 0.3 (red), and 0.4 (green). Other ETAS parameters (c, p, and α) are constants irrespective of different values for time windows, Mth, and CCth: (c, p, α) = (0.0015, 2.80, 0.5). Open circles indicate that the model-fitting analysis did not converge well, resulting in large errors. See “Methods” for details of time-dependent μ and K0 and Supplementary Table S1.
We used μ (a solo parameter of the Poisson background activity term of the ETAS model) and K0 (a parameter representing clustering aftershock productivity and one of the four parameters of the aftershock activity term), while the other three parameters were constants. For details of these parameters, see the ETAS model in “Methods”. In Fig. 4, μ and K0 were significantly larger after than before 2011 (details of time-dependent μ and K0 in “Methods” and Supplementary Table S1). Moreover, μ and K0 increased with decreasing CCth for both periods, before and after 2011. This indicates that small-CC LFEs identified by relaxing the event identification protocol contributed to both the Poisson background activity and the aftershock activity. The μ-pattern was not sensitive to switching from K0 (Fig. 4 and Supplementary Table S1) to other parameters (details of time-dependent μ and K0 in “Methods” and Supplementary Fig. S7 and Tables S2 and S3). Our results show the contribution of enhanced background and aftershock activities to the increase in occurrence rate of LFEs, and support the possibility of changes in the magma system due to the Shizuoka earthquake.
The bottom panel of Fig. 2a shows that the high rate of LFEs after the Shizuoka event decreased as a function of time, implying that LFEs behaved as aftershocks of the Shizuoka event. Therefore, it may be considered that the background rate of LFEs was globally similar to what was observed before 2011. However, this is not true because μ before 2011 was smaller than after 2011 (Fig. 4a) and because the two-stage ETAS model performed better than the single ETAS model, which included the Shizuoka earthquake (Fig. 2b). A clear change in LFE activity during the occurrence of the Shizuoka earthquake indicates the contribution of the changes in both aftershock and background activities.
If there was to be a disturbance in the magma system, it might induce differences in template LFEs between pre- and post-Shizuoka-quake sequences, allowing differences in detected LFEs between them. A simple test (top panel of Fig. 5) was conducted to assess this possibility, revealing that templates in the pre- (post-) Shizuoka-quake sequence were likely applicable for detecting LFEs in the same sequence. Figure 5 (bottom panels), which shows examples from two individual template LFEs, highlights this difference. The feature was not sensitive to CC > 0.25, 0.3, 0.35 and 0.5 (Supplementary Fig. S8). LFEs before/after 2011 were mostly detected by templates in the same time periods.

Temporal changes of LFE pattern. Top panel: same as Fig. 2a except for the separation between LFEs (orange dots) detected by a correlation with waveforms of template LFEs (orange cross) listed in the JMA catalog before the Tohoku earthquake and LFEs (blue dots) by a correlation with waveforms of template LFEs (blue cross) after the Shizuoka earthquake. Bottom left panel: same as the top panel for highlighting LFEs detected by using an exemplified template LFE before the Tohoku and Shizuoka earthquakes (vertical line). Bottom right panel: same as the bottom left panel, but after these earthquakes.
In this test (top panel of Fig. 5), the two time-windows before and after the Shizuoka earthquake were chosen. It is quite usual for detections to be temporally clustered with template LFEs, so there may be curiosity about the time-windows that were selected. However, the statement that LFEs before/after 2011 were mostly detected by templates in the same time periods is insensitive to selection bias of the time-windows (Supplementary Fig. S9).
Discussion
A seismic survery35,36 that elucidated the 3D structures of the P-wave velocity (VP), S-wave velocity (VS) as well as VP/VS beneath Mount Fuji, revealed a low-VP, low-VS and low-VP/VS anomaly at depths of 7–17 km, corresponding with the locations of LFEs. The coincidence of the velocity anomaly and the locations of LFEs suggests that supercritical volatile fluids, such as H2O and CO2, may be abundant in the low-VP/VS area and may play an important role in generating LFEs.
Two possible processes leading to an eruption are currently considered for Mount Fuji19: the promotion of bubbling due to pressurization, and changes in stress in surrounding rocks. The first process promotes exsolving volatile components (H2O and CO2) from liquid to gas37,38,39,40,41. If the magma plumbing system is open or has weak walls that are easily expanded or fractured, increased pressure creates paths for the magma to migrate, so magma pressure will be further reduced and bubbling will be accelerated. In the second process, cracks close to the magma system would be unstable due to stress perturbation. These failures can become paths through which magma flows up, leading to an eruption. Disturbances caused by external fractures, such as the Shizuoka earthquake, may be a key to initiating both processes.
Nakamichi et al.35 suggested that a complex process occurred beneath Mount Fuji in which the characteristics of its LFEs were due to a variety of focal processes, and where the source mechanism of the largest LFE (M2.3) was explained by non-double-couple components. Among variable LFEs, only those associated with newly-created fractures and reactivated fractures pushed closer to failure by stress changes due to the Shizuoka earthquake, may have become active. The reader might note alternative source processes. LFEs might not always be generated by magma movement. Hydrothermal fluids, as well as the attenuation of higher frequency earthquakes, can create apparent LFEs42,43.
Schematic cross-sections beneath Mount Fuji17,44 before and after the Shizuoka earthquake (Fig. 6) show how newly created fractures19 and activated LFEs are associated with changes in the magma system and fluid- and gas-rich area35,36. However, based on our result, it remains unsolved if the Shizuoka earthquake triggered an increase in the supply of magmatic fluid to the magma reservoir. Furthermore, there was no evidence that the amount of rising magma increased because clear near-surface deformation around Mount Fuji was not observed before and after the Shizuoka earthquake.

Schematic cross sections. Relationship between LFEs and the magma system beneath Mount Fuji, before and after the Shizuoka earthquake, is shown in (a) and (b), respectively. (a) is based on previous studies17,35,36,44. New fractures and magma injection due to the earthquake were suggested19, shown in (b). We proposed activated LFEs in (b).
Stress changes on the magma system beneath Mount Fuji of 0.001–0.01 and 0.1–1 MPa were caused by the Tohoku and Shizuoka earthquakes, respectively19. The latter change is considered to be sufficient to trigger earthquakes20,21, implying the excitement of the magma system and triggering an eruption through either or both processes described above19. Our results (Figs. 2, 3, 4, 5) demonstrate that the Shizuoka earthquake played a role in the magma system’s excitation, but not enough to trigger an eruption. We conclude that Mount Fuji was sensitive to disturbances due to this earthquake. This is consistent with a previous study in which it was implied that the crust in the area near Mount Fuji is quite sensitive to transient stress perturbation and that the level of pressurization of the hydrothermal and/or magmatic fluids is high in the Mount Fuji area45.
In 1703, four years before the 1707 Hoei eruption, seismic swarms were observed 35 days after the M8-class Genroku Kanto earthquake, about 100 km east of Mount Fuji, but no eruption occurred14,15,16. The 1707 eruption was also preceded by the M9-class Hoei earthquake, about 200 km to the southwest, on October 7, 49 days before the eruption. Beginning on November 28, 1707, earthquake swarms were observed several times and dozens of earthquakes were felt from December 15, 1707. Mount Fuji then began to erupt on December 16, 1707.
In 2000–2001, LFE swarms occurred, starting in August 2000, two months after the eruption of Miyakejima volcano, which lies 160 km to the south of Mount Fuji, although the change in stress was 10–4 MPa19,46, or 0.001 ~ 0.0001 of that caused by the Shizuoka earthquake. This change in stress is considered to be too small to trigger an eruption. The experience of Mount Fuji described above implies that it tends to be influenced by external disturbances such as large earthquakes and active volcanoes. Our observation of activated LFEs due to the Shizuoka earthquake and a previous theory of an increase in stress imparted by this earthquake19 support this tendency, although the volcano has not yet erupted (June 2023). While this study presents a case for the interaction of the Mount Fuji volcanic system with tectonic earthquakes, it remains possible that considerable volcano-seismic activity took place without any influence by tectonics for some cases.
Over 300 years after the 1707 Hoei eruption, the Japanese government has started to consider preparations for the next eruption, citing a worst-case scenario that inflicts catastrophic damage on humans and society18. Whether the increase in occurrence rate of LFEs (Fig. 2) will continue or subside absent external events remains unknown, and it is impossible to draw conclusions about the timing of the next eruption. However, our detailed study demonstrates that LFE activity is an important indicator of Mount Fuji’s subsurface magma system17,35,36,44. Given that this study covered data up to 2019, additional analyses for more recent LFEs in future research may be useful for identifying the current state of Mount Fuji. Thus, together with seismological and geodetic observations, it is worthwhile monitoring LFEs to contribute to the prevention and mitigation of Mount Fuji’s volcanic hazard. Our arguments for the use of monitoring LFEs are applicable to active volcanoes around the world that have not yet erupted but are considered to have the potential to erupt.
Methods
MF method
When studying LFEs associated with volcanic phenomena, researchers may want to use a catalog that consists of a complete list of LFEs. However, due to their low signal-to-noise ratio, LFE signals are difficult to detect by conventional event-detection methods. We used an MF method that correlates waveforms of continuous signals with those of a template and allows the detection of seismic sequences with a low signal-to-noise ratio22,23,24,25,26. In this study, the MF system used for detecting LFEs beneath the Hakone volcano, Japan22 was modified so that it was applicable to Mount Fuji.
Waveforms of continuous signals that were used in this study covered the Jan. 2003-Jul. 2019 period, as recorded by 16 seismic stations (Supplementary Fig. S1) with a three-component velocity seismometer around Mount Fuji. These were obtained from the Earthquake Research Institute at the University of Tokyo.
All stations used in this study (Supplementary Fig. S1) host borehole seismometers (eigen frequency of 1 Hz), except for the stations OMZ (35.434332°N, 139.012649°E, 503 m above sea level), FJO (35.3666°N, 138.9102°E, 490 m above sea level), EV.FJZ (35.4487°N, 138.7525°E, 1090 m above sea level), and EV.SBSR (35.36582°N, 138.77818°E, 1980 m above sea level), installed on the surface of the ground. OMZ, FJO, and EV.FJZ host Lennartz seismometers (1 Hz) and EV.SBSR hosts a Nanometrics Trillium seismometer (1/120 Hz).
To prepare template LFEs, we used the JMA catalog, which includes ordinary earthquakes and LFEs observed in Japan. Although ordinary earthquakes are distributed all over Japan, LFEs tend to concentrate beneath active volcanoes (Fig. 1a), along the boundary between the Philippine Sea plate and the continental plate in western Japan47, and as several isolated clusters in the intraplate regions48. Each event in the JMA catalog is classified based on subsidiary information: natural (ordinary) earthquake, LFE, artificial event, etc. The spatial map of events classified as LFEs shows that the area of LFEs around Mount Fuji was separated from other areas of LFEs (Fig. 1a). We only selected LFEs around Mount Fuji and defined the catalog including these LFEs (Fig. 1b–d). The source area of the Shizuoka earthquake and the occurrence area of LFEs are close to each other (Fig. 1b). However, due to subsidiary information, there is no doubt that the LFE catalog we used eliminated aftershocks (ordinary earthquakes) of the Shizuoka earthquake.
This study relied on statistical analyses of the LFE catalog, which required the use of a complete LFE catalog that covered the study region and time period. It should be carefully considered that the catalog may be controlled by the selection of template earthquakes in the MF analysis. To ensure the completeness of the catalog, it is critical to use a well-chosen set of template LFEs. Careful consideration was needed to make a set of template LFEs, as explained below.
First, large LFEs were selected as templates in order to allow template waveforms to include more information on signals than on noise. Using the JMA catalog, we investigated an M-time graph of LFEs around Mount Fuji during the Jan. 2003–Jul. 2019 period (Fig. 1c), and found that the majority was M = 0 ~ 1, regardless of the date. Visual inspection shows that LFEs of M > 1 were rare with no particular tendency such as LFEs of M > 1 which occurred more frequently or less frequently over time. If smaller magnitude criteria were selected to increase the number of template LFEs, then more LFEs would be detected. However, since implementation of the MF system was computationally more intensive when using a large number of template LFEs than when using a small number of template LFEs, so an implementation trial was conducted by using different magnitude criteria under our computing environment. We found that the most feasible was to use M ≥ 0.9 LFEs as templates. Thus, irrespective of time, LFEs with M ≥ 0.9 in Jan. 2003-Jul. 2019 were selected as templates. Then, among them, LFEs that were recorded by six stations with a minimum signal-to-noise-ratio of 2, were selected22.
Second, we verified whether a chosen-set of LFEs (M ≥ 0.9) showed appropriate spatiotemporal coverage. This becomes particularly important when the source mechanism changes over time. Map and cross-sectional views around Mount Fuji (Fig. 1b) show that selected LFEs (M ≥ 0.9) were mostly distributed within the cluster of LFEs, with all magnitudes between Jan. 2003 and Jul. 2019. A consistent spatial coverage of LFEs (M ≥ 0.9) was found between the pre- and post-Shizuoka-quake periods: the coverage of LFEs (M ≥ 0.9) before the Shizuoka earthquake was observed in the area where LFEs (M ≥ 0.9) had already occurred thus far (Supplementary Fig. S1).
It appears that there were more template LFEs from the post-Shizuoka-quake period than from the pre-Shizuoka-quake period (Fig. 5 and Supplementary Fig. S8), which could potentially result in an overrepresentation of detected earthquakes in the post-Shizuoka-quake period relative to the pre-Shizuoka-quake period. However, as described above, this bias was not intentionally included. Thus, we did not distort to select template LFEs for making a template LFE catalog, which would be used for a subsequent MF procedure.
The MF procedure to identify LFEs, briefly described in this paragraph, is the same as that of Yukutake et al.22. Three-component waveform records for each template LFE were used, applying a six-second time window beginning two seconds before the onset time of the theoretical S-wave arrivals. Both templates and continuous waveforms were bandpass-filtered for 1–6 Hz and decimated at 20 Hz to reduce the calculation cost. This band was selected because Yukutake et al.22 was followed, although other studies used a slightly narrower band (e.g., 1–4 Hz49). The CC between a template and continuous waveform at each sampling time for every component at each station was calculated. After subtracting the hypocenter-to-station travel time of the theoretical S-wave, the time sequences of the correlation function throughout all channels were stacked (Supplementary Figs. S2 and S3). When the peak of the stacked correlation function exceeded a threshold level of nine times the median absolute deviation, an event was identified as a candidate LFE. It would be beneficial to show examples of detected LFE waveforms (Supplementary Figs. S2 and S3) in order to verify the earthquake detection process that could enhance the reliability of this study. After removing multiple counts, the location of the candidate was assigned to the hypocenter of the matched template LFE determined by JMA (also see the “Catalog quality evaluation” section in “Methods”). Magnitude was determined as the mean of the maximum amplitude ratios of the template with respect to the candidate. The MF procedure described above was applied to all waveform records in the Jan. 2003–Jul. 2019 period, and a preliminary catalog, including candidate LFEs, was created, but LFEs identified by five or less stations were not included in this catalog22.
Less reliable LFEs were removed from this preliminary catalog to create a finalized catalog, as follows. Among candidate LFEs, false detection occasionally occurred due to contamination by other seismic signals such as teleseismic earthquakes. This contamination led to the detection of LFEs with a large M, so we visually inspected whether each template LFE was used to detect many candidate LFEs with M > 2, a magnitude above which few LFEs have been recorded beneath Mount Fuji in the JMA catalog since 2003. We considered that such template LFEs had a feature similar to teleseismic earthquakes and decided to eliminate them from the list of template LFEs. Thus, candidate LFEs detected by using the eliminated template LFEs were removed from the preliminary catalog, resulting in the finalized catalog that included ~ 16,000 LFEs. A total of 87 template LFEs were used for the finalized catalog. The locations of template LFEs and seismic stations are indicated in Fig. 1b and Supplementary Fig. S1. Despite this primary quality test, an additional test was conducted, as described in the next paragraphs and in the “Catalog quality evaluation” section.
The CC-values of LFEs (Supplementary Fig. S1) ranged between 0.1 (poor correlation with a template LFE) and 1 (strong correlation with, and identical to, the corresponding template LFE). Setting the minimum CC to a low value implies the use of an incomplete catalog influenced by the nature of low signal-to-noise ratios of LFEs. The minimum threshold for CC (CCth), above which LFEs are used for our analysis, should be above the upper noise limit. We decided to use CCth = 0.25, 0.3, 0.35, and 0.5 for the following reasons. Histograms of CC-values in Supplementary Fig. S1 show an asymmetric distribution with a tall peak at CC ~ 0.2. We followed previous studies27,28,29, in which the distribution of lower CC-values was modeled by a normally distributed curve that would be expected for random correlations between signals and noise, while the upper tail was considered to represent the presence of well-correlated LFEs. Visual inspection shows that frequencies at and below CC ~ 0.2 are in good agreement with the left-hand side of the normally distributed curve where the mean is 0.19 and its standard deviation is 0.03 (Supplementary Fig. S1). We selected CCth = 0.25, which corresponds to the mean plus two standard deviations. Moreover, we selected CCth = 0.3 and 0.35, which are higher than the mean plus three standard deviations, to examine the dependence of the result on CCth. Similar to Green and Neuberg27 and Petersen28, we found an outliner peak at CC ~ 0.3 (Supplementary Fig. S1). This peak was clearly observed in the histogram of CC-values for M ≥ 0 (Supplementary Fig. S1). This histogram is displayed because our analysis basically did not include LFEs with M < 0. Previous researchers, who studied Shishaldin volcanoes (Alaska), the Soufriere volcano (West Indies), and the Unzen volcano (Japan)27,28,29, selected CCth-values > 0.5, by showing normally distributed curves with larger means and standard deviations than those shown in this study. We also examined the case for CCth = 0.5.
The scope of this study did not permit us to reveal repeating LFEs, nor cyclic activities and cluster characteristic, as were studied by Lamb et al.29. Rather, this study’s objective was to resolve the difficulty in detecting smaller LFEs. Our future research will be to conduct in-depth analyses of repeating LFEs for each cluster beneath Mount Fuji, referring to Lamb et al.29, and using a sophisticated MF method that can locate detected LFEs to appreciate if they occurred in the same cluster as the template LFE used to find them.
Catalog quality evaluation
As a basis of catalog completeness, understanding magnitude scales used in this study is critical. We examined whether large LFEs in our catalog were indeed large, as in the JMA catalog, and vice versa. An LFE in our catalog was paired with that in the JMA catalog if the time difference between them was within two seconds, while ignoring one-to-multiple cases. In this pairing, differences in the locations of LFEs were not considered because, as described in the “MF method” section in “Methods”, the locations of LFEs in our catalog were assigned to the hypocenter of the matched template LFE determined by JMA. A list of paired LFEs shows that magnitude in our catalog was positively correlated with that in the JMA catalog, and that the former was nearly equal to the latter (Supplementary Fig. S4), allowing us to assume a one-to-one transformation in magnitude between our catalog and the JMA catalog.
Analyses of the ETAS model (see the “ETAS model” section in “Methods”) are critically dependent on a robust estimate of completeness magnitude (Mc) of the processed LFE data. Above Mc, all events are considered to be detected. In particular, underestimates of Mc lead to unreliable ETAS fitting. Attention always needs to be paid to Mc when assessing Mc in each time window. Details of how to compute Mc are provided in the “Computation of Mc” section in “Methods”.
Mc was about 0.3 ~ 0.5 for the JMA catalog and about 0.2 ~ 0.3 for the MF catalogs (Supplementary Fig. S4). These estimates of Mc were based on precut catalogs covering several time periods (Supplementary Fig. S4). Therefore, we did not consider a single Mc over the entire catalog. To verify whether the results depended on the choice of minimum magnitude (Mth), above which the ETAS model was fitted, we assumed Mth = 0.2, 0.3, and 0.4 (M ≥ 0.2, 0.3 and 0.4), suggesting that the feature generally appears to remain stable (see the “ETAS model” section in “Methods”, Figs. 2, 3 and 4, and Supplementary Figs. S5–S7 and Tables S2 and S3). Visual inspection of Fig. 2 shows that the catalog for M = 0 or less is affected by incompleteness. However, it was not necessary to account for such small LFEs because Mth = 0.2, 0.3, and 0.4 were assumed for the ETAS analyses. For the JMA catalog, Mth = 0.3, 0.4, and 0.5 were used (Fig. 2 and Supplementary Fig. S5).
Computation of M c
To compute Mc, we used the Gutenberg-Richter (GR) relation50, given by log10N = a-bM, where N is the cumulative number of earthquakes with a magnitude larger than or equal to M, a characterizes seismic activity or earthquake productivity of a region, and constant b is used to describe the relative occurrence of large and small events (i.e., a high b-value indicates a larger proportion of small earthquakes, and vice versa). Changes in b-values of ordinary earthquakes are known to reflect structural heterogeneity, strength, and temperature in the Earth51,52,53,54,55, and the b-value is also known to be inversely dependent on differential stress56,57. We assumed that the GR relation was applicable to not only ordinary earthquakes55,58,59 but also LFEs. In this section, the word “earthquake” includes LFEs.
We employed the Entire-Magnitude-Range (EMR) technique60, which simultaneously calculates the a- and b-values and the completeness magnitude Mc, above which all events are considered to be detected. We always paid attention to a robust estimate of Mc, because it is critical for analyses of the ETAS models (details of catalog quality evaluation in “Methods”). EMR applies the maximum-likelihood method when computing the b-value to events with magnitudes above Mc. Uncertainty in b was according to Shi and Bolt61. Substitution of Mc, N at Mc, and the maximum-likelihood b-value into M, N, and b of a = log10N + bM, respectively, gives the a-value. Supplementary Fig. S4 shows a good fit of the GR relation to observations in the present cases.
To compute Mc, the EMR technique60 combines the GR relation with a detection rate function. Details are provided next. Statistical modeling was performed separately for completely detected and incompletely detected parts of the frequency-magnitude distribution. The b- and a-values in the GR relation were computed based on earthquakes above a certain magnitude (Mcc). For earthquakes whose magnitudes were smaller than Mcc, it was hypothesized that the detection rate depended on their magnitudes in such a way that large earthquakes were almost entirely detected while smaller ones were detected at lower rates. Earthquakes with M ≥ Mcc were assumed to be detected with a detection rate of 1. To evaluate the fitness of the model to data, the log-likelihood was computed by changing the value of Mcc. The best fitting model was that which maximized the log-likelihood value.
The software package ZMAP62 was used to facilitate the computation of a, b, and Mc based on the EMR method. Although the package, whose code is open, is written in Mathworks’ commercial software language Matlab®, no knowledge is needed since ZMAP is GUI-driven. ZMAP combines many standard seismological tools. A user can use ZMAP to create a graph of frequency-magnitude distribution with the GR relation with a, b, and Mc values calculated by EMR (Supplementary Fig. S4).
ETAS model
The ETAS model30 was originally introduced for ordinary earthquakes, but we assumed that the model can be extended and applied for LFEs beneath Mount Fuji. In this section, when the word “earthquake” is used, the reader should understand that it also includes LFEs.
The ETAS model is a point-process model that represents the activity of earthquakes of a minimum magnitude (Mth) and above in a certain region during a specified time interval. Seismic activity includes the background activity at a constant occurrence rate μ (Poisson process). The model assumes that each earthquake (including the aftershock of another earthquake) is followed by aftershocks. Aftershock activity is represented by the Omori-Utsu formula63 in the time domain. The rate of an aftershock occurrence at time t following the i-th earthquake (time ti and magnitude Mi) is given by νi(t) = K0exp{α(Mi-Mth)}(t-ti + c)-p for t > ti, where K0, α, c, and p are constants, which are common to each target aftershock sequence in a region. The rate of occurrence of the whole earthquake series at t becomes \(\lambda \left(t|{H}_{t}\right)=\mu +{\sum }_{S<{t}_{i}<t}{\nu }_{i}\left(t\right)\). The summation is performed for all i satisfying ti < t. Here, Ht represents the history of occurrence times with associated magnitudes from the data {(ti, Mi)} before time t. The parameter set θ = (μ, K0, α, c, p) represents the characteristics of seismic activity. The units of the parameters are day−1, day−1, no unit, day, and no unit, respectively. For the case of K0 = 0, the ETAS model reduces to the Poisson model (Supplementary Fig. S6). We estimated these parameters using the maximum likelihood method. Because K0 depends on M in this model, it is necessary to assume a magnitude at which a value for K0 needs to be known. Throughout this study, M = 2 was assumed for estimating K0.
Using the maximum likelihood estimate, it is possible to visualize how well or poorly the model fits an earthquake sequence by comparing the cumulative number of earthquakes with the rate calculated by the model. If the model presents a good approximation of observed seismicity, an overlap with each other is expected. Ordinary time can be converted to transformed time in such a way that the transformed sequence follows the Poisson process (uniformly distributed occurrence times) with unit intensity (occurrence rate) so that visualization can be achieved in two ways31,32,33: one graph using ordinary time and the other using transformed time (Fig. 3). Included in the latter graph is the parabola of 95% significance. When the number of earthquakes is insufficiently large, significance actually depends on sample size due to the estimation accuracy of the parameters. The significance of deviation is defined in the case where the empirical curve deviates outside the parabola.
A FORTRAN program package (SASeis2006) associated with a manual for the ETAS analysis was used to calculate maximum likelihood estimates and also to visualize model performance64. This has been extended to the program package XETAS31 using GUI.
When the stationary ETAS model does not fit a dataset well, the simplest alternative model is a “two-stage ETAS model” that considers different parameter values in subperiods before and after a particular time, referred to as change-point Tc. AIC is used to test whether or not the changes in seismicity pattern at Tc reduces model selection34. In this procedure, we separately fitted the ETAS models for each divided period and then compared their total goodness-of-fit values against the one-fit value over the whole period using the principle of minimum AIC. AIC was calculated from the maximum log-likelihood and number of adjusted parameters.
If Tc is hypothetically prefixed based on some information other than the occurrence data themselves, such as a notable geophysical event or a notable outside large earthquake, AICsingle (AIC for the model fitted over the whole period) can be compared with AIC2stage (AIC for the 2-stage model fitted on divided periods) to select the model with the smaller value that performs a better fit to the data in the entire target period. If Tc is searched from the target data, the 2-stage model becomes harder to accept. Namely, AIC2stage is compared with AICsingle plus the penalty term 2q to select the model. Here q is the degree of freedom to search for the best candidate Tc from the data. q depends on sample size (number of earthquakes in the target period)33,65: q increases with sample size and, for example, lies in the 4–5 range for q between 100 and 1000.
Although we adopted AIC for model selection, it cannot always be used for other cases such as the identification of possible earthquake precursors in ionospheric electric content (TEC)66.
Time-dependent μ and K 0
The standard stationary ETAS model can be temporally extended to the non-stationary ETAS model33,67,68,69 in such a way that μ and K0 are assigned as a function of t. The function μ(t) and K0(t) are represented by a broken line connecting the respective sequences (ti, μ(ti)) and (ti, K0(ti)) for the i-th earthquake, using a Bayesian function.
Although such a sophisticated model is available, a simpler approach was taken to capture essential aspects of the time-dependent background and aftershock activities (Fig. 4 and Supplementary Fig. S7 and Tables S1–S3). This involves taking a time-window approach. In Fig. 4, the time-windows 2003–2010 and 2012–2019 were considered where the time-window of 2011, which included the Tohoku and Shizuoka earthquakes, was not considered. When creating Fig. 4 (Supplementary Table S1), μ and K0 were computed, given that other parameters (α, c, p) were constants, where the values for (α, c, p) were obtained as follows. The parameters θ = (μ, K0, α, c, p) were first computed for each time-window, each Mth, and each CCth. Typical values for α, c, p were α = 0.5, c = 0.0015, and p = 2.8. Using these typical values, parameters μ and K0 were recomputed for each time-window, each Mth, and each CCth. The error bars for μ and K0, which can be calculated by XETAS31, are based on error distribution depending on the sample size when the number of LFEs is not large enough65.
K0 was forced to express time-dependent aftershock activity (Fig. 4), so the same analysis can be performed for other parameters to support the assumption that the μ-CCth pattern generally remains stable. Namely, p was considered as a time-variable parameter, given that other aftershock parameters (K0, α, c) were prefixed as constant, resulting in Supplementary Fig. S7. The same analysis was performed by assuming time-variable α, given that K0, c, p were constant (Supplementary Fig. S7). The parameter values are summarized in Supplementary Tables S1–S3.
The slope (g) and intersection (h) of the least-square regression line and the square of the sample correlation coefficient (R2) for Fig. 4a are μ = gCCth + h with (g, h, R2) = (− 0.46, 0.25, 0.96) for M ≥ 0.2 (blue solid line), (− 0.34, 0.19, 0.96) for M ≥ 0.3 (red solid line), and (− 0.24, 0.14, 0.95) for M ≥ 0.4 (green solid line) before 2011, and (− 0.54, 0.34, 0.99) for M ≥ 0.2 (blue dashed line), (− 0.37, 0.25, 1.00) for M ≥ 0.3 (red dashed line), and (− 0.24, 0.17, 1.00) for M ≥ 0.4 (green dashed line) after 2011.
Similarly, for Fig. 4b, K0 = gCCth + h with (g, h, R2) = (− 3.84 × 10⁻⁵, 2.58 × 10⁻⁵, 0.91) for M ≥ 0.2 (blue solid line), (− 3.16 × 10⁻⁵, 2.19 × 10⁻⁵, 0.90) for M ≥ 0.3 (red solid line), and (− 2.59 × 10⁻⁵, 1.85 × 10⁻⁵, 0.87) for M ≥ 0.4 (green solid line) before 2011, and (− 3.93 × 10⁻⁵, 3.13 × 10⁻⁵, 0.97) for M ≥ 0.2 (blue dashed line), (− 3.53 × 10⁻⁵, 2.85 × 10⁻⁵, 0.97) for M ≥ 0.3 (red dashed line), and (− 3.03 × 10⁻⁵, 2.57 × 10⁻⁵, 0.97) for M ≥ 0.4 (green dashed line) after 2011.
Data availability
The datasets used and/or analyzed during the current study are available from the corresponding author on reasonable request. The JMA catalog was obtained from https://www.data.jma.go.jp/eqev/data/bulletin/hypo.html. The waveform records were obtained from the permanent stations of the National Research Institute for Earth Science and Disaster Resilience, the Earthquake Research Institute at the University of Tokyo, JMA, and the Hot Springs Research Institute of Kanagawa Prefectural Government. Locations of active volcanoes used for Fig. 1a were obtained from https://www.mri-jma.go.jp/Dep/sei/fhirose/plate/en.PlateData.html. The fault model of the 2011 Tohoku earthquake, used to create Fig. 1a, was obtained from Asano et al.70. The fault model of the 2011 Shizuoka earthquake, used to create Fig. 1b and Supplementary Fig. S1, was obtained from Fujita et al.19. The seismicity analysis software ZMAP62, used for Supplementary Fig. S4, was obtained from http://www.seismo.ethz.ch/en/research-and-teaching/products-software/software/ZMAP. The program XETAS31, used for Figs. 2–4 and Supplementary Figs. S5–S7 and Tables S2 and S3, was obtained from http://evrrss.eri.u-tokyo.ac.jp/software/xetas/index.html. Generic Mapping Tools (GMT)71, used for Fig. 1a,b and Supplementary Fig. S1, is an open-source collection (https://www.generic-mapping-tools.org).
References
Linde, A. T. & Sacks, I. S. Triggering of volcanic eruptions. Nature 395, 888–890. https://doi.org/10.1038/27650 (1998).
Michell, J. Conjectures concerning the cause, and observations upon the phenomena of earthquakes; particularly of that great earthquake of Nov. 1, 1755, which proved so fatal to the city of Lisbon, and whose effects were felt as far as Africa, and more or less throughout almost all of Europe. Phil. Trans. R. Soc. Lond. 51, 566–634 (1760).
Yokoyama, I. Volcanic eruptions triggered by tectonic earthquakes. Geophys. Bull. Hokkaido Univ. 25, 129–139 (1971). https://doi.org/10.14943/gbhu.25.129 (in Japanese with English abstract).
Nakamura, K. Volcano structure and possible mechanical correlation between volcanic eruptions and earthquakes. Bull. Volcanol. Soc. Jpn. 20, 229–240. https://doi.org/10.18940/kazanc.20.TOKUBE_229 (1975) (in Japanese with English abstract).
Linde, A. T., Sacks, I. S., Johnston, M. J. S., Hill, D. P. & Bilham, R. G. Increased pressure from rising bubbles as a mechanism for remotely triggered seismicity. Nature 371, 408–410. https://doi.org/10.1038/371408a0 (1994).
Hill, D. P. et al. Seismicity remotely triggered by the magnitude 7.3 Landers, California, earthquake. Science 260, 1617–1623. https://doi.org/10.1126/science.260.5114.1617 (1993).
Manga, M. & Brodsky, E. Seismic triggering of eruptions in the far field: Volcanoes and geysers. Ann. Rev. Earth Planet. Sci. 34, 263–291. https://doi.org/10.1146/annurev.earth.34.031405.125125 (2006).
Nishimura, T. Volcanic eruptions are triggered in static dilatational strain fields generated by large earthquakes. Sci. Rep. 11, 17235. https://doi.org/10.1038/s41598-021-96756-z (2021).
Japan Meteorological Agency. List of Activated Volcanoes After 2011 Tohoku Earthquake (2011). https://www.data.jma.go.jp/svd/vois/data/tokyo/STOCK/kaisetsu/CCPVE/shiryo/128/20110311earthquake.pdf (in Japanese).
Niu, X., Zhao, D. & Li, J. Precise relocation of low-frequency earthquakes in Northeast Japan: New insight into arc magma and fluids. Geophys. J. Int. 212(2), 1183–1200. https://doi.org/10.1093/gji/ggx445 (2018).
Oikawa, G., Aso, N. & Nakajima, J. Focal mechanisms of deep low-frequency earthquakes beneath Zao volcano, northeast Japan, and relationship to the 2011 Tohoku earthquake. Geophys. Res. Lett. 46(13), 7361–7370. https://doi.org/10.1029/2019GL082577 (2019).
Ikegaya, T. & Yamamoto, M. Spatio-temporal characteristics and focal mechanisms of deep low-frequency earthquakes beneath the Zao volcano, northeastern Japan. J. Volcanol. Geotherm. Res. 417, 107321. https://doi.org/10.1016/j.jvolgeores.2021.107321 (2021).
Yukutake, Y. et al. Remotely-triggered seismicity in the Hakone volcano following the 2011 off the Pacific coast of Tohoku Earthquake. Earth Planets Space 63, 41. https://doi.org/10.5047/eps.2011.05.004 (2011).
Koyama, M. Mechanical coupling between volcanic unrests and large earthquakes: A review of examples and mechanics. J. Geogr. 111(2), 222–232. https://doi.org/10.5026/jgeography.111.2_222(inJapanesewithEnglishabstract) (2002).
Koyama, M. Database of Eruptions and Other Activities of Fuji Volcano, Japan, Based on Historical Records Since AD 781 119–136 (Yamanashi Institute of Environmental Sciences, 2007). https://www.mfri.pref.yamanashi.jp/yies/fujikazan/original/P119-136.pdf (in Japanese with English abstract).
Schmincke, H.-U. Volcanism (Springer-Verlag GmbH, 2004).
Ukawa, M. Deep low frequency earthquake swarm in the mid crust beneath Mount Fuji (Japan) in 2000 and 2001. Bull. Volcanol. 68, 47–56. https://doi.org/10.1007/s00445-005-0419-5 (2005).
Mount Fuji Hazard Map Review Committee. Report by Mount Fuji Hazard Map Review Committee. Disaster Management, Cabinet Office (2004). https://www.bousai.go.jp/kazan/fuji_map/pdf/report_200406.pdf (in Japanese).
Fujita, E. et al. Stress field change around the Mount Fuji volcano magma system caused by the Tohoku megathrust earthquake, Japan. Bull. Volcanol. 75, 679. https://doi.org/10.1007/s00445-012-0679-9 (2013).
Walter, T. R. et al. Volcanic activity influenced by tectonic earthquake: Static and dynamic stress triggering at Mt. Merapi. Geophys. Res. Lett. 34, L05304. https://doi.org/10.1029/2006GL028710 (2007).
Walter, T. R. et al. Simultaneous magma and gas eruptions at three volcanoes in southern Italy: An earthquake trigger?. Geology 37, 251–254. https://doi.org/10.1130/G25396A (2009).
Yukutake, Y., Abe, Y. & Doke, R. Deep low-frequency earthquakes beneath the Hakone volcano, central Japan, and their relation to volcanic activity. Geophys. Res. Lett. 46(20), 11035–11043. https://doi.org/10.1029/2019GL084357 (2019).
Peng, Z. & Zhao, P. Migration of early aftershocks following the 2004 Parkfield earthquake. Nat. Geosci. 2, 877–881. https://doi.org/10.1038/ngeo697 (2009).
Shelly, D. R., Beroza, G. C. & Ide, S. Non-volcanic tremor and low-frequency earthquake swarms. Nature 446, 305–307. https://doi.org/10.1038/nature05666 (2007).
Kato, A. et al. Propagation of slow slip leading up to the 2011 Mw 9.0 Tohoku-Oki earthquake. Science 335, 705–708. https://doi.org/10.1126/science.1215141 (2012).
Ross, Z. E. et al. Hierarchical interlocked orthogonal faulting in the 2019 Ridgecrest earthquake sequence. Science 366(6463), 346–351. https://doi.org/10.1126/science.aaz0109 (2019).
Green, D. N. & Neuberg, J. Waveform classification of volcanic low-frequency earthquake swarms and its implication at Soufriére Hills Volcano, Montserrat. J. Volcanol. Geotherm. Res. 153, 51–63. https://doi.org/10.1016/j.jvolgeores.2005.08.003 (2006).
Petersen, T. Swarms of repeating long-period earthquakes at Shishaldin Volcano, Alaska, 2001–2004. J. Volcanol. Geotherm. Res. 166, 177–192. https://doi.org/10.1016/j.jvolgeores.2007.07.014 (2007).
Lamb, O. D. et al. Repetitive fracturing during spine extrusion at Unzen volcano, Japan. Solid Earth 6, 1277–1293. https://doi.org/10.5194/se-6-1277-2015 (2015).
Ogata, Y. Statistical models for earthquake occurrences and residual analysis for point processes. J. Am. Stat. Assoc. 83, 9–27. https://doi.org/10.2307/2288914 (1988).
Ogata, Y. & Tsuruoka, H. Statistical monitoring of aftershock sequences: A case study of the 2015 Mw7.8 Gorkha Nepal earthquake. Earth Planets Space 68, 44. https://doi.org/10.1186/s40623-016-0410-8 (2016).
Kumazawa, T., Ogata, Y. & Toda, S. Precursory seismic anomalies and transient crustal deformation prior to the 2008 Mw = 6.9 Iwate-Miyagi Nairiku, Japan, earthquake. J. Geophys. Res. 115, B10312. https://doi.org/10.1029/2010JB007567 (2010).
Kumazawa, T., Ogata, Y. & Tsuruoka, H. Characteristics of seismic activity before and after the 2018 M6.7 Hokkaido Eastern Iburi earthquake. Earth Planets Space 71, 130. https://doi.org/10.1186/s40623-019-1102-y (2019).
Akaike, H. A new look at the statistical model identification. IEEE Trans. AC 19(6), 716–723. https://doi.org/10.1109/TAC.1974.1100705 (1974).
Nakamichi, H., Ukawa, M. & Sakai, S. Precise hypocenter locations of midcrustal low-frequency earthquakes beneath Mt. Fuji, Japan. Earth Planet Space 56, e37–e40. https://doi.org/10.1186/BF03352542 (2004).
Nakamichi, H., Watanabe, H. & Ohminato, T. Three-dimensional velocity structures of Mount Fuji and the South Fossa Magna, central Japan. J. Geophys. Res. 112, B03310. https://doi.org/10.1029/2005JB004161 (2007).
Papale, P. & Polacci, M. Role of carbon dioxide in the dynamics of magma ascent in explosive eruptions. Bull. Volcanol. 60, 583–594. https://doi.org/10.1007/s004450050253 (1999).
Hill, D. P. & Prejean, S. Magmatic unrest beneath Mammoth Mountain, California. J. Volcanol. Geotherm. Res. 146, 257–283. https://doi.org/10.1016/j.jvolgeores.2005.03.002 (2005).
Liu, Y., Zhang, Y. & Behrens, H. Solubility of H2O in rhyolitic melts at low pressure and a new empirical model for mixed H2O–CO2 solubility in rhyolitic melts. J. Volcanol. Geotherm. Res. 143, 219–235. https://doi.org/10.1016/j.jvolgeores.2004.09.019 (2005).
Wallece, P. J. Volatiles in subduction zone magmas: Concentrations and fluxes based on melt inclusion and volcanic gas data. J. Volcanol. Geotherm. Res. 140, 217–240. https://doi.org/10.1016/j.jvolgeores.2004.07.023 (2005).
Walter, T. R. & Amelung, F. Volcanic eruptions following M>=9 megathrust earthquakes: Implications for the Sumatra-Andaman volcanoes. Geology 35, 539–542. https://doi.org/10.1130/G23429A.1 (2007).
Chouet, B. A. Long-period volcano seismicity: Its source and use in eruption forecasting. Nature 380, 309–316. https://doi.org/10.1038/380309a0 (1996).
Bean, C. J. et al. Long-period seismicity in the shallow volcanic edifice formed from slow-rupture earthquakes. Nat. Geosci. 7, 71–75. https://doi.org/10.1038/ngeo2027 (2014).
Ukawa, M. Low frequency earthquakes at Mount Fuji. Fuji Volcano (Eds. Aramaki, S. et al.) 161–172 (2007). https://www.mfri.pref.yamanashi.jp/fujikazan/web/P161-172.pdf (in Japanese with English abstract).
Brenguier, F. et al. Mapping pressurized volcanic fluids from induced crustal seismic velocity drops. Science 345, 80–82. https://doi.org/10.1126/science.1254073 (2014).
Nishimura, T. et al. Crustal deformation caused by magma migration in the northern Izu Islands, Japan. Geophys. Res. Lett. 28, 3745–3748. https://doi.org/10.1029/2001GL013051 (2001).
Obara, K. Nonvolcanic deep tremor associated with subduction in southwest Japan. Science 296(5573), 1679–1681. https://doi.org/10.1126/science.1070378 (2002).
Aso, N., Ohta, K. & Ide, S. Tectonic, volcanic, and semi-volcanic deep low-frequency earthquakes in western Japan. Tectonophysics 600, 27–40. https://doi.org/10.1016/j.tecto.2012.12.015 (2013).
Kurihara, R. & Obara, K. Spatiotemporal characteristics of relocated deep low-frequency earthquakes beneath 52 volcanic regions in Japan over an analysis period of 14 years and 9 months. J. Geophys. Res. Solid Earth 126(10), e2021JB022173. https://doi.org/10.1029/2021JB022173 (2021).
Gutenberg, B. & Richter, C. F. Frequency of earthquakes in California. Bull. Seismol. Soc. Am. 34(4), 185–188. https://doi.org/10.1785/BSSA0340040185 (1944).
Schorlemmer, D., Wiemer, S. & Wyss, M. Variations in earthquake-size distribution across different stress regimes. Nature 437(7058), 539–542. https://doi.org/10.1038/nature04094 (2005).
Mogi, K. The fracture of a semi-infinite body caused by an inner stress origin and its relation to the earthquake phenomena (Second Paper): The case of the materials having some heterogeneous structures. Bull. Earthq. Res. Inst. Univ. Tokyo 41(3), 595–614 (1963).
Smith, W. D. The b-value as an earthquake precursor. Nature 289(5794), 136–139. https://doi.org/10.1038/289136a0 (1981).
Wiemer, S. & Wyss, M. Mapping spatial variability of the frequency-magnitude distribution of earthquakes. Adv. Geophys. 45, 259–302. https://doi.org/10.1016/S0065-2687(02)80007-3 (2002).
Tormann, T., Enescu, B., Woessner, J. & Wiemer, S. Randomness of megathrust earthquakes implied by rapid stress recovery after the Japan earthquake. Nat. Geosci. 8(2), 152–158. https://doi.org/10.1038/ngeo2343 (2015).
Scholz, C. H. The frequency-magnitude relation of microfracturing in rock and its relation to earthquakes. Bull. Seismol. Soc. Am. 58(1), 399–415. https://doi.org/10.1785/BSSA0580010399 (1968).
Scholz, C. H. On the stress dependence of the earthquake b value. Geophys. Res. Lett. 42, 1399–1402. https://doi.org/10.1002/2014GL062863 (2015).
Nanjo, K. Z. & Yoshida, A. A b map implying the first eastern rupture of the Nankai Trough earthquakes. Nat. Commun. 9(1), 1117. https://doi.org/10.1038/s41467-018-03514-3 (2018).
Nanjo, K. Z. Were changes in stress state responsible for the 2019 Ridgecrest, California, earthquakes?. Nat. Commun. 11, 3082. https://doi.org/10.1038/s41467-020-16867-5 (2020).
Woessner, J. & Wiemer, S. Assessing the quality of earthquake catalogues: Estimating the magnitude of completeness and its uncertainty. Bull. Seismol. Soc. Am. 95, 684–698. https://doi.org/10.1785/0120040007 (2005).
Shi, Y. & Bolt, B. A. The standard error of the magnitude-frequency b value. Bull. Seismol. Soc. Am. 72(5), 1677–1687. https://doi.org/10.1785/BSSA0720051677 (1982).
Wiemer, S. A software package to analyze seismicity: ZMAP. Seismol. Res. Lett. 72(3), 373–382. https://doi.org/10.1785/gssrl.72.3.373 (2001).
Utsu, T. A statistical study on the occurrence of aftershocks. Geophys. Mag. 30, 521–605 (1961).
Ogata, Y. Statistical Analysis of Seismicity—updated version (SASeis2006), ISM Computer Science Monographs, No. 33 (The Institute of Statistical Mathematics, 2006). https://www.ism.ac.jp/~ogata/Ssg/ssg_softwaresE.html (manual and codes).
Ogata, Y. Detection of precursory relative quiescence before great earthquakes through a statistical model. J. Geophys. Res. 97, 19845–19871. https://doi.org/10.1029/92JB00708 (1992).
Tozzi, R., Masci, F. & Pezzopane, M. A stress test to evaluate the usefulness of Akaike information criterion in short-term earthquake prediction. Sci. Rep. 10, 21153. https://doi.org/10.1038/s41598-020-77834-0 (2020).
Kumazawa, T. & Ogata, Y. Quantitative description of induced seismic activity before and after the 2011 Tohoku-Oki Earthquake by non-stationary ETAS models. J. Geophys. Res. 118, 6165–6182. https://doi.org/10.1002/2013JB010259 (2013).
Kumazawa, T., Ogata, Y., Kimura, K., Maeda, K. & Kobayashi, A. Background rates of swarm earthquakes that are synchronized with volumetric strain changes. Earth Planet. Sci. Lett. 442, 51–60. https://doi.org/10.1016/j.epsl.2016.02.049 (2017).
Kumazawa, T., Ogata, Y. & Tsuruoka, H. Measuring seismicity diversity and anomalies by point process models: Case studies before and after the 2016 Kumamoto Earthquakes in Kyushu, Japan. Earth Planets Space 69, 169. https://doi.org/10.1186/s40623-017-0756-6 (2017).
Asano, Y. et al. Spatial distribution and focal mechanisms of aftershocks of the 2011 off the Pacific coast of Tohoku Earthquake. Earth Planets Space 63, 29. https://doi.org/10.5047/eps.2011.06.016 (2011).
Wessel, P., Smith, W. H. F., Scharroo, R., Luis, J. F. & Wobbe, F. Generic Mapping Tools: Improved version released. EOS Trans. AGU 94, 409–410 (2013).
Acknowledgements
This study was partially supported by the Ministry of Education, Culture, Sports, Science and Technology (MEXT) of Japan, under The Second Earthquake and Volcano Hazards Observation and Research Program (Earthquake and Volcano Hazard Reduction Research) (K.Z.N., Y.Y.) and under STAR-E (Seismology TowArd Research innovation with data of Earthquake) Program Grant Number JPJ010217 (K.Z.N., T.K.), JSPS KAKENHI Grant Number JP 20K05050 (K.Z.N.), 21K04613 (K.Z.N.), 22K03752 (Y.Y.), 20K11704 (T.K.), the Chubu Electric Power's research based on selected proposals (K.Z.N.), the Consortium of Universities & Local Communities in Shizuoka (K.Z.N., Y.Y.), the Certified Nonprofit Organization Mount Fuji Research Station (K.Z.N.), the Japan Tobacco SDGs Contribution Project (K.Z.N.), and the WNI W-Bunka Foundation (K.Z.N.). The authors thank Y. Noda for help with implementing the MF method.
Author information
Authors and Affiliations
Contributions
K.Z.N. and Y.Y. designed the study. K.Z.N. conceived the analysis method, created figures, and wrote the paper. Preparation of waveform records used in this study were carried out by Y.Y. The MF method was modified by Y.Y. and K.Z.N. to be applicable to Mount Fuji. ETAS analyses were carried out by T.K. and K.Z.N. All authors developed the manuscript and approved the final manuscript.
Corresponding author
Ethics declarations
Competing interests
The authors declare no competing interests.
Additional information
Publisher's note
Springer Nature remains neutral with regard to jurisdictional claims in published maps and institutional affiliations.
Supplementary Information
Rights and permissions
Open Access This article is licensed under a Creative Commons Attribution 4.0 International License, which permits use, sharing, adaptation, distribution and reproduction in any medium or format, as long as you give appropriate credit to the original author(s) and the source, provide a link to the Creative Commons licence, and indicate if changes were made. The images or other third party material in this article are included in the article's Creative Commons licence, unless indicated otherwise in a credit line to the material. If material is not included in the article's Creative Commons licence and your intended use is not permitted by statutory regulation or exceeds the permitted use, you will need to obtain permission directly from the copyright holder. To view a copy of this licence, visit http://creativecommons.org/licenses/by/4.0/.
About this article

Cite this article
Nanjo, K.Z., Yukutake, Y. & Kumazawa, T. Activated volcanism of Mount Fuji by the 2011 Japanese large earthquakes. Sci Rep 13, 10562 (2023). https://doi.org/10.1038/s41598-023-37735-4
Received:
Accepted:
Published:
DOI: https://doi.org/10.1038/s41598-023-37735-4
Comments
By submitting a comment you agree to abide by our Terms and Community Guidelines. If you find something abusive or that does not comply with our terms or guidelines please flag it as inappropriate.
