
Abstract
The incidence of tuberculosis in Aragon, Spain, is around ten cases per 100,000 inhabitants. Since 2004, a molecular surveillance protocol has been carried out; therefore, all M. tuberculosis strains are genotyped. Recently, whole-genome sequencing has been implemented for relevant isolates. The aim of this work is to characterise at the molecular level the causative strains of the 26 largest outbreaks of the community (including ten or more cases), genotyped by IS6110-RFLP and causing 26% of tuberculosis cases. To achieve this objective, two or three isolates of each IS6110-cluster belonging to different years were selected for sequencing. We found that strains of lineages L4.8, L4.3 and L4.1.2 were the most frequent. The threshold of 12 SNPs as the maximum distance for confirming the belonging to an outbreak was met for 18 of the 26 IS6110-clusters. Four pairs of isolates with more than 90 SNPs were identified as not belonging to the same strain, and four other pairs were kept in doubt as the number of SNPs was close to 12, between 14 and 35. The study of Regions of Difference revealed that they are lineage conserved. Moreover, we could analyse the IS6110 locations for all genome-sequenced isolates, finding some frequent locations in isolates belonging to the same lineage and certain IS6110 movements between the paired isolates. In the vast majority, these movements were not captured by the IS6110-RFLP pattern. After classifying the genes containing SNP by their functional category, we could confirm that the number of SNPs detected in genes considered as virulence factors and the number of cases the strain produced were not related, suggesting that a particular SNP is more relevant than the number. The characteristics found in the most successful strains in our community could be useful for other researchers in epidemiology, virulence and pathogenesis.
Introduction
Tuberculosis (TB) is the world’s leading infectious disease killer, just surpassed by COVID-19 in 2020. In 2019, 10 million people fell ill with TB and 1.2 million died because of it1. The causative agent is Mycobacterium tuberculosis, with pulmonary TB being the most frequent presentation of the disease, although extrapulmonary forms can also occur2.
M. tuberculosis belongs to the M. tuberculosis complex (MTBC), which includes eight phylogenetic lineages. L1, L5, L6 and L7 are considered ancient lineages, along with the animal branch, while L2, L3 and L4 are considered modern lineages3. Members of L2 and L4 are responsible for the majority of TB cases in the world, and particularly, L4 and its corresponding sub-lineages are the most widespread among our population4.
Since 2004, a TB surveillance protocol has been carried out in Aragon, Spain, a low-incidence country with around ten cases per 100,000 inhabitants. All M. tuberculosis isolates are genotyped by IS6110-RFLP and Spoligotyping. As a result, we have a register of all M. tuberculosis genotypes and their relatedness (i.e. their belonging to some outbreak).
With the development of whole-genome sequencing (WGS), this technique is proposed to replace the standard molecular typing techniques as WGS has the highest resolution power5 and is now becoming affordable for investigation laboratories6.
To implement WGS in our routine laboratory, we planned to sequence two or three representative isolates of the 26 largest outbreaks in our community, which contained at least ten cases. The aim of this work is to characterise these strains at the molecular level and get a general view of the properties of these successful strains to be considered in future surveillance protocols.
Results
With the aim of characterising at the molecular level the responsible strains of the largest outbreaks in our community, comprising 665 out of the 2553 cases registered, we sequenced the genomes of the representative IS6110-clustered strains. The dendrogram based on their IS6110-RFLP patterns is shown in Fig. 1, and the MIRU-VNTR patterns and spoligotypes are detailed in Table S1.
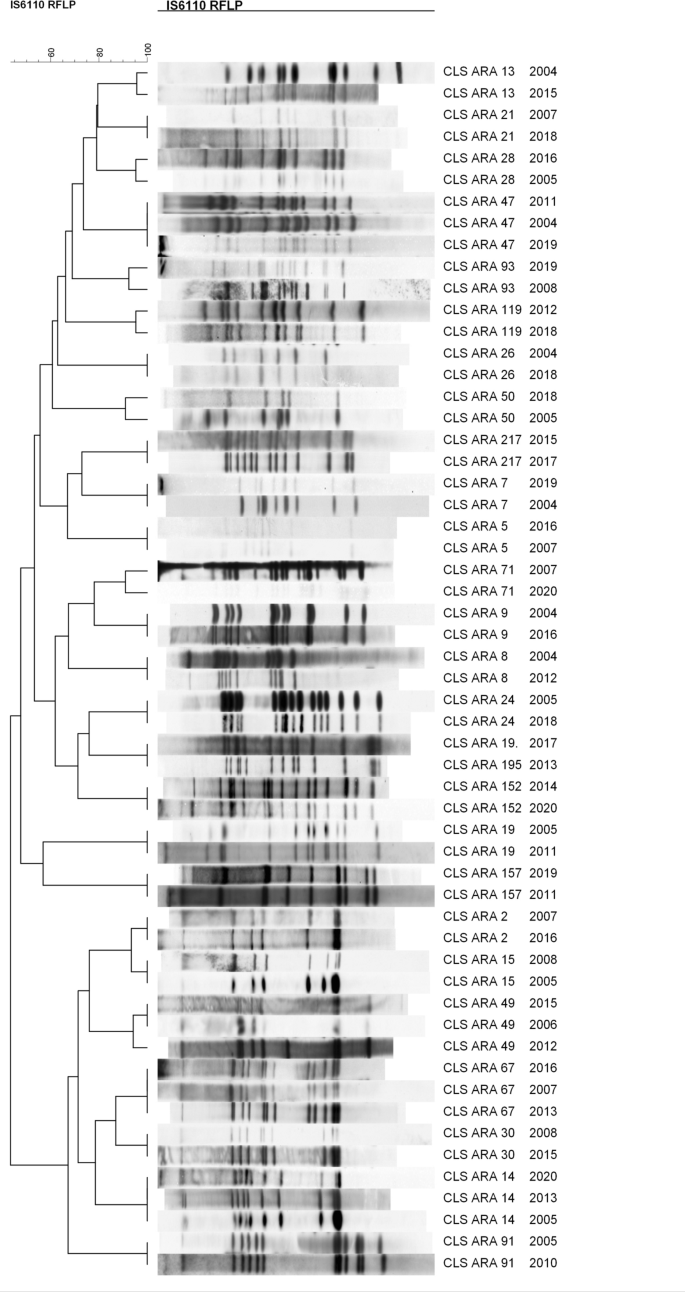
Dendrogram showing the IS6110-RFLP patterns of the selected isolates of the different outbreaks.
General views
The 26 IS6110-outbreaks studied ranged from 10 to 178 cases since 2004. Seven outbreaks were caused by L4.8 strains producing 291 cases. These include CLS_77, the largest outbreak we ever had, with 242 cases from 1993 to 2020 (no data for 1996–2000). Eight outbreaks were caused by L4.1.2/Haarlem strains producing 170 cases. Six outbreaks were produced by L4.3/LAM strains (two by a L4.3.2 strain, three by a L4.3.3 strain and one by a L4.3.4 strain), producing 121 cases. These included CLS_217, which was independently studied8. The rest of the outbreaks were caused by strains from different lineages: one by a L4.1.1.3/X strain, with 21 cases9; one by a L4.7 strain, with 19 cases; one by a L4.4.1.1 strain, with 16 cases; one by a L4.9 strain, producing 13 cases; and one by a L4.6.1.1 strain, with 14 cases.
SNP distances
It has been proposed that a distance of ≤ 5 SNPs between two isolates is considered recent contact and that 12 SNPs should be the maximum distance to consider both isolates to be the same strain and therefore the same outbreak10. Eighteen out of the 26 IS6110-clusters studied fit this threshold, indicating that the sequenced isolates belong to the same WGS-outbreak. We found a distance of 1–10 SNPs among the two or three isolates sequenced for 18 of the IS6110-clusters studied (Table 1). In Table S2, a description of the SNPs found in these clusters (point, gene, type of mutation, effect of the mutation) can be found. For CLS_15, lineage identification revealed that one selected isolate belonged to L4.1.2.1 and the other to L4.8. A new revision of the genotype patterns confirmed that the correct one was L4.1.2.1, so the L4.8 isolate was a selection error. The SNP distance could not be studied for this IS6110-cluster. For three clusters, the SNP distance was large enough to guarantee that the selected isolates were not the same strain. CLS_2 had an SNP distance of 145, CLS_49 of 143 among the three sequenced isolates, and CLS_26 of 93. On the other hand, four clusters had a distance higher than 12 SNPs but close. CLS 157 had a distance of 34 SNPs between the two sequenced isolates. CLS_47 had an SNP distance of 35 among the three sequenced isolates; however, the majority of SNPs were due to one of the isolates, with the other two being more related (less than 12 SNPs). Finally, CLS_119 had an SNP distance of 18 and CLS_9 of 14 (Tables 1, Table S2).
Regions of Difference (RDs) study
We looked for large deletions (Regions of Difference or RDs)11 to find differences between the clustered strains and non-clustered strains previously analysed in our laboratory of the same lineage. According to Coll et al.12, RD182 is specific to L4.1.2.1, RD219 is specific to L4.8, RD115 is specific to L4.3.3 and RD724 is specific to L4.6.1.1. All clustered and non-clustered strains were concordant with these specific characteristics. No different RD was found among the clustered and non-clustered strains, with the majority of them being lineage conserved. In addition, the RDs of the isolates belonging to the same IS6110-outbreak were the same even in those with a high SNP distance. We only found one different large deletion, not previously described as an RD, between the isolates of CLS_119: one of the isolates had Rv3054c-Rv3055-dinP-Rv3057 genes deleted, while the other conserved this region as the reference strain. The RDs of the different strains are shown in Table 2.
IS6110 locations
WGS allowed us to locate all the IS6110 copies in the genomes of the clustered strains. The highest number of copies was found among the strains belonging to L4.3 (average number of IS6110 copies = 16.3), followed by the L4.8 strains (12.6) and the L4.1.2.1 strains (11.4). The description with the exact locations in all the isolates studied is in Table S3. For the L4.3 strains, three copies were present in all the strains studied—lpqQ:Rv0836c, Rv1754c (RD152 area), and Rv3113. Moreover, copies located at cut1, ppe38 and MT3426:MT3427 were frequent. For L4.1.2.1, five copies located at Rv0403c, Rv2336, Rv1754c, Rv0963c and MT3429 were present in all the strains studied. We observed the same locations for other sequenced non-clustered strains of the same lineages (L4.3 and L4.1.2.1). For the L4.8 strains, copies within MT3429, Rv1668:Rv1669c and Rv1762c:Rv1763c (RD152 area) were present in all the strains studied, while copies located at ppe71 and Rv0795-Rv0796 were frequent. A summary with the common and frequent IS6110 copies in the different lineages is shown in Table 3.
We observed some IS6110 movements among the clustered isolates studied. In five of them, additional copies were detected in the later isolate. In CLS_21, the isolate from 2018 had an extra IS in the DR region that was not present in the isolate from 2007. In CLS_13, the isolate from 2015 had two extra IS copies located in ppe28:ppe29 and Rv0756c that were absent in the 2004 isolate. In CLS_93, the isolate from 2019 had an extra IS copy located in Rv3177, absent in the isolate from 2008. In CLS_71, the isolate from 2020 had two extra IS copies located in Rv1371 and phoT that were not present in the isolate from 2007. Finally, in CLS_152, the isolate from 2020 had an extra IS6110 in Rv1730c:gabD2 that was absent in the 2014 isolate. On the other hand, in four cases, an extra IS6110 was detected in the earlier isolate. The CLS_2 isolate of 2007 had an extra IS6110 located in Rv3183:Rv3184 that was not in the later isolate of 2016. In CLS_24, the isolate from 2005 had an extra IS6110 located at MT3426 that was absent in the 2018 isolate. In CLS 50, the isolate from 2005 had an extra IS copy located in MT3427. Lastly, in CLS_91, the isolate from 2005 had an IS6110 located at the plcA gene that was absent in the isolate from 2010. CLS_49 was a special case: the isolate from 2012 had an extra IS inserted within the Rv1765c gene (or its homologous Rv2015c) that was not present in the other two isolates studied, and the isolate from 2015 had an extra IS located at ppe49 that was absent in the other two isolates of this cluster. This is in accordance with the large number of SNPs observed among these isolates (143 SNPs). The same could be applied to CLS_2, with an SNP distance of 145. On the other hand, we found identical number of IS6110 copies and locations for the isolates that apparently were of the same RFLP cluster but, according to the SNP distance, would not be. This occurred for CLS_9, CLS_26, CLS_47, CLS_119 and CLS_157, although the SNP distance for CLS_9 and CLS_119 was very close to 12 (14 and 18 SNPs, respectively). The IS6110 movements are shown in Table S3.
Some of the deletions observed could be explained by a homologous recombination between two close IS6110 resulting in the loss of the intermediate genes as one IS6110 was found interrupting the genes involved. This was observed for CLS_30 isolates, showing the loss of Rv2817c:Rv2819c genes; CLS_157 and the deletion of plcC-plcB-plcA genes; CLS_13 and the deletion between plcC and ppe40; CLS_5, CLS_7, CLS_28, CLS_47 and CLS_119, and the deletion between cut1 and Rv1765c; CLS_93 and the deletion between ppe38 and ppe71; CLS_8 and CLS_217, and the deletion of plcD gene; CLS_26 and the deletion between plcD and Rv1765c; CLS_9 and the Rv2810c:Rv2813 deletion; and CLS_152 and the deletion of Rv2018 and Rv2019.
SNPs in virulence factors
All the L4.1.2.1 strains, including the non-clustered strains reviewed, had 14 common SNPs in genes considered as virulence factors (mce2D, ctpV, Rv1290c, Rv1505c, pks5, mgtC, secA2, Rv1915, Rv1915, Rv1982c, pks12, Rv2494, cyp125 and esxB)13. The L4.3 strains had four common SNPs (mce1D, Rv0990c, mce3F and fadE28). In addition, there were four more common SNPs for the L4.3.2 strains (Rv0204c, Rv1939, Rv3085 and Rv3871) and three for the L4.3.3 strains (mmaA4, pks12 and Rv3088). The L4.8 strains shared only one common SNP in a gene considered as a virulence factor (ptpA). Looking into the isolates studied in the rest of the sub-lineages, the average SNP number was eight, all being unique SNPs. However, there was no relation between the number of SNPs in the genes considered as virulence factors and the number of cases of the IS6110-cluster (p-value = 0.8) (Fig. 2).

Number of cases of each IS6110-cluster vs. SNP number in genes considered as virulence factors. No cause–effect relationship is observed (p-value = 0.8). Clusters with more than 90 SNPs were not considered.
As these common sub-lineage SNPs were present in the clustered strains as well as non-clustered strains, we also decided to focus on the specific SNPs of each WGS-cluster strain. The L4.1.2.1 strains turned out to have less specific SNPs (an average of 3.6), followed by the L4.3 (4.7) and L4.8 (5.9) strains. Graphics with the SNPs classified according to the gene categories that Forrellad et al. and Ramage et al.13,14 described are shown in Fig. 3. The L4.8 strains had more SNPs in the cell wall proteins (usually mce genes), synthesis of the complex lipids and toxin/antitoxin systems categories. For the L4.3 strains, the cell wall proteins category stands out above the rest. For the L4.1.2.1 strains, the secretion systems, cell wall proteins and toxin/antitoxin systems categories have more SNPs. A detailed list of the specific SNPs and descriptions of the genes can be found in Table S4. Regarding the WGS-clusters from other lineages, the synthesis of complex lipids, cell wall proteins and toxin/antitoxin systems categories had more SNPs.

Specific SNPs in virulence genes for each WGS-cluster classified by lineage according to the categories of Forrellad et al. and Ramage et al.13,14. The number of categories remains constant among the three main lineages studied (L4.8, L4.3 and L4.1.2.1). The oxidative and nitrossidative stress, other genes related to lipid synthesis, cell wall proteins, synthesis of complex lipids and toxin/antitoxin systems categories are present in the three lineages. For clusters belonging to the L4.4.1.1, L4.9, L4.6.1.1 and L4.1.1.3/X families, there were no common and specific SNPs as only one cluster of each lineage had been sequenced, so comparison was not possible. The categories with more SNPs for these lineages were cell wall proteins, the synthesis of complex lipids and toxin/antitoxin systems. Clusters with more than 90 SNPs were not considered.
Discussion
We describe in this work the molecular characteristics of M. tuberculosis strains that produced the largest outbreaks in our community. Three of these outbreak strains were previously characterised7,8,9 (CLS_ 217, CLS_50 and CLS_7). The majority of publications about TB outbreaks based on WGS focus on the power of this methodology to determine whether the isolates belong to the same cluster and/or attempt to elucidate the transmission chain10,15. However, few articles focus on the molecular characteristics of relevant strains using WGS16.
A total of 665 TB cases had been caused by some of these studied strains since 2004, which represents 26% of the total TB cases in our community. As expected, all these strains belonged to L4, which is the lineage responsible for the majority of TB cases in our population4. The most widespread lineages were L4.8, L4.1.2.1/Haarlem and L4.3/LAM, in concordance with the dominant lineages in Spain described by Stucki et al.4.
Regarding the SNP distance, the WGS results were in agreement with the RFLP-IS6110 patterns for 18 outbreaks, including the three previously studied 7,8,9: the genetic distance was between 1 and 10 SNPs, so they were considered epidemiologically linked isolates10,17,18. However, the classical gold-standard RFLP technic failed to cluster the isolates of CLS_2, CLS_49 and CLS_26. For CLS_2, there was an extra IS6110 in one of the isolates that was not captured in the RFLP patterns. For CLS_49, two isolates had an identical RFLP pattern, while the third had an extra band, although initially, it was considered the same strain that had evolved. WGS confirmed this extra IS6110 for this isolate and a different one for the other isolates that RFPL did not show. As for CLS_26, the RFLP pattern was the same but also the IS6110 locations found by WGS, a total of six, which is the threshold indicated for discrimination by RFLP pattern. Thanks to the greater resolution power of WGS19, we deciphered that these IS6110-clustered isolates were not epidemiologically related as the SNP distance was more than 90 despite sharing similar IS locations.
On the other hand, WGS did not clarify the relatedness in CLS_9, CLS_47, CLS_119 and CLS_157 using only the SNP distance information. These IS6110-clusters have distances of more than 12 SNPs but are very close. Furthermore, the IS6110 locations found by WGS were exactly the same, along with their RFPL patterns (16, 13, 12 and 11 IS6110, respectively). The number of bands is large/high enough to be considered a fluke, reflecting that both isolates corresponded to the same strain despite the number of SNPs being ≥ 12. There is a fact about CLS_119 that would support the idea of separating one isolate from its pair: the deletion of the Rv3054:Rv3058 region in one of the isolates but not in the other. We considered this deletion, which could not be explained by an IS6110 recombination, an independent event that took place in this particular isolate. It is important to consider that the traceability between the selected isolates is not defined, making the intermediate cases that have occurred between them unknown. Although this is not frequent, strains can evolve during the transmission process. If the isolates of CLS_119 are not epidemiologically linked, a genetic separation between them must have taken place recently. It would be interesting to analyse the complete isolates of this cluster to understand their evolution, as well as the rest of the clusters to track for recent transmission. However, the 12 SNP threshold should be polished to clarify these intermediate SNP distances as for now, the significance of their relatedness is unclear.
One important fact is that the mutation rate is not the same for all MTBC strains. In the independent studies we made for CLS_7 and CLS_507,9, we found that all the isolates studied had ≤ 12 SNPs with at least one isolate, confirming its belonging to the outbreak, although the strains had been circulating for more than 25 years. Some isolates presented several unique SNPs, which could be due to sequencing errors or favoured by the epidemiological characteristics of the patient, which could increase the SNP distance. For the outbreaks studied in this work, we only analysed two or three isolates; therefore, the SNP distance with some other isolates of the IS6110-cluster could be ≤ 12, indicating its membership to the outbreak. This could be the case of CLS_9, with an SNP distance of 14.
The RD study showed that the majority of RDs are lineage conserved, so they are present in clustered as well as non-clustered strains. Nevertheless, RD152 and RD188 are distributed among different sub-lineages, which may be due to both regions containing hot spots for IS6110 insertions, causing later recombination events20,21,22. RD178 (a fragment of the helZ gene), RD252 and RD149 are also distributed among different lineages, especially RD149. This deletion has been associated with a reduction in growth and an increase in the induction of TNFα in host cells by CAS1 strains23. However, as this RD is also present in the non-clustered strains, this may not be responsible for the success in transmission of the outbreak strains.
WGS allowed an easier study of the IS6110 location than the molecular techniques based on PCR, previously used. We found some lineage-conserved locations, in accordance with those described before24. It called our attention to the presence of an IS6110 copy in the ppe38/ppe71 locus in many of the strains studied (67.4%). The deletion of this locus has been related to virulence in L2/Beijing strains25, so the disruption of these genes by an IS6110 could be an advantage for the mycobacteria. This could be the reason why so much polymorphism is observed in this region. The study of the IS also allowed us to discover movements of this mobile element between the different isolates for 10 of the clusters studied. Some of them were captured by the RFLP pattern, but others were not. These observations lead us to believe that IS6110 transposition could occur during infection, although majority of the time, it would fail, provoking some handicap to the bacteria.
We decided to study SNPs in genes considered virulence factors as we previously observed that a single SNP in one of these genes could be responsible for higher transmission7,9. We focused on the specific SNPs of each cluster strain as the ones present in both clustered and non-clustered strains would not be related to higher virulence or transmission. We observed no relationship between the number of SNPs in these genes and the number of cases the strain produced, so we concluded that a particular SNP is more important than the number. We describe these SNPs in Table S4, but more research is required to determine whether some of them are responsible for the increase of transmission of these outbreak strains. SNPs in the categories oxidative and nitrossidative stress, other genes related in lipid synthesis, cell wall proteins, synthesis of complex lipids and toxin/antitoxin systems are present in almost all the strains studied, so those genes may be important for the success of the outbreak strains.
In conclusion, we describe in this work the molecular characteristics—lineage, presence or absence of RD, IS6110 locations and SNPs in virulence factors—of the most successful strains in our population. We give value to the classical techniques maintained along the time to track the pathway of these strains. We are deep into evolution and have identified potential outbreak features, shared by some of these strains, to develop surveillance actions.
Materials and methods
Clinical sample selection
All IS6110-RFLP and Spoligo patterns of the M. tuberculosis isolates from 2004 to 2020 were loaded in the Bionumerics database (v7.6, Applied Maths, Kortrijk, Belgium). Among the 2553 genotyped isolates, we selected two or three isolates belonging to each of the IS6110-clusters involving 10 or more cases of TB: CLS 2 (one isolate from 2007 and one from 2016), CLS 5 (2007/2016), CLS 7 (2004/2019), CLS 8 (2004/2012), CLS 9 (2004/2016), CLS 13 (2004/2015), CLS 14 (2005/2013/2020), CLS 15 (2005/2008), CLS 19 (2005/2011), CLS 21 (2007/2018), CLS 24 (2005/2018), CLS 26 (2004/2018), CLS 28 (2005/2016), CLS 30 (2008/2015), CLS 47 (2004/2011/2019), CLS 49 (2006/2012/2015), CLS 50 (2005/2018), CLS 67 (2007/2013/2016), CLS 71 (2007/2020), CLS 91 (2005/2010), CLS 93 (2008/2019), CLS 119 (2012/2018), CLS 152 (2014/2020), CLS 157 (2011/2019), CLS 195 (2013/2017) and CLS 217 (2015/2017). Three of these clusters were independently studied by WGS: CLS 77 (57 isolates sequenced), CLS 509 (32 isolates sequenced), and CLS 2178 (13 isolates sequenced).
Thirteen genomes from different sub-lineages, six from L4.1.2 and seven from L4.3, not involved in any of the large outbreaks (non-clustered strains) and sequenced in previous studies, were used to make the comparisons with the clustered strains belonging to these sub-lineages.
DNA extraction and classical genotyping
DNA was extracted from bacterial cultures using the cetrimonium bromide method described by van Soolingen26. The IS6110-RFLP and Spoligo genotyping were made for all the isolates, as previously described27,28. An IS6110-cluster was defined as having the same or similar RFLP pattern (one extra IS6110 band was accepted if some epidemiological link was found). Mycobacterial interspersed repetitive unit-variable number of tandem repeats (MIRU-VNTR) was performed for one isolate of each cluster29. The DNA samples were stored at − 20 °C until sequencing.
Whole-genome sequencing (WGS)
The majority of DNA (50 isolates) were sequenced using Illumina technology. However, some DNA used in previous studies (six isolates) were sequenced using the IonTorrent sequencing platform. Both technologies were applied according to the manufacturer’s instructions. After sequencing, the fastQ files obtained were mapped against the reference strain H37Rv (NC_000962.3) to obtain the Binary Aligned Map (bam) and the Variant Call Format (vcf) files. The SNP classification established by Coll et al.12 was used for identifying the MTBC lineage of the outbreak strains. This classification is based on the specific SNPs of the different lineages.
Bioinformatics
The Bionumerics software was used for the SNP study and for the construction of the dendrograms using the UPGMA method. For greater accuracy, strict SNP filtering that removed positions with at least one ambiguous or unreliable base, gaps (maximun frequency 1%), non-discriminatory positions and ppe and pgrs genes, was applied. It was also considered that the retained SNP positions had a minimum 5 × coverage and that the minimum distance between SNPs was at least 12 base pairs (bp). The Integrative Genomics Viewer (IGV, from the Broad Institute30) software was used for the RD study and the SNP study. GeneWise (https://www.ebi.ac.uk/Tools/psa/genewise/) and PROVEAN (http://provean.jcvi.org/seq_submit.php) platforms were used for the SNP study, predicting whether an SNP is synonymous or non-synonymous and the effect of a non-synonymous mutation is neutral or deleterious, respectively. All SNPs are referred to H37Rv genome (NC_000962.3), unless otherwise indicated.
From the fastQ files, the reads containing the first 30 bases of the IS6110 and the ones with the last 30 were extracted. We used Tuberculist (http://genolist.pasteur.fr/TubercuList/) and Bovilist (http://genolist.pasteur.fr/BoviList/) to apply BLAST and find the IS6110 insertion points. Mycobrowser (https://mycobrowser.epfl.ch/) and UniProtKB (https://www.uniprot.org/uniprot/) websites were used to find information on the genes and proteins with noteworthy SNPs.
Data availability
The fastq files of the selected isolates of each outbreak are uploaded in GenBank with the accession numbers SAMN26722357-SAMN26722406 (BioProject accession number PRJNA816739). https://www.ncbi.nlm.nih.gov/bioproject/?term=PRJNA816739.
References
WHO. WHO | Global tuberculosis report 2019. Geneva: World Health Organization. Licence: CC BY-NC-SA 3.0 IGO (2019).
García-Rodríguez, J. F. et al. Extrapulmonary tuberculosis: Epidemiology and risk factors. Enferm. Infecc. Microbiol. Clin. 29(7), 502–509. https://doi.org/10.1016/j.eimc.2011.03.005 (2011).
Gagneux, S. et al. Variable host-pathogen compatibility in Mycobacterium tuberculosis. Proc. Natl. Acad. Sci. U.S.A. https://doi.org/10.1073/pnas.0511240103 (2006).
Stucki, D. et al. Mycobacterium tuberculosis lineage 4 comprises globally distributed and geographically restricted sublineages. Nat. Genet. 48(12), 1535–1543. https://doi.org/10.1038/ng.3704 (2016).
Nikolayevskyy, V. et al. Role and value of whole genome sequencing in studying tuberculosis transmission. Clin. Microbiol. Infect. 25(11), 1377–1382. https://doi.org/10.1016/j.cmi.2019.03.022 (2019).
Cirillo, D. M. et al. Use of WGS in Mycobacterium tuberculosis routine diagnosis. Int. J. Mycobacteriol. https://doi.org/10.1016/J.IJMYCO.2016.09.053 (2016).
Comín, J. et al. The MtZ strain: Molecular characteristics and outbreak investigation of the most successful Mycobacterium tuberculosis strain in Aragon using whole-genome sequencing. Front. Cell. Infect. Microbiol. 12, 887134. https://doi.org/10.3389/fcimb.2022.887134 (2022).
Comin, J. et al. Investigation of a rapidly spreading tuberculosis outbreak using whole-genome sequencing. Infect. Genet. Evol. https://doi.org/10.1016/j.meegid.2020.104184 (2020).
Comín, J. et al. A whole-genome sequencing study of an X-family tuberculosis outbreak focus on transmission chain along 25 years. Tuberculosis https://doi.org/10.1016/j.tube.2020.102022 (2021).
Lalor, M. K. et al. The use of whole-genome sequencing in cluster investigation of a multidrug-resistant tuberculosis outbreak. Eur. Respir. J. 51(6), 1702313. https://doi.org/10.1183/13993003.02313-2017 (2018).
Tsolaki, A. G. et al. Functional and evolutionary genomics of Mycobacterium tuberculosis: Insights from genomic deletions in 100 strains. Proc. Natl. Acad. Sci. https://doi.org/10.1073/pnas.0305634101 (2004).
Coll, F. et al. A robust SNP barcode for typing Mycobacterium tuberculosis complex strains. Nat. Commun. 5, 4–8. https://doi.org/10.1038/ncomms5812 (2014).
Forrellad, M. A. et al. Virulence factors of the Mycobacterium tuberculosis complex. Virulence https://doi.org/10.4161/viru.22329 (2013).
Ramage, H. R., Connolly, L. E. & Cox, J. S. Comprehensive functional analysis of Mycobacterium tuberculosis toxin-antitoxin systems: Implications for pathogenesis, stress responses and evolution. PLoS Genet. 5(12), e1000767. https://doi.org/10.1371/journal.pgen.1000767 (2009).
Walker, T. M. et al. Assessment of Mycobacterium tuberculosis transmission in Oxfordshire, UK, 2007–12, with whole pathogen genome sequences: An observational study. Lancet Respir. Med. https://doi.org/10.1016/S2213-2600(14)70027-X (2014).
Folkvardsen, D. B. et al. Genomic epidemiology of a major Mycobacterium tuberculosis outbreak: Retrospective cohort study in a low-incidence setting using sparse time-series sampling. J. Infect. Dis. 216(3), 366–374. https://doi.org/10.1093/infdis/jix298 (2017).
Casali, N. et al. Whole genome sequence analysis of a large isoniazid-resistant tuberculosis outbreak in London: A retrospective observational study. PLoS Med. 13(10), 1–18. https://doi.org/10.1371/journal.pmed.1002137 (2016).
Hatherell, H. A. et al. Interpreting whole genome sequencing for investigating tuberculosis transmission: A systematic review. BMC Med. https://doi.org/10.1186/s12916-016-0566-x (2016).
Meehan, C. J. et al. The relationship between transmission time and clustering methods in Mycobacterium tuberculosis epidemiology. EBioMedicine 37, 410–416. https://doi.org/10.1016/j.ebiom.2018.10.013 (2018).
Ho, T. B. L., Robertson, B. D., Taylor, G. M., Shaw, R. J. & Young, D. B. Comparison of Mycobacterium tuberculosis genomes reveals frequent deletions in a 20 kb variable region in clinical isolates. Yeast 1(4), 272–282. https://doi.org/10.1002/1097-0061(200012)17:4%3c272::AID-YEA48%3e3.0.CO;2-2 (2000).
Vera-Cabrera, L., Hernández-Vera, M. A., Welsh, O., Johnson, W. M. & Castro-Garza, J. Phospholipase region of Mycobacterium tuberculosis is a preferential locus for IS6110 transposition. J. Clin. Microbiol. https://doi.org/10.1128/JCM.39.10.3499-3504.2001 (2001).
Vera-Cabrera, L. et al. Genetic characterization of Mycobacterium tuberculosis clinical isolates with deletions in the plcA-plcB-plcC locus. Tuberculosis 87(1), 21–29. https://doi.org/10.1016/j.tube.2006.01.023 (2007).
Kanji, A. et al. Presence of RD149 deletions in M. tuberculosis Central Asian Strain 1 isolates affect growth and TNFα induction in THP-1 monocytes. PloS One 6(8), e24178. https://doi.org/10.1371/journal.pone.0024178 (2011).
Reyes, A. et al. IS-seq: A novel high throughput survey of in vivo IS6110 transposition in multiple Mycobacterium tuberculosis genomes. BMC Genom. https://doi.org/10.1186/1471-2164-13-249 (2012).
Ates, L. S. et al. Mutations in ppe38 block PE-PGRS secretion and increase virulence of Mycobacterium tuberculosis. Nat. Microbiol. 3(2), 181–188. https://doi.org/10.1038/s41564-017-0090-6 (2018).
van Soolingen, D., de Haas, P. E., Hermans, P. W. & van Embden, J. D. DNA fingerprinting of Mycobacterium tuberculosis. Methods Enzymol. 235, 196–205 (1994).
Van Embden, J. D. A. et al. Strain identification of Mycobacterium tuberculosis by DNA fingerprinting: Recommendations for a standardized methodology. J. Clin. Microbiol. 31, 406–409 (1993).
Kamerbeek, J. et al. Simultaneous detection and strain differentiation of Mycobacterium tuberculosis for diagnosis and epidemiology. J. Clin. Microbiol. https://doi.org/10.1128/jcm.35.4.907-914.1997 (1997).
Supply, P. et al. Proposal for standardization of optimized mycobacterial interspersed repetitive unit-variable-number tandem repeat typing of Mycobacterium tuberculosis. J. Clin. Microbiol. https://doi.org/10.1128/JCM.01392-06 (2006).
Robinson, J. T. et al. Integrative Genome Viewer. Nat. Biotechnol. 29(1), 24–26. https://doi.org/10.1038/nbt.1754.Integrative (2011).
Acknowledgements
Authors would like to acknowledge the use of Servicio General de Apoyo a la Investigación-SAI, Universidad de Zaragoza (Servicio de Análisis Microbiológico), and Servicios Científico Técnicos, IACS (Servicio de Secuenciación y Genómica Funcional and Servicio de Biocomputación). We would like to thank the EPIMOLA group for supplying the genotyped bacterial DNA used in this work. This work was supported by the Carlos III Health Institute in the context of a Grant (FIS18/0336) and J.C. was awarded a scholarship by the Government of Aragon/European Social Fund, “Building Europe from Aragon”.
Author information
Authors and Affiliations
Contributions
S.S. “conceptualization, funding acquisition, writing the manuscript”. J.C. “laboratory work, analysis the data, writing the manuscript”. A.C. “statistical analysis, biocomputational work”. M.J.I., D.I., J.V., L.T. & J.S. “genotyping surveillance, epidemiological support”.
Corresponding author
Ethics declarations
Competing interests
The authors declare no competing interests.
Additional information
Publisher's note
Springer Nature remains neutral with regard to jurisdictional claims in published maps and institutional affiliations.
Supplementary Information
Rights and permissions
Open Access This article is licensed under a Creative Commons Attribution 4.0 International License, which permits use, sharing, adaptation, distribution and reproduction in any medium or format, as long as you give appropriate credit to the original author(s) and the source, provide a link to the Creative Commons licence, and indicate if changes were made. The images or other third party material in this article are included in the article's Creative Commons licence, unless indicated otherwise in a credit line to the material. If material is not included in the article's Creative Commons licence and your intended use is not permitted by statutory regulation or exceeds the permitted use, you will need to obtain permission directly from the copyright holder. To view a copy of this licence, visit http://creativecommons.org/licenses/by/4.0/.
About this article

Cite this article
Comín, J., Cebollada, A., Ibarz, D. et al. Analysis of the twenty-six largest outbreaks of tuberculosis in Aragon using whole-genome sequencing for surveillance purposes. Sci Rep 12, 18766 (2022). https://doi.org/10.1038/s41598-022-23343-1
Received:
Accepted:
Published:
DOI: https://doi.org/10.1038/s41598-022-23343-1
Comments
By submitting a comment you agree to abide by our Terms and Community Guidelines. If you find something abusive or that does not comply with our terms or guidelines please flag it as inappropriate.
