
Abstract
Gene expression, DNA methylation, and their organizational relationships are commonly altered in lung squamous cell carcinoma (LUSC). To elucidate these complex interactions, we reconstructed a differentially expressed gene network and a differentially methylated cytosine (DMC) network by partial information decomposition and an inverse correlation algorithm, respectively. Then, we performed graph union to integrate the networks. Community detection and enrichment analysis of the integrated network revealed close interactions between the cell cycle, keratinization, immune system, and xenobiotic metabolism gene sets in LUSC. DMC analysis showed that hypomethylation targeted the gene sets responsible for cell cycle, keratinization, and NRF2 pathways. On the other hand, hypermethylated genes affected circulatory system development, the immune system, extracellular matrix organization, and cilium organization. By centrality measurement, we identified NCAPG2, PSMG3, and FADD as hub genes that were highly connected to other nodes and might play important roles in LUSC gene dysregulation. We also found that the genes with high betweenness centrality are more likely to affect patients’ survival than those with low betweenness centrality. These results showed that the integrated network analysis enabled us to obtain a global view of the interactions and regulations in LUSC.
Introduction
Lung squamous cell carcinoma (LUSC) is the second most common subtype of lung cancer after lung adenocarcinoma, accounting for 20% of all lung cancer diagnoses1. It is characterized by keratinization and/or intercellular bridges of lung epithelial cells2. The progressive accumulation of mutations and epigenetic abnormalities are common and drive LUSC progression3. Progress in LUSC research has revealed the roles of genetic abnormalities of TP53, PI3KCA, FGFR1 and others in LUSC pathogenesis and treatments4. Epigenetic studies on LUSC also found important drivers of cancer, such as the methylation of NFE2L2, SOX2, and TP635,6. However, only a few studies have explored and analyzed the organizational and hierarchical interactions between these drivers in LUSC. Studies of the interactions between the genes and their regulators are vital to understand the pathogenesis and aid the management of LUSC.
Network-based modeling is a powerful approach for analyzing the interactions between variables. A network or graph is a mathematical structure made up of vertices (or nodes) connected by edges (or links). The vertices and edges might have some properties that describe their characteristics. Network-based modeling has been used to study gene and cytosine methylation relationships. For example, a network study in leukemia found that both gene expression and methylation consistently affected the Ras, PI3K-Akt, and Rap1 signaling pathways7. Another study identified novel cancer-related pathways by integrating methylation data and protein-protein interaction networks8. These studies used the networks that were obtained from open-source databases.
In our study, we computationally reconstructed and integrated the differentially expressed gene (DEG) network and the differentially methylated cytosine (DMC) network. The advantage of this approach is that it enables us to find novel interactions that have not been included in the existing databases. This integrated graph can provide a blueprint of the gene-gene and methylation-gene interactions in cancer. We can obtain much information by analyzing the graph topology, for example, the identification of important regulatory genes by centrality measurements7,9 and the clustering of similar nodes using community detection analysis10. By integrating the DMC network and DEG network, we could study the coordination of cellular systems at the gene and methylation levels simultaneously. Our analysis may provide a basis for the identification of novel interactions and core regulatory genes in LUSC.
Results
Network characteristics
Using the data derived from the Genomic Data Commons-The Cancer Genome Atlas Lung Squamous Cell Carcinoma (GDC-TCGA-LUSC) datasets, we performed differential expression analyses of gene expression and cytosine methylation. Then, we used the partial information decomposition and context (PIDC) and enhancer linking by methylation/expression relationships (ELMER) algorithms to reconstruct the DEG and DMC networks, respectively. In brief, partial information decomposition decomposes the mutual information between genes into unique, redundant, and synergistic components. PIDC calculates the relationship between genes as the mean proportion of unique components. Then, PIDC will return all possible edges between genes and its ranks. The edges in the DEG network represent the highest 1% of the PIDC rank. For the methylation network, the ELMER algorithm selects the closest 10 upstream genes and the closest 10 downstream genes for each DMC. Then, the inverse correlation between DMC methylation and gene expression is tested. The edges in the DMC network represent the significant (adjusted-\(P < 0.01\)) inverse correlations. Next, we took the union of both graphs and extracted the giant component of the graphs. The flowchart in Fig. 1 summarizes the analysis steps of our study.
The final result of the integrated network had 9748 nodes and 228246 edges. Out of 9748 nodes, 7903 were identified as DEGs, and the remaining 1845 were DMC probes. The edges consisted of 224149 gene-gene and 4097 probe-gene interaction edges (3369 hypomethylated and 728 hypermethylated edges) (Fig. 2). We listed all the nodes and edges in Supplementary Tables S1 and S3.
Community identification analysis
Using the Leiden algorithm10, we identified the 10 largest communities that had at least 200 nodes and accounted for approximately 50% of the total nodes. We named and ranked each of the communities based on the number of nodes in the community (e.g., the largest community is Community 1, the second largest is Community 2) (Fig. 3). Gene set enrichment analysis revealed the functional classes of each community. For example, the largest community, Community 1, mainly included genes for DNA replication and the cell cycle. The next largest communities, Communities 2, 3, and 4, included genes that were responsible for keratinization, the immune system, and complement-coagulation cascade pathways, respectively. We listed the 10 largest communities and some of their functional classes in Table 1. The complete list is shown in Supplementary Table S3.
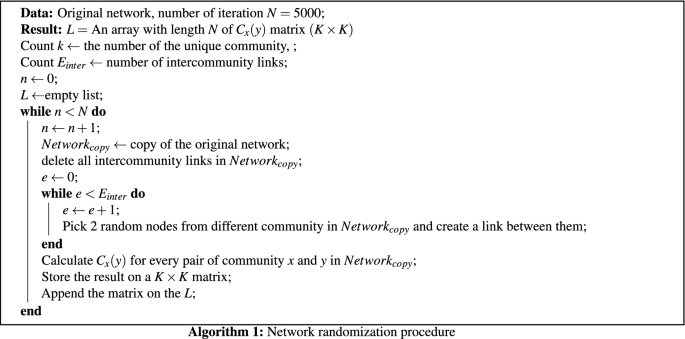
Figure 3 helps visualize the interaction between communities. We used ForceAtlas2 as a network layout algorithm to display the network in a 2-dimensional image12. ForceAtlas2 is a force-directed layout algorithm where nodes repulse each other like charged particles, while edges attract their nodes, like springs. In this algorithm, the stronger the interaction between the communities, the closer they are. For example, Community 3 has a closer relationship to Communities 6 and 4 than to Community 8. To quantitatively measure the strength of the interaction, we calculated \(C_x(y)\), which is the ratio of the links connected between Communities x and y to the total number of intercommunity links on Community x. The intercommunity links are the links that connect one community to another community. Figure 4 shows the heatmap of the ratio \(C_x(y)\) from source community x to target community y. We used Community 3 as an example. As shown in the heatmap, Community 3 in row 3 has most of its intercommunity links connected to Community 4 (26%) and Community 6 (14%). We tested the significance of \(C_{x}(y)\) using a network randomization test. We found that every \(C_{x}(y)\) value in Fig. 4 was not random (Supplementary Table S4).

Flowchart of the analysis steps in our study.

Integrated network of cytosine methylation and gene expression. Green nodes are the genes, and red nodes are the methylation probes. Blue edges, red edges, and gray edges are the hypomethylation, hypermethylation, and gene-gene relationships, respectively.

Interaction of the 10 largest communities in the network. We included only nodes that have a degree of at least 15 to simplify the illustration. The size of the nodes is correlated with the betweenness centrality. The gray nodes are the nodes that are not members of any of the 10 major communities. We also listed some of the functional classes of each community.

Heatmap of the ratio \(C_x(y)\). Each row of the heatmap shows the relative proportion \(C_x(y)\) of the intercommunity links from the source community x (vertical axis) to the target community y (horizontal axis). Every \(C_x(y)\) value in the figure is not random by network randomization test.

Significant positive correlation between the number of the genes that affect survival and the betweenness centrality.

Numbers of differentially hypomethylated/hypermethylated genes and probes in each community.
Centrality measure analysis
Centrality measure analysis was used to investigate the roles of some nodes and their impact on the networks. There are various centrality measurements, such as degree centrality, closeness centrality, and betweenness centrality. Here, we focused on betweenness centrality. The betweenness centrality of a node measures the number of shortest paths that pass through that node. In the gene regulation network, sometimes the most important nodes in the system are not the ones with the highest number of edges but the middleman that connects groups or the ones that have the most control over the flow of the information. Betweenness centrality measures the amount of influence a node has over the flow of information and is mathematically formulated as follows:
where \(u\) is a node, \(\sigma _{st}\) is the total number of shortest paths between nodes \(s\) and \(t\), and \(\sigma _{st}(u)\) is the number of shortest paths between nodes \(s\) and \(t\) that pass node \(u\). Betweenness centrality has been used to identify genes that have a high impact on leukemia patient survival7 and core regulators in breast cancer cells9. We calculated the betweenness centrality of every node (Supplementary Table S1). The three genes with the highest betweenness centrality are NCAPG2, PSMG3, and FADD.
In our study, we investigated the correlation between the number of genes that affect survival and the betweenness centrality. We divided the genes into 10 groups based on the deciles of the betweenness centrality. Then, we performed univariate Kaplan-Meier survival analysis for each gene (Supplementary Table S5). A gene with FDR-adjusted-\(P < 0.25\) is considered to significantly affect survival. We found a positive correlation (Spearman correlation coefficient \(\rho = 0.71\), \(P = 0.0275\)) between the number of genes that affect survival and the betweenness centrality (Fig. 5).
Methylation analysis
There were 1842 hypomethylated genes and 313 hypermethylated genes in our networks. Hypomethylated genes and probes were dominant in Communities 1, 2, 7, and 8, which regulate the cell cycle, keratinization, NRF2 pathway, and tRNA modification in the mitochondrion, respectively. In contrast, the hypermethylated genes and probes were dominant in Communities 3 (immune system), 4 (tube development and blood vessel morphogenesis), 6 (circulatory system development and extracellular matrix (ECM) organization), and 10 (cilium movement and organization) (Fig. 6).
When a group of DMCs acts as an enhancer or a silencer in a specific sample subset, this is often the result of an altered upstream master regulator transcription factor (TF)5. By using the get.enriched.motif and get.TFs functions in the ELMER package, we identified the enriched motifs and master regulators of methylation changes in LUSC. For the hypomethylated probes, the top enriched motifs were FOSL2, FOSB, FOSL1, and FOS. We identified ZNF74, TP63, KLF5, TFAP4, and ZFP64 as master regulator TFs of the hypomethylated genes. For the hypermethylated probes, ZBT14, E2F2, SP1, and SP2 were the top enriched motifs, and CREB3L1, CXXC5, and ETS1 were the master regulators. We also investigated the TFs for each community. Only communities that had at least 10 DMC probes connected to it were considered (Table 2). All of the top enriched motifs and master regulator TFs at the global and community levels are listed in Supplementary Tables S6 and S7, respectively.
Discussion
In this study, we performed network-based modeling to study the interaction between genomic and methylomic profiles in LUSC. Because the nature of the methylation and gene expression data are different, we used 2 different methods to reconstruct the DEG and DMC networks, which are the PIDC and ELMER algorithms, respectively. The PIDC and ELMER algorithms are well tested and have been used as network inference methods in many studies5,13,14.
Many network inference methods, such as GENIE315, partial correlation16, and SINCERITIES17, can also reconstruct DEG networks. However, we chose PIDC because it has a strong mathematical background, can detect noisy or nonlinear relationships, is reasonably fast, and does not need time series data to reconstruct gene networks13,18. The PIDC algorithm uses multivariate information measures to identify the relationship between genes. The information measurements can quantify the dependence between variables without making assumptions about the nature of the dependencies19. It is ideal for the noisy and nonlinear relationships that are usually seen in cancer transcriptomic datasets. PIDC divides the information between variables into redundant, unique, and synergistic categories. By doing so, PIDC can distinguish between unique information from a pair of variables within the group and redundant information shared by multiple variables18. The PIDC algorithm has been shown to have more accuracy, stability, and efficiency than other network inference methods13. The limitations of PIDC are that it does not provide information on the edge direction or the effect of the relationship (e.g., inhibitory or excitatory). We advise researchers who need edge direction and node sign information to use other network inference methods (e.g., GENIE3 for directed graphs or partial correlations for signed networks). In real-world clinical setting, the PIDC has been used to study the regulatory network of acute lymphoblastic leukaemia20, T-cell from SARS-CoV-2 patients21, and the breast cancers treated with endocrine therapy22.
ELMER uses methylation changes at cis-regulatory modules in tumors as the central hub of the DMC network. Then, correlation analysis is used to associate them with both upstream regulator TFs and downstream target genes23. Thus, ELMER can not only reconstruct the methylation network but also infer the master regulator TFs that bind to the methylation motif binding site. The ELMER algorithm has been used in some studies to investigate the methylation landscape of many cancers5,14. It has also been used in clinical and experimental study for transcription factor analysis in thyroid cancer24, squamous cell carcinoma25, meningioma26, and progeria syndrome27.
The integration was performed at the network level by performing graph union of the DEG and DMC networks. We performed community identification, centrality measurement, and gene set enrichment analysis to discover the relationship patterns in the integrated network.
The community detection analysis revealed the subnetwork communities, which have stronger interactions between nodes in the same community than nodes in different groups. Using functional enrichment analysis, we found that each community targeted specific biological processes or pathways. The DNA replication, cell cycle, ECM organization, and immune system pathways are common pathways altered in many cancers28. Keratinization, cilium organization, and surfactant metabolism are LUSC and lung cell characteristics. The complement-coagulation cascade pathway reflects the importance of complement in regulating the tumor microenvironment29,30 and the risk of coagulation disorder in LUSC31. We hypothesized that the genes in the major communities were heavily dysregulated in LUSC.
Another important finding is that 2 of 10 major communities are related to detoxification-related pathways: Community 5 with the glucuronidation pathway and Community 7 with the NRF2 and glutathione metabolism pathways. The glucuronidation and glutathione metabolism pathways are related to phase II enzymes for metabolizing xenobiotics32. The NRF2 pathways are master regulators of the antioxidant response33. The primary risk factor for cancer, smoking, may provide an explanation for the cause of altered detoxification-related pathways34. Altered detoxification-related pathways also contribute to increased drug resistance35,36.
The network visualization in Fig. 3 revealed how the different communities interact in LUSC. Then, we used the term Connection \(x-y\) to describe the interaction between Communities x and y. For example, we explored the relationship between Communities 2 and 7 or Connections 2-7. Community 2 affects keratinization, and Community 7 has roles in detoxification, such as the NRF2 and glutathione metabolism pathways. In Fig. 3, we can see that the position of Community 2 is very close to that of Community 7. The majority of intercommunity links (\(\pm 23\%\)) in Community 2 connect to Community 7. The converse is also true. Most of the Community 7 intercommunity links (\(\pm 34\%\)) connect to Community 2. This indicates the close interaction between the two communities. In a well-written review by Ishitsuka et al., they discussed the extensive importance of NRF2 in keratinization33. They stated that the KEAP1/NRF2 pathway plays important roles in the regulation of keratinization, squamous epithelial tissue external responses, and detoxification. Based on our findings, we hypothesized that the high number of edges in Connections 2-7 showed the dysregulation of the capability of lung epithelial cells to respond to external or toxic stimuli. This is supported by studies showing that NRF2 deficiency leads to chemical carcinogen susceptibility37 and that smoking alters the NRF2 and glutathione pathways34,38.
Another example is the interaction between Community 3 of the immune system, Community 4 of the complement-coagulation cascade, and Community 6 of ECM organization. The ratios \(C_3(4)\) and \(C_3(6)\) are 0.26 and 0.14, respectively. The complement system is one of the key actors in innate immunity and the coagulation system. On the other hand, immune system cells, such as tumor-associated macrophages (TAMs) and tumor-associated neutrophils (TANs), have major roles in reshaping the tumor ECM39,40. Many studies have been conducted to investigate ECM-immune cell-complement interactions in lung cancer. Complement C1q proteins can activate and recruit TAMs41. C9 is downregulated in alveolar TAMs, leading to lung cancer progression42. Macrophages can also regulate C3-independent C5a generation, which promotes squamous carcinogenesis43. Other studies on TANs showed that C5a could recruit TANs by stimulating the release of leukotriene B4 and the production of IL-144,45. It was also shown that C3aR-dependent neutrophil extracellular traps (NETs) could accumulate TANs46. Some studies have demonstrated that lung cancer cells have higher concentrations and expression of C3a and C5a than nonmalignant lung cells47,48.
The next step was to identify the highly connected nodes/genes or hub genes using centrality measurement. In graph theory, the removal of hub nodes in a network increases the proportion of unreachable groups of nodes compared with the removal of non-hub genes. Hence, hub nodes are important for maintaining the global network structure. In many organisms, the removal of hub genes is more likely to be lethal than the removal of non-hub genes. This is known as the centrality-lethality rule49,50. Examples of centrality measurements are degree centrality, closeness centrality, and betweenness centrality. Studies have shown that betweenness centrality and degree centrality are better than closeness centrality for identifying hub genes9,51. We counted the number of genes that significantly affect survival within each decile of betweenness centrality. We used FDR-adjusted-\(P < 0.25\) as the rejection threshold of the survival analysis. This is because we want to find the relevant genes that have modest survival differences relative to the noise inherent to the gene expression data. We found a positive correlation between the number of genes that affect the survival and the betweenness centrality (Fig. 5). This result supports the centrality-lethality rule. The expressions of the genes with high betweenness centrality in our network are more likely to affect the survival of the LUSC patient than those with low betweenness centrality.
NCAPG2, PSMG3, and FADD were the three genes with the highest betweenness centrality in our integrated network. The NCAPG2 protein is a subunit of the condensin II complex, which has roles in mitotic chromosome assembly and segregation. The upregulation of NCAPG2 promotes the proliferation of lung cancer cells52. PSMG3 is a chaperone protein that promotes the assembly of the 20S proteasome. To the authors’ knowledge, no papers have investigated the effect of PSMG3 dysregulation on LUSC. However, the antisense long noncoding RNA of PSMG3, PSMG3-AS1, is highly expressed in LUSC, and its inhibition reduces invasiveness53. In our study, we found that the expression of PSMG3 was significantly associated with the patient survival (Supplementary Table S5). Fas-associated death domain protein (FADD) transmits the apoptotic signal delivered by death receptors. The release of FADD by non-small cell lung cancer cells is correlated with aggressiveness and metastasis54. MYADM is another gene that was found to have high betweenness centrality and to be associated with survival in our study. MYADM had the smallest P value in the Kaplan-Meier survival analysis in the top 10th percentile of genes by betweenness centrality. It regulates the connection between the plasma membrane and the cortical cytoskeleton in the endothelial inflammatory response55. It also contributes to smooth muscle alteration in pulmonary artery hypertension and tuberculosis tracheobronchial stenosis56,57. However, its roles in lung cancer are not well studied. Further study of PSMG3 and MYADM may lead to them becoming potential LUSC prognostic markers or therapeutic targets in the future.
The methylation analysis of the network showed that the hypomethylated probes targeted the cell cycle (Community 1), the NRF2 and glutathione metabolism pathways (Community 7), keratinization (Community 2), and tRNA modification in the mitochondrial pathway (Community 8). The upregulation of these pathways has been linked to invasiveness, therapy resistance, smoking, and poor prognosis in many studies28,34,36,58,59. In contrast, the hypermethylated DMC probes downregulated pathways related to cancer inhibition and normal development/differentiation of tissue, such as the immune system (Community 3), tube development and blood vessel morphogenesis (Community 4), circulatory system development and ECM organization (Community 6), and cilium organization (Community 10).
The gain (for hypomethylated probes) or loss (for hypermethylated probes) of master regulator TFs can change the methylation status of DMCs. We used the ELMER package to identify these upstream master regulator TFs. In our study, we found that TP63, KLF5, and SOX2 were overexpressed and became the top TFs for hypomethylated probes at both the global and community levels. This result is supported by a previous chromatin immunoprecipitation sequencing study that found that TP63, SOX2, and KLF5 were core regulators that determined chromatin accessibility, epigenetic modifications, and gene expression patterns in esophageal squamous cell carcinoma60. In contrast, we found that the suppressed expression of CXXC5 and FOXP1 acted as regulators of hypermethylation. CXXC5 is a nuclear zinc-finger protein comprising DNA methyltransferases, DNA demethylases, histone methyltransferases, and histone demethylases that contributes to transcriptional regulation by preferentially binding to unmethylated CpG islands61. CXXC5 is a negative-feedback regulator of the Wnt/beta-catenin pathway62 and an inhibitor of liver cancer that promotes TGF-beta-induced cell cycle arrest63; moreover, it is required for DNA damage-induced p53 activation64. FOXP1 is a TF that belongs to the P subfamily of the forkhead box family. FOXP1 is a prostate cancer suppressor that regulates androgen receptor and FOXA165. FOXP1 is also associated with improved survival in lung cancer66.
Taken together, all the findings of our study suggest that integrating the DMC network and DEG network has the potential to reveal complex interactions between genes and their regulators (e.g., TFs and methylated cytosines). Our analysis workflow can be used not only in LUSC but also in other cancers and diseases. We believe that a deeper understanding of the global organizational structure of the gene regulatory network will assist in LUSC diagnosis and therapeutic management.
Methods
We computationally reconstructed the DEG network and DMC network in LUSC using the PIDC18 and ELMER algorithms23, respectively. Then, we combined the DEG and DMC networks and extracted the giant component of the graph. This graph consists of nodes that represent genes or methylation probes and undirected edges that represent the regulatory connections.
Lung cancer datasets preparation
The HTSeq-FPKM-UQ gene expression data of 502 LUSC primary tumor samples and 49 normal tissue samples were downloaded from the NCI Genomic Data Commons (GDC) data portal using the Bioconductor package TCGAbiolinks67. The gene expression data were processed using the TCGAbiolinks workflow from Silva et al.68. In short, we removed outliers, failed hybridizations, or mistracked samples by performing Array-Array Intensity Correlation using the TCGAanalyze_Preprocessing function. Next, we normalized mRNA transcripts and filtered genes with low signal across samples using the TCGAanalyze_Normalization and TCGAanalyze_Filtering functions, respectively. We selected the genes that were differentially expressed twofold by TCGA analysis_DEA. Then, we performed \(log(1+x)\) transformation and standardization of the expression of the selected genes.
TCGA level 3 DNA methylation data based on the Illumina Infinium HumanMethylation450 (HM450) BeadArray platform from the same sample were downloaded using the getTCGA function in the ELMER package23.
Networks reconstruction
We used the PIDC algorithm to reconstruct the DEG network. In PIDC, we examined every gene triplet, for example, \(Source_1\), \(Source_2\), and Target. The PIDC algorithm divides the information between \(Source_1\) and Target into three categories: redundant, unique, and synergistic. Redundant information is the portion of information about Target that either \(Source_1\) or \(Source_2\) can provide. The unique information is uniquely contributed from \(Source_1\) or \(Source_2\) only. The synergistic information is the portion of information from both \(Source_1\) and \(Source_2\). Then, the direct functional relationship between \(Source_1\) and Target is calculated by using the mean proportion of the unique information between \(Source_1\) and Target over all \(Source_2\)18.
We used the PIDC algorithm implemented in the package NetworkInference.jl18. The Bayesian blocks algorithm and maximum likelihood were used as the discretizer algorithm and estimator parameter, respectively. It returns all possible edges between genes and their ranks. Finally, a DEG network was defined by keeping the highest 1% of ranked edges from the PIDC algorithm results.
DMC network reconstruction was performed using the ELMER package. ELMER network reconstruction has 3 main steps:
-
1.
Identifying distal methylation probes on the HM450 platform,
-
2.
Selecting distal probes with significantly different DNA methylation levels between normal and tumor groups (i.e., both hypermethylation and hypomethylation),
-
3.
Connect putative target genes and their DMC probes.
This process will return the probe-gene pairs that have a significant (adjusted-\(P < 0.01\)) inverse correlation between the methylation of the probe and the expression of the gene.
Motif and transcription factor identification
To identify TFs that act as upstream master regulators by binding to TF binding motif DNA methylation, we performed two additional steps:
-
1.
Identify enriched motifs in the differentially methylated probes and
-
2.
Identify regulatory TFs whose expression is associated with TF binding motif DNA methylation
We performed all the steps from DMC network reconstruction until TF identification using the TCGA.pipe function on unsupervised modes in the ELMER package.
Networks integration
To combine the DMC and DEG networks, we performed a graph union operation. Thus, the vertices and edges in the integrated network are the union of the vertices and edges from the DMC and DEG networks. Then, we extracted the subgraph that has the largest number of connected components or the giant component of the graph.
Network analysis
We performed community identification, gene set enrichment analysis, and betweenness centrality measurement on the integrated network. Community detection of the network was performed using the Leiden algorithm10 through the Python package leidenalg (https://github.com/vtraag/leidenalg). In this function, we used CPMVertexPartition as the objective function parameter and 0.0085 as the value of the resolution parameter. The gene set enrichment analysis of each of the communities was performed using g:Profiler69. We used Kyoto Encyclopedia of Genes and Genomes, Reactome, WikiPathways, and Gene Ontology (molecular function, cellular component, and biological process) as data sources in g:Profiler. The betweenness centrality was calculated using the package Graph.jl70. We used the g:SCS algorithm to adjust the P value in gene set enrichment analysis. The g:SCS method is the default method in g:Profiler for computing multiple testing correction11.
To analyze the intercommunity interactions, we visualized the network in Gephi using ForceAtlas2 as a network layout algorithm12,71. Then, we calculated a ratio \(C_x(y)\), which measures the proportion of the links that are connected between Source Community x and Target Community y to the total of the links on Source Community x that are not connected to the Source Community itself (e.g., intercommunity links). It is formulated as follows:
where \(L_x(y)\) is the number of links that connect Community x and Community y. By definition, \(L_x(y)\) is equal to \(L_y(x)\). The denominator of \(C_x(y)\) is the sum of the number of links that connected Community x to other communities except Community x itself.
We performed network randomization tests to determine whether the ratio \(C_x(y)\) occurs by random chance. The steps of the network randomization tests are shown in Algorithm 1
We then performed the one-sample t test on the observed \(C_{x}(y)\) and the \(C_{x}(y)\) from the network randomization procedure. We adjusted the P values using Bonferroni correction.
Survival analysis
We split the genes into 10 equal groups based on the deciles of the betweenness centrality. Then, we performed univariate Kaplan-Meier survival analysis for each gene. We used the 33th-percentile and 67th-percentile as the quantile threshold to identify samples with low and high expression of a gene. We used TCGAanalyze_SurvivalKM in the TCGAbiolinks package to perform survival analysis. The false discovery rate (FDR) was computed to correct for multiple hypothesis testing, and the result was only accepted as significant in the case of FDR-adjusted \(P < 0.25\). We counted the number of the significant genes in each group. Spearman correlation test was performed to find the correlation between the number of significant genes and the betweenness centrality.
The source code to perform and replicate all analyses in our study is available at the GitHub repository (https://github.com/yusri-dh/LUSC_integrated_network/).
Data availability
We downloaded the publicly available LUSC dataset in: The National Cancer Institute (NCI) Genomic Data Commons (GDC) TCGA https://gdc.cancer.gov/access-data/gdc-data-portal by using TCGAbiolinks and ELMER package.
References
Lewis, D. R., Check, D. P., Caporaso, N. E., Travis, W. D. & Devesa, S. S. US lung cancer trends by histologic type. Cancer 120, 2883–2892. https://doi.org/10.1002/cncr.28749 (2014).
Kumar, V., Abbas, A. K. & Aster, J. C. Robbins & Cotran Pathologic Basis of Disease 10th edn. (Elsevier, Philadelphia, PA, 2021).
Network, T. C. G. A. R. Comprehensive genomic characterization of squamous cell lung cancers. Nature 489, 519–525. https://doi.org/10.1038/nature11404 (2012).
Perez-Moreno, P., Brambilla, E., Thomas, R. & Soria, J.-C. Squamous cell carcinoma of the lung: Molecular subtypes and therapeutic opportunities. Clin. Cancer Res. 18, 2443–2451. https://doi.org/10.1158/1078-0432.ccr-11-2370 (2012).
Yao, L., Shen, H., Laird, P. W., Farnham, P. J. & Berman, B. P. Inferring regulatory element landscapes and transcription factor networks from cancer methylomes. Genome Biol.https://doi.org/10.1186/s13059-015-0668-3 (2015).
Yuan, G. et al. Elevated NSD3 histone methylation activity drives squamous cell lung cancer. Nature 590, 504–508. https://doi.org/10.1038/s41586-020-03170-y (2021).
Sanchez, R. & Mackenzie, S. A. Integrative network analysis of differentially methylated and expressed genes for biomarker identification in leukemia. Sci. Rep.https://doi.org/10.1038/s41598-020-58123-2 (2020).
Li, J., Zhang, Q., Chen, Z., Xu, D. & Wang, Y. A network-based pathway-extending approach using DNA methylation and gene expression data to identify altered pathways. Sci. Rep.https://doi.org/10.1038/s41598-019-48372-1 (2019).
Narang, V. et al. Automated identification of core regulatory genes in human gene regulatory networks. PLOS Comput. Biol. 11, e1004504. https://doi.org/10.1371/journal.pcbi.1004504 (2015).
Traag, V. A., Waltman, L. & van Eck, N. J. From Louvain to Leiden: Guaranteeing well-connected communities. Sci. Rep.https://doi.org/10.1038/s41598-019-41695-z (2019).
Reimand, J., Kull, M., Peterson, H., Hansen, J. & Vilo, J. g:Profiler—a web-based toolset for functional profiling of gene lists from large-scale experiments. Nucleic Acids Res. 35, W193–W200. https://doi.org/10.1093/nar/gkm226 (2007).
Jacomy, M., Venturini, T., Heymann, S. & Bastian, M. ForceAtlas2, a continuous graph layout algorithm for handy network visualization designed for the Gephi software. PLoS One 9, e98679. https://doi.org/10.1371/journal.pone.0098679 (2014).
Pratapa, A., Jalihal, A. P., Law, J. N., Bharadwaj, A. & Murali, T. M. Benchmarking algorithms for gene regulatory network inference from single-cell transcriptomic data. Nat. Methods 17, 147–154. https://doi.org/10.1038/s41592-019-0690-6 (2020).
Corces, M. R. et al. The chromatin accessibility landscape of primary human cancers. Sciencehttps://doi.org/10.1126/science.aav1898 (2018).
Huynh-Thu, V. A., Irrthum, A., Wehenkel, L. & Geurts, P. Inferring regulatory networks from expression data using tree-based methods. PLoS One 5, e12776. https://doi.org/10.1371/journal.pone.0012776 (2010).
Kim, S. Ppcor: An R package for a fast calculation to semi-partial correlation coefficients. Commun. Stat. Appl. Methods 22, 665–674 (2015).
Papili Gao, N., Ud-Dean, S. M. M., Gandrillon, O. & Gunawan, R. SINCERITIES: Inferring gene regulatory networks from time-stamped single cell transcriptional expression profiles. Bioinformatics 34, 258–266 (2018).
Chan, T. E., Stumpf, M. P. & Babtie, A. C. Gene regulatory network inference from single-cell data using multivariate information measures. Cell Syst. 5, 251-267.e3. https://doi.org/10.1016/j.cels.2017.08.014 (2017).
Mahon, S. S. M. et al. Information theory and signal transduction systems: From molecular information processing to network inference. Semin. Cell Dev. Biol. 35, 98–108. https://doi.org/10.1016/j.semcdb.2014.06.011 (2014).
Koldobskiy, M. A. et al. Converging genetic and epigenetic drivers of paediatric acute lymphoblastic leukaemia identified by an information-theoretic analysis. Nat. Biomed. Eng. 5, 360–376. https://doi.org/10.1038/s41551-021-00703-2 (2021).
Wu, D., Zhang, R. & Datta, S. Unraveling T cell responses for long term protection of SARS-CoV-2 infection. Front. Genet.https://doi.org/10.3389/fgene.2022.871164 (2022).
Hong, S. P. et al. Single-cell transcriptomics reveals multi-step adaptations to endocrine therapy. Nat. Commun. 10, 3840. https://doi.org/10.1038/s41467-019-11721-9 (2019).
Silva, T. C. et al. ELMER vol 2: An r/bioconductor package to reconstruct gene regulatory networks from DNA methylation and transcriptome profiles. Bioinformatics 35, 1974–1977. https://doi.org/10.1093/bioinformatics/bty902 (2018).
Ravi, N., Yang, M., Mylona, N., Wennerberg, J. & Paulsson, K. Global RNA expression and DNA methylation patterns in primary anaplastic thyroid cancer. Cancershttps://doi.org/10.3390/cancers12030680 (2020).
Huang, Y. et al. Activation of bivalent factor DLX5 cooperates with master regulator TP63 to promote squamous cell carcinoma. Nucleic Acids Res. 49, 9246–9263. https://doi.org/10.1093/nar/gkab679 (2021).
Nassiri, F. et al. A clinically applicable integrative molecular classification of meningiomas. Nature 597, 119–125. https://doi.org/10.1038/s41586-021-03850-3 (2021).
Köhler, F. et al. Epigenetic deregulation of lamina-associated domains in Hutchinson-Gilford progeria syndrome. Genome Med. 12, 46. https://doi.org/10.1186/s13073-020-00749-y (2020).
Hanahan, D. & Weinberg, R. A. Hallmarks of cancer: The next generation. Cell 144, 646–674. https://doi.org/10.1016/j.cell.2011.02.013 (2011).
Kleczko, E. K., Kwak, J. W., Schenk, E. L. & Nemenoff, R. A. Targeting the complement pathway as a therapeutic strategy in lung cancer. Front. Immunol.https://doi.org/10.3389/fimmu.2019.00954 (2019).
Zhang, R., Liu, Q., Li, T., Liao, Q. & Zhao, Y. Role of the complement system in the tumor microenvironment. Cancer Cell Int.https://doi.org/10.1186/s12935-019-1027-3 (2019).
Tagalakis, V. et al. High risk of deep vein thrombosis in patients with non-small cell lung cancer: A cohort study of 493 patients. J. Thorac. Oncol. 2, 729–734. https://doi.org/10.1097/jto.0b013e31811ea275 (2007).
Castell, J. V., Donato, M. T. & Gómez-Lechón, M. J. Metabolism and bioactivation of toxicants in the lung. The in vitro cellular approach. Exp. Toxicol. Pathol. 57, 189–204. https://doi.org/10.1016/j.etp.2005.05.008 (2005).
Ishitsuka, Y., Ogawa, T. & Roop, D. The KEAP1/NRF2 signaling pathway in keratinization. Antioxidants 9, 751. https://doi.org/10.3390/antiox9080751 (2020).
Müller, T. & Hengstermann, A. NRF2: Friend and foe in preventing cigarette smoking-dependent lung disease. Chem. Res. Toxicol. 25, 1805–1824. https://doi.org/10.1021/tx300145n (2012).
Niture, S. K. & Jaiswal, A. K. Nrf2 protein up-regulates antiapoptotic protein Bcl-2 and prevents cellular apoptosis. J. Biol. Chem. https://doi.org/10.1074/jbc.m111.312694 (2012).
Traverso, N. et al. Role of glutathione in cancer progression and chemoresistance. Oxid. Med. Cell. Longev. 1–10, 2013. https://doi.org/10.1155/2013/972913 (2013).
Xu, C. et al. Inhibition of 7, 12-Dimethylbenz(a)anthracene-induced skin tumorigenesis in C57BL/6 mice by sulforaphane is mediated by nuclear factor e2–related factor 2. Cancer Res. 66, 8293–8296. https://doi.org/10.1158/0008-5472.can-06-0300 (2006).
Gould, N. S., Min, E., Gauthier, S., Martin, R. J. & Day, B. J. Lung glutathione adaptive responses to cigarette smoke exposure. Respir. Res.https://doi.org/10.1186/1465-9921-12-133 (2011).
Madsen, D. H. et al. Tumor-associated macrophages derived from circulating inflammatory monocytes degrade collagen through cellular uptake. Cell Rep. 21, 3662–3671. https://doi.org/10.1016/j.celrep.2017.12.011 (2017).
Deryugina, E. I. et al. Tissue-infiltrating neutrophils constitute the major in vivo source of angiogenesis-inducing MMP-9 in the tumor microenvironment. Neoplasia 16, 771–788. https://doi.org/10.1016/j.neo.2014.08.013 (2014).
Benoit, M. E., Clarke, E. V., Morgado, P., Fraser, D. A. & Tenner, A. J. Complement protein c1q directs macrophage polarization and limits inflammasome activity during the uptake of apoptotic cells. J. Immunol. 188, 5682–5693. https://doi.org/10.4049/jimmunol.1103760 (2012).
Li, L. et al. Hypoxia restrains the expression of complement component 9 in tumor-associated macrophages promoting non-small cell lung cancer progression. Cell Death Discov.https://doi.org/10.1038/s41420-018-0064-3 (2018).
Medler, T. R. et al. Complement C5a fosters squamous carcinogenesis and limits T cell response to chemotherapy. Cancer Cell 34, 561-578.e6. https://doi.org/10.1016/j.ccell.2018.09.003 (2018).
Allendorf, D. J. et al. C5a-mediated leukotriene b4-amplified neutrophil chemotaxis is essential in tumor immunotherapy facilitated by anti-tumor monoclonal antibody and \(\upbeta\)-glucan. J. Immunol. 174, 7050–7056. https://doi.org/10.4049/jimmunol.174.11.7050 (2005).
Khameneh, H. J. et al. C5a regulates IL-1\(\upbeta\) production and leukocyte recruitment in a murine model of monosodium urate crystal-induced peritonitis. Front. Pharmacol.https://doi.org/10.3389/fphar.2017.00010 (2017).
Guglietta, S. et al. Coagulation induced by C3aR-dependent NETosis drives protumorigenic neutrophils during small intestinal tumorigenesis. Nat. Commun.https://doi.org/10.1038/ncomms11037 (2016).
Corrales, L. et al. Anaphylatoxin C5a creates a favorable microenvironment for lung cancer progression. J. Immunol. 189, 4674–4683. https://doi.org/10.4049/jimmunol.1201654 (2012).
Kwak, J. W. et al. Complement activation via a c3a receptor pathway alters CD4+ t lymphocytes and mediates lung cancer progression. Cancer Res. 78, 143–156. https://doi.org/10.1158/0008-5472.can-17-0240 (2017).
Jeong, H., Mason, S. P., Barabási, A.-L. & Oltvai, Z. N. Lethality and centrality in protein networks. Nature 411, 41–42. https://doi.org/10.1038/35075138 (2001).
He, X. & Zhang, J. Why do hubs tend to be essential in protein networks?. PLoS Genet. 2, e88. https://doi.org/10.1371/journal.pgen.0020088 (2006).
Raman, K., Damaraju, N. & Joshi, G. K. The organisational structure of protein networks: revisiting the centrality–lethality hypothesis. Syst. Synth. Biol. 8, 73–81. https://doi.org/10.1007/s11693-013-9123-5 (2013).
Zhan, P. et al. NCAPG2 promotes tumour proliferation by regulating G2/M phase and associates with poor prognosis in lung adenocarcinoma. J. Cell. Mol. Med. 21, 665–676. https://doi.org/10.1111/jcmm.13010 (2016).
Jin, E. et al. Expression of oncogenic long noncoding RNA PSMG3-antisense 1 in lung squamous cell carcinoma. Oncol. Lett.https://doi.org/10.3892/ol.2021.13012 (2021).
Cimino, Y. et al. FADD protein release mirrors the development and aggressiveness of human non-small cell lung cancer. Br. J. Cancer 106, 1989–1996. https://doi.org/10.1038/bjc.2012.196 (2012).
Aranda, J. F. et al. MYADM controls endothelial barrier function through ERM-dependent regulation of ICAM-1 expression. Mol. Biol. Cell 24, 483–494. https://doi.org/10.1091/mbc.E11-11-0914 (2013).
Sun, L. et al. miR-182-3p/MYADM contribute to pulmonary artery hypertension vascular remodeling via a klf4/p21-dependent mechanism. Theranostics 10, 5581–5599. https://doi.org/10.7150/thno.44687 (2020).
Peng, B. et al. Proteomic profiling of biomarkers by maldi-tof mass spectrometry for the diagnosis of tracheobronchial stenosis after tracheobronchial tuberculosis. Exp. Ther. Med.https://doi.org/10.3892/etm.2020.9495 (2020).
Park, H. J. et al. Keratinization of lung squamous cell carcinoma is associated with poor clinical outcome. Tuberc. Respir. Dis. 80, 179. https://doi.org/10.4046/trd.2017.80.2.179 (2017).
Huang, S. et al. The dysregulation of tRNAs and tRNA derivatives in cancer. J. Exp. Clin. Cancer Res.https://doi.org/10.1186/s13046-018-0745-z (2018).
Jiang, Y.-Y. et al. TP63, SOX2, and KLF5 establish a core regulatory circuitry that controls epigenetic and transcription patterns in esophageal squamous cell carcinoma cell lines. Gastroenterology 159, 1311-1327.e19. https://doi.org/10.1053/j.gastro.2020.06.050 (2020).
Long, H. K., Blackledge, N. P. & Klose, R. J. ZF-CxxC domain-containing proteins, CpG islands and the chromatin connection. Biochem. Soc. Trans. 41, 727–740. https://doi.org/10.1042/bst20130028 (2013).
Kim, H.-Y. et al. CXXC5 is a negative-feedback regulator of the wnt/\(\upbeta\)-catenin pathway involved in osteoblast differentiation. Cell Death Differ. 22, 912–920. https://doi.org/10.1038/cdd.2014.238 (2015).
Yan, X. et al. CXXC5 suppresses hepatocellular carcinoma by promoting TGF-\(\upbeta\)-induced cell cycle arrest and apoptosis. J. Mol. Cell Biol. 10, 48–59. https://doi.org/10.1093/jmcb/mjx042 (2017).
Zhang, M. et al. The CXXC finger 5 protein is required for DNA damage-induced p53 activation. Sci. China Ser. C Life Sci. 52, 528–538. https://doi.org/10.1007/s11427-009-0083-7 (2009).
Takayama, K. I. et al. Integrative analysis of FOXP1 function reveals a tumor-suppressive effect in prostate cancer. Mol. Endocrinol. 28, 2012–2024. https://doi.org/10.1210/me.2014-1171 (2014).
Feng, J. et al. High expression of FoxP1 is associated with improved survival in patients with non–small cell lung cancer. Am. J. Clin. Pathol. 138, 230–235. https://doi.org/10.1309/ajcpdhqfnyjz01yg (2012).
Colaprico, A. et al. TCGAbiolinks: An r/bioconductor package for integrative analysis of TCGA data. Nucleic Acids Res. 44, e71–e71. https://doi.org/10.1093/nar/gkv1507 (2015).
Silva, T. C. et al. (2016) TCGA workflow: Analyze cancer genomics and epigenomics data using bioconductor packages. F1000Research 5: 1542, https://doi.org/10.12688/f1000research.8923.2
Raudvere, U. et al. g:profiler: A web server for functional enrichment analysis and conversions of gene lists (2019 update). Nucleic Acids Res. 47, W191–W198. https://doi.org/10.1093/nar/gkz369 (2019).
Fairbanks, J. et al. Juliagraphs//graphs.jl: An optimized graphs package for the julia programming language. https://github.com/JuliaGraphs/Graphs.jl (2021).
Bastian, M., Heymann, S. & Jacomy, M. Gephi: An open source software for exploring and manipulating networks (2009).
Author information
Authors and Affiliations
Contributions
Y.D.H. was responsible for the study conceptualization, the data curation, analyses, and visualization, and writing the original draft of the manuscript. K.K. was responsible for the study conceptualization, supervision, and editing the manuscript. S.I. was responsible for the funding acquisition, project administration, supervision, and editing the manuscript. All authors reviewed the manuscript.
Corresponding author
Ethics declarations
Competing interests
The authors declare no competing interests.
Additional information
Publisher's note
Springer Nature remains neutral with regard to jurisdictional claims in published maps and institutional affiliations.
Rights and permissions
Open Access This article is licensed under a Creative Commons Attribution 4.0 International License, which permits use, sharing, adaptation, distribution and reproduction in any medium or format, as long as you give appropriate credit to the original author(s) and the source, provide a link to the Creative Commons licence, and indicate if changes were made. The images or other third party material in this article are included in the article's Creative Commons licence, unless indicated otherwise in a credit line to the material. If material is not included in the article's Creative Commons licence and your intended use is not permitted by statutory regulation or exceeds the permitted use, you will need to obtain permission directly from the copyright holder. To view a copy of this licence, visit http://creativecommons.org/licenses/by/4.0/.
About this article

Cite this article
Heryanto, Y.D., Katayama, K. & Imoto, S. Analyzing integrated network of methylation and gene expression profiles in lung squamous cell carcinoma. Sci Rep 12, 15799 (2022). https://doi.org/10.1038/s41598-022-20232-5
Received:
Accepted:
Published:
DOI: https://doi.org/10.1038/s41598-022-20232-5
Comments
By submitting a comment you agree to abide by our Terms and Community Guidelines. If you find something abusive or that does not comply with our terms or guidelines please flag it as inappropriate.
