
Abstract
Staphylococcus aureus adapts to different environments by sensing and responding to diverse environmental cues. The responses are coordinately regulated by regulatory proteins, and small regulatory RNAs at the transcriptional and translational levels. Here, we characterized teg58, a SarA repressed sRNA, using ChIP-Seq and RNA-Seq analysis of a sarA mutant. Phenotypic and genetic analyses indicated that inactivation of teg58 led to reduced biofilm formation in a process that is independent of SarA, agr, PIA, and PSMs. RNA-Seq analysis of teg58 mutant revealed up-regulation of arginine biosynthesis genes (i.e., argGH) as well as the ability of the mutant to grow in a chemical defined medium (CDM) lacking l-arginine. Exogenous l-arginine or endogenous induction of argGH led to decreased biofilm formation in parental strains. Further analysis in vitro and in vivo demonstrated that the specific interaction between teg58 and the argGH occurred at the post-transcriptional level to repress arginine synthesis. Biochemical and genetic analyses of various arginine catabolic pathway genes demonstrated that the catabolic pathway did not play a significant role in reduced biofilm formation in the teg58 mutant. Overall, results suggest that teg58 is a regulatory sRNA that plays an important role in modulating arginine biosynthesis and biofilm formation in S. aureus.
Introduction
Staphylococcus aureus is the causative agent of numerous infections ranging from minor skin conditions to fatal systemic syndromes1. Its ability to cause extensive infections relies on an extensive arsenal of virulence and metabolic factors to facilitate each of the pathogenic steps including adherence, growth, mature biofilm formation and dispersal1,2,3. Expression of these factors are mediated by two-component regulatory systems, transcriptional regulators, and riboswitches/small regulatory RNAs (sRNAs)4,5,6.
sRNAs have emerged in the past decade as important players in the post-transcriptional regulation of target genes, enabling rapid environmental adaptation via posttranscriptional processing (e.g., mRNA stability and translation) as opposed to induced transcription via transcription factors7,8 which is a slower process. In contrast to Gram-negative bacteria, the RNA chaperone Hfq9 is not required for sRNA-dependent regulations in S. aureus10,11,12.
There are more than 300 potential sRNAs in S. aureus genomes, identified mainly by RNA-Seq13,14,15. The best described sRNA in S. aureus is RNAIII, a dual-function sRNA which, at 514-nt long, codes for delta toxin as well as functions as a sRNA that binds target mRNAs to promote mRNA degradation (e.g., for spa and coa, sbi, ltaS, lytM, rot and other mRNAs) or improve translation (e.g., hla, map, mgrA)7,16,17. RsaE has been shown to down-regulate several genes including direct interaction with arginase rocF mRNA, which is associated with arginine catabolism18. Not surprisingly, additional sRNAs were found (e.g., Teg27, sprC, Teg10, RasI, RsaD, sprX2, Teg41) to regulate assorted target mRNAs19,20,21,22,23,24 but their roles in biofilm formation have not been defined except for RsaI22.
Infections attributable to S. aureus biofilms are difficult to treat due to reduced efficacy of host innate immune defense, barrier to antibiotic penetration, and slower cellular growth vs. their planktonic counterparts25,26,27. Biofilm can be divided into different developmental stages including attachment, aggregation, maturation, and detachment28. While past studies have focused on adhesins (e.g., Aap, Fnb, SasG, Spa, ClfB, to name a few)25,26,27, biofilm matrix structures [PIA encoded by the icaADBC genes and regulated by IcaR, SarA, and other regulators)]28,29, biofilm maturation (secreted proteins and eDNA release)30 and dispersal [protease, nuclease, PSM (surfactant) and dispersin B]25,26,27, the role of metabolic factors on biofilm formation in S. aureus has not been well studied.
Arginine is one of the important amino acids, which can be utilized as an energy source and building blocks in protein synthesis31. Arginine was found to inhibit biofilm formation in several bacteria, possibly by neutralizing acidic pH, and/or inhibiting co-aggregation of cells32,33,34. In S. aureus, the primary pathway for synthesis of l-arginine from glutamate or proline via citrulline metabolism entails two genes, argG and argH, transcribed monocistronically. In contrast, catabolism of arginine entails several pathways (Fig. 1A): the deiminase pathway encompassing mostly ArcA and ArcB whereby arginine can be converted to l-citrulline35,36,37,38,39 and the arginase pathway where RocF (arginase) catalyzes the conversion of l-arginine to urea and l-ornithine, which can be converted to l-citrulline by ArgF. l-citrulline can be catabolized back to l-ornithine by ArcB. l-ornithine, which eventually generates l-glutamate by RocD and RocA, feeds to the TCA cycle39. Although, the predominant pathway for l-arginine catabolism in S. aureus is not well understood, several genes of the catabolism pathway are regulated by the carbon catabolite repressor (CcpA)36,37.

Characterization of sRNA teg58. (A) Putative arginine synthesis and catabolic pathways in S. aureus. Adopted from Ibberson &Whiteley39. CIT, citrulline; Arg-Suc, arginosuccinate; ORN, ornithine. (B) Normalized occupancy profile for SarA peak located between sRNA teg58 (srn_2460) and Saouhsc_01110 open reading frame as analyzed by using CLC Genomics Workbench 11. Arrows indicated the direction of the genes or sRNA. (C) Nucleotide sequence of the teg58 region was shown and marked, indicating putative promoter region, start site as derived from primer extension data, transcriptional terminator and translational stop sequences (red) of the up- and down-stream genes. The ChIP-Seq motif and published SarA binding operator sequences40 is in the same region as marked by red underline. Green and yellow marking indicate the potential interaction sites of argG and argH mRNAs/genes, respectively, with teg58 as determined by Freiburg IntaRNA Tools41.
In this study, we characterized the sRNA teg58 by analyzing ChIP-Seq and RNA-Seq results of a sarA mutant40. Genetic analysis revealed teg58 to be repressed by SarA. Biofilm formation is significantly decreased in the teg58 mutant in a manner independent of agr, SarA as well as matrix-related components PIA. RNA-Seq analysis of the teg58 mutant revealed increased argGH transcription vs. the parent. Northern blots, growth analysis in chemically defined medium42 (CDM) with and without arginine, and mutagenesis studies involving teg58 and argGH mRNA as well as half-life studies of argGH mRNA demonstrated that the sRNA-mRNA interaction is specific that affected production of arginine. Genetic and phenotypic analysis of genes in the arginine catabolic pathway suggested that these genes are not significantly involved in teg58-mediated biofilm formation in S. aureus. Collectively, our data provided the molecular linkage of sRNA teg58 to repression of argGH, leading to biofilm formation in S. aureus.
Results
Characterization of sRNA teg58 (srn_2460) in S. aureus
To characterize sRNA directly regulated by SarA, we have performed ChIP-Seq analysis with anti-SarA and anti-Myc antibodies using cell extracts of a sarA mutant of HG003 harboring pSK23643::sarA-myc, followed by pulldown with Protein A-Sepharose to yield SarA-DNA complexes40. One of the pull-down fragments identified was a DNA fragment upstream of teg58 with a peak shape score of 46.0 and the p-value of 0.00 (Fig. 1B). In addition, RNA-Seq of isogenic sarA mutant strains revealed increase in teg58 transcript in sarA mutant vs. respective parent (2.41-fold)40. Primer extension and 3´ RACE experiments were performed to map 5′- and 3′-ends of teg58 with total RNAs isolated from isogenic sarA strains (Fig. S1B for 3′-RACE), showing the sRNA to be 165-nt long (Fig. 1C). Further analysis revealed no well-defined ribosome binding site and coding region within the teg58 transcript, consistent with a non-coding sRNA (Fig. 1C). Teg58, located in the intergenic region at the 3’ end of a gene cluster encoding putative virulence factors (Fig. S1A), is conserved in multiple S. aureus genomes.
SarA repressed sRNA teg58 transcription
For subsequent analysis, we have selected two different strain backgrounds, MRSA JE2 and MSSA SH1000. Northern blot analysis (Fig. 2A) showed increased teg58 transcript level, ~ 4.9-fold increase at exponential and 11.6-fold increase at early post-exponential phases in the sarA mutant vs. the wild type while the level was restored to near parental level upon complementation with the shuttle plasmid pSK236::P1sarA, consistent with repression of teg58 transcription by the sarA gene. Quantitative promoter activity of teg58 fused to GFP fluorescence44 at the various phases of growth in assorted strains (only shown for the post-exponential phase of growth in Fig. 2B) confirmed northern analysis data. Gel shift assay demonstrated that SarA bound specifically to the teg58 promoter region since unlabeled teg58 fragment competed out binding to the labeled DNA, while non-specific 16S promoter fragment did not (Fig. 2C). The calculated binding affinity45 (Kd = [protein)50% of DNA bound] of SarA to the teg58 promoter fragment was approximately 0.7 × 10⁻⁶ M, indicating high binding affinity. Together, these results clearly demonstrated repression of teg58 transcription by SarA.
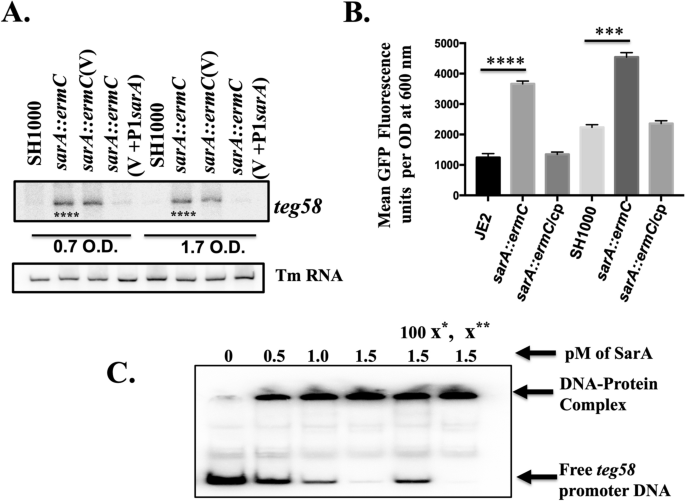
SarA repressed teg58. (A) Northern blot analysis of various strains as indicated. 15 μg of total cellular RNA was loaded to each lane. Tm RNA (NCTC8325 SRD:S329) is the loading control. V, indicating shuttle plasmid pSK236 control and V + P1sarA, indicating 590 bp containing P1 promoter region along with the sarA gene. The relative band intensity of various lanes was scanned by Image J software (NIH) and statistical significance was calculated by setting the wild type band intensity as 100. Original blots are presented in Supplementary Material files Fig. X1A,B. (B) teg58 promoter analysis with fusion to GFP reporter system. A 210 bp teg58 promoter fragment was cloned upstream of the promoterless gfpuvr gene. Cp standing for chromosomal complementation of the sarA mutant. Means and standard deviations from triplicate experiments are shown. Student t-test (*P < 0.05, **P < 0.01; *** or ****P < 0.0001). (C) PhosphorImager image of 8.0% polyacrylamide gel showing binding of purified SarA protein to 210-bp promoter fragment of teg58. ASupplpproximately 0.02 pM of radiolabeled DNA fragment was used in all lanes. For competition assays, 100-fold molar excesses of the unlabeled promoter DNA (x*) and nonspecific competitor DNA (X**, a 200-bp internal fragment of the 16S rRNA gene) were added separately as shown. The arrows indicate the free labeled DNA or the DNA–protein complex. Original blot is presented in ementary Material files Fig. X1C.
Reduced biofilm formation in teg58 mutant is not dependent on PIA, agr and SarA
To determine the role of teg58 in biofilm formation, we have constructed deletion mutants of teg58 in both JE2 and SH1000 and complemented these mutants with shuttle plasmid pSK236 containing teg58 fragment (Table S1). As shown in Fig. 3A and Fig. S1C, biofilm was significantly decreased in teg58 mutants in both backgrounds but increased in teg58 plasmid complemented strains. Incidentally, optical density (OD600) of teg58 mutant from supernatants of biofilm wells at 24-h of growth was higher than the parent/complemented strains (Fig. S1D), but cells scraped from biofilm (in triplicates) in wells at 1 and 2-h after inoculation revealed significant reduction of surface attached cells with the teg58 mutant (53% and 30% of initial input cells at 1 and 2-h, respectively) compared to the wild type (885% and 1142% increased at 1 and 2-h, respectively) (Fig. S1E). To determine if any previously known factors of biofilm formation were affected due to teg58 deletion, we assayed icaADBC, which encodes PIA, and icaR transcription in the teg58 mutant by qRT-PCR analysis and did not find any alternations (Fig. 3B). We also analyzed PIA production by dot blots with anti-PIA antibodies, revealing little or no changes between teg58 mutant and the parents/complemented strains (Fig. 3C).

teg58 mediated biofilm formation is independent of PIA production and regulation of the target genes. (A) Static biofilm assay with isogenic strains in SH1000 background in TSB plus 0.25% glucose for 24 h. The sarA and agr mutant strains were used as controls. Δteg58, 220 bp chromosomal deletion strain; Δteg58(teg58), teg58 mutant complemented with pSK236 containing 450-bp teg58 with its native promoter. Means and standard deviations from triplicate experiments are shown. Student t-test (*P < 0.05, *** or ****P < 0.001). (B,D) Real-time qRT-PCR analysis for various genes as indicated along with the rpoB control were evaluated by qRT-PCR (2−ΔΔCT) using total RNA isolated from the respective strains at 24 h grown biofilm cells in TSB. The data were normalized against rpoB as the reference transcript for qRT-PCR. Relative expression of the genes was plotted against the wild type set as 1.0. “n.s.” indicate “not significant”. Pairwise comparation with Student t-test (*P < 0.05, **P < 0.005). (C) Dot bot showing PIA production in various strains. PIA production was detected with an anti-S. aureus PIA antibody, showing no changed in PIA production due to the teg58 deletion compared to the wild type and complement strains. Original blot is presented in Supplementary Material files Fig. X2.
Northern blot with a sarA probe (Fig. S2A) and Western blot with an anti-SarA monoclonal antibody (Fig. S2B) showed no major differences in sarA expression in isogenic teg58 strains grown under biofilm conditions. The agr locus is a negative regulator of biofilm formation indicated that expression of RNAII (agrDBCA) and RNAIII did not change in the teg58 mutant vs. the wild type/complemented strains (Fig. S2C). Transcription of psm-α, known to be involved in biofilm dispersal, was also not altered in the teg58 mutants (Fig. S2C). Analysis of the butanol extract46 of filtered cultured supernatants containing PSMs (PSMα1-4, PSMβ1-2, and δ-toxin) by SDS-PAGE (Fig. S2D) revealed no visual changes in intensity of the PSM band in the teg58 mutant vs. the wild type/complement, consistent with a lack of change in concentration of PSM peptides in the teg58 mutant vs. isogenic parent as confirmed by Mass Spectroscopy. Analysis for nucleases, proteases, and DNases under control of agr and/or sarA systems were also not altered in the teg58 mutants vs. the parent. Together, these results suggest that reduced biofilm formation in the teg58 mutant does not involve agr, SarA, PSMs and other known biofilm inducing factors controlled by SarA and agr.
RNA-Seq analysis of the teg58 mutant
Based on the above studies, we hypothesized that teg58 may regulate uncharacterized gene products involved in biofilm formation in S. aureus. To determine target genes regulated by teg58 and the ensuing phenotypic involvement (e.g., biofilm formation) in S. aureus, we performed RNA-Seq analysis of various strains in SH1000. To detect differentially expressed transcripts between various strains, pairwise comparisons were performed, and statistical significance (FDR-adjusted P < 0.05) determined using the edgeR package47 as described previously24. Phage-encoded genes were eliminated from analysis. Based on a twofold change, transcriptional profiling revealed alteration of 116 genes (38 genes up-regulated and 78 genes down-regulated) in the teg58 mutant vs. the wild type whereas a threefold change would yield 43 affected genes (8 up- and 35 down-regulated) in teg58 deletion (Table 1 and Table S3). The altered genetic pathways include purine metabolism, arginine biosynthesis, transport systems, metabolic and virulence genes. Some of teg58 neighboring genes (Fig. S1A, Table S4) including virulence factor were altered in the RNA-Seq dataset. Some of the virulence including neighboring genes (e.g., Saoushc_-01121/hla, -01954/lukD, -02708-10/hlgA, C and B, _01110/efb-1, -01112/flipr, -01113/HP, -01114/efb, -01115/scip) were confirmed by qRT-PCR (Fig. 3D). The data indicated that no significant alternation in transcript levels of the neighboring genes, although we are not ruling out the effect of teg58 at the post-transcription stage, which needs further investigation.
Impact of teg58 on l-arginine biosynthesis and production
RNA-Seq analysis indicated that argG (4.6-fold), and argH (5.0-fold), as part of an operon, were significantly upregulated while ureA-G encoding urease subunits (converting urea to ammonium as a downstream catabolism event) were down regulated (2.7–4.6-fold) in the teg58 mutant (Table 1). Genes involved in arginine catabolism such as rocF (~ 1.0-fold), argF (~ 1.12-fold), arcA or arcB (~ 1.5-fold) were not markedly altered in the teg58 mutant (Table S4). Northern analysis indicated a significant increase in argGH transcript level in the teg58 mutant (~ 1.8–5.5 fold in Fig. 4A) vs. parent but returned to parental level upon complementation (Fig. 4A). Growth analysis in CDM42 without l-arginine (containing 1% glucose) for 48 h (Fig. 4B) indicated that the teg58 mutant grew well while the wild type, isogenic complement as well as control sRNA mutants (teg49 and teg23) grew poorly in this arginine-depleted medium. As expected, the double ∆teg58/argG/H or single argG/H::ermC mutants failed to grow in CDM without l-arginine, suggesting that enhanced argGH expression for arginine biosynthesis in the teg58 mutant is likely responsible for growth in arginine deficient medium (Fig. 4B). Under static anaerobic (Fig. 4C) conditions, the teg58 mutant retained growth pattern like the aerobic setting. Growth analysis of the isogenic teg58 strains in TSB (Fig. S3A) and CDM (Fig. S3B) revealed no growth defect due to deletion or complementation. We also found no alternation in transcription of ccpA22,35 known to activate biofilm formation in a glucose-rich environment (Fig. 3D) and is involved in the biosynthesis of arginine via the urea cycle utilizing proline as the substrate.

teg58 effects l-arginine biosynthesis. (A) Northern blot analysis for various teg58 derivative strains with argG, and argH probes representing genes involved in arginine biosynthesis pathway. A total of 10 μg of cellular RNA isolated from the post-exponential phase of growth was loaded onto each lane. Ethidium bromide-stained gel used for blotting, showing 16S and 23S rRNA bands, is shown as the loading control. The relative band intensity of various lanes was scanned by Image J software (NIH) and the statistically significant was calculated considering the wild type band intensity set as 100. Original blots are presented in Supplementary Material files Fig. X3A–C. (B,C) Growth analysis in CDM containing 1% glucose without supplemented l-arginine for various isogenic strains as indicated. Growth was performed for 48 h at 37 °C in an incubator shaker (B; aerobic) and incubated in filled and sealed 50 ml screw capped tubes (C; anaerobic). (D) Determination of comparative intracellular l-arginine, l-citrulline, and l-ornithine concentrations of the wild type and the teg58 mutant of JE2 strains grown under aerobic conditions in TSB by LC–MS/MS mass spectroscopy. The asterisks indicate statistical significance between wild-type and isogenic mutant or various strains, determined using Student t-test (*, P < 0.05; **, P < 0.005; *** or ****, P < 0.0001) or “n.s” indicate “not significant”.
For confirmation, ultra-high performance liquid chromatography—high resolution tandem mass spectrometry was used to analyze l-arginine and its metabolite using intracellular fractions of isogenic teg58 strains grown under aerobic condition (Fig. 4D). The data indicated ~ twofold increase in intracellular l-arginine concentration in the teg58 mutant compared to the wild type, correlating with increased argGH transcription and higher growth in arginine-deficient CDM for the teg58 mutant.
Role of l-arginine in biofilm formation in S. aureus
l-arginine plays a critical role in growth and biofilm formation in several bacterial species by neutralizing acidic pH, inhibiting biofilm formation, and preventing co-aggregation of cells32,33,48. However, the role of arginine in biofilm formation in S. aureus has not been defined. Biofilm assays with assorted teg58 mutants in complete CDM (containing 1% glucose) found similar biofilm defect (Fig. 5A) as seen in TSB (Fig. 3A). Importantly, inactivation of argG or argH also led to increased biofilm formation (Fig. 5A) while the double mutants (∆teg58/argG or ∆teg58/argH) exhibited reduced biofilm formation, akin to the ∆teg58 mutant, implying the role of additional factor(s) other than argGH that may be involved in reducing biofilm formation in the teg58 mutant. In fact, our RNA-Seq analysis (Table 1) indicated that relA, involved in stress-responsive alarmone (p)ppGpp production and biofilm dispersion in multiple bacterial species49 including S. aureus50, or l-arginine dependent factors yet to be identified, could also be involved in reducing biofilm formation in the teg58 mutant. We are actively investigating the role of relA in biofilm formation in S. aureus as well as in combination with argGH in the teg58 mutant. Another possibility could be increased argGH mRNA that binds to teg58, therefore, decreases titers of free teg58. Decreasing teg58 titers alters the abundance of an alternative mRNA that teg58 interacts with, resulting in increased biofilm formation or increasing biofilm dispersal. Addition of l-arginine to CDM (Fig. 5B and Fig. S4C) or TSB (Fig. S4A,B) also reduced biofilm formation, with increasing concentrations l-arginine, beginning at ~ 1 mM (Fig. 5B).
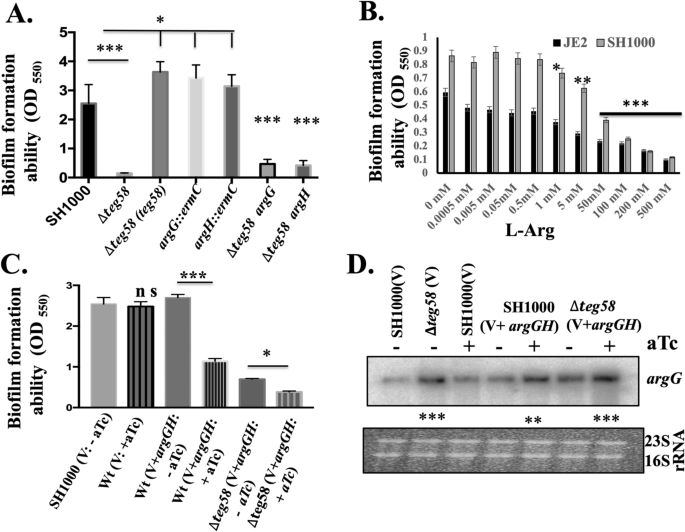
Inhibition of biofilm formation by l-arginine. (A) Static biofilm formation for various strains in complete CDM containing 1% glucose for 24 h in a microtiter plate (Costar, USA). (B) Biofilm formation for various strains for 24 h in complete CDM containing 1% glucose and various concentrations of exogenous l-arginine in a microtiter plate format. (C) Biofilm formation for various strains as indicated in TSB supplemented with 0.25% glucose for 24 h in a microtiter plate under induced (+ ATc) (500 ng/ml) and uninduced (-ATc) conditions. V represents pALC2073 as the vector control; V + argGH, represents pALC2073 with argGH including ribosome binding site cloned under tetO-inducible promoter; ATc stands anhydrotetracycline which is inducer for the pALC2073 system. (D) Transcript analysis of 10 μg of total cellular RNAs isolated from cultures in (C) under various conditions and probed with argG probe. “+” and “−” indicate the inducible and uninducible conditions. The relative band intensity of various lanes was determined by Image J software (NIH) and the statistically significant was calculated considering the wild type as 100. Original blot is presented in Supplementary Material files Fig. X4. Means and standard deviations from triplicate experiments are shown. Student t-test (*P < 0.05, **P < 0.01; *** or ****P < 0.001) and “n.s” indicate “not significant”.
To verify the role of intracellular arginine in repressing biofilm formation, we overexpressed argGH genes in a tetO-inducible vector, pALC207351, under induced and uninduced condition (Fig. 5C and Fig. S4D). Results indicated a noticeable decrease in biofilm formation in the parent under induced vs. uninduced condition, correlating with significant induction of the argGH transcript as detected by Northern blots in induced cells (Fig. 5D). Growth analysis in CDM lacking arginine indicated that the wild type grew faster under induced than uninduced condition, implying overexpression of intracellular argGH leads to enhanced cell growth (Fig. S3C). Overall, these analyses showed that extracellular l-arginine and/or intracellular overexpression of argGH can repress biofilm formation in S. aureus.
Specific interaction between sRNA teg58 and argGH mRNA for arginine production
To determine whether teg58 affects argGH at the transcriptional or post-transcriptional level, we performed gfpuvr reporter gene fusion with the argGH promoter (PargGH::gfpuvr) in pALC148444 in isogenic teg58 strains, showing no significant differences in mean GFP fluorescence per OD600nm values between the wild type and teg58 mutant strains of JE2 (15,464 ± 800 vs. 16,350 ± 760) and SH1000 (10,604 ± 612 vs. 9897 ± 700), indicating that teg58 does not regulate argGH transcription. In silico analysis using IntaRNA tool41 to locate potential site for sRNA-mRNA interactions (Fig. 6A and Fig. S5) revealed one 8-nt site (nt 51–58 in teg58) (Fig. 1C and Fig. S5A) with exact match to argG (nt 415–422 from start codon) and another 39-nt including gaps (nt 104–142 in teg58) (Fig. 1C and Fig. S5B) for plausible interaction with argH (nt 403–435 from the argH start codon). Notably, 9-nt within this site in argH (nt 403–411 or nt 1598–1606 in the argGH transcript) showed perfect pairing with teg58 (nt 134–142). Since the entire argGH transcript, at ~ 2600-nt long, is not suitable for resolution by mobility shift assay52,53, hence, we have divided the argGH transcript into five different overlapping fragments (arg-1 (1–600-nt), arg-2 (350–950 nt), arg-3 (875–1475 nt), arg-4 (1000–1625 nt), and arg-5 (1500–2200) (Fig. 6A). We conducted mobility shift assays with a radiolabeled ~ 170 nt teg58 fragment and larger fragments of argGH mRNAs as cold interacting RNAs. As shown in Fig. 6B, only arg-1, arg-2 and arg-5 RNA fragments showed interacting bands with the native teg58 RNA, in good agreement with the in-silico prediction of sites of interaction. In contrast, arg-3 and arg-4 mRNA fragments lacking homology with teg58 did not bind to teg58 in the assay. The teg58 probe also shifted in a concentration dependent manner with arg-2 and arg-5 RNA fragments (Fig. 6C). When the same experiments were performed with teg58 probe lacking the 8-nt interaction site for argG or scrambled 9-nt interaction site of argH for teg58 (without disrupting significant teg58 structure; Fig. S5D,E), we did not detect any interacting bands (Fig. 6D), suggesting that teg58-argGH interaction is specific in vitro.
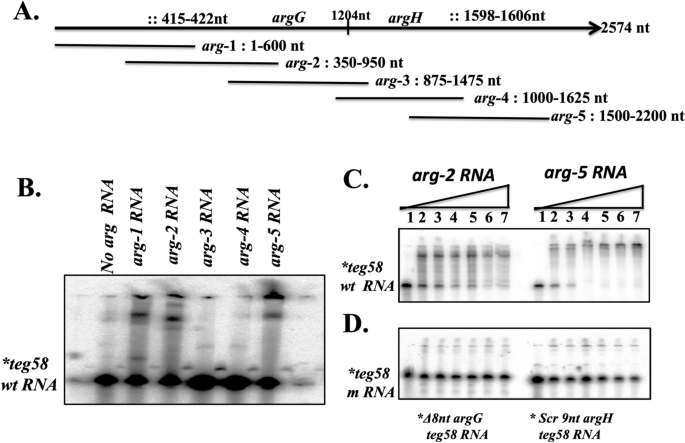
Potential sRNA::mRNA interactions in vitro between teg58 and argGH transcripts. (A) Representation of various truncated fragment of argGH along with site of interactions used for mobility shift experiments. The symbol “::” denotes potential sites of interaction between teg58 and argGH mRNA. (B) Gel mobility shift assays of teg58 RNA binding to various truncated argG or argH RNA fragments. Samples containing 5’ end-labeled 170-nt long transcript of teg58 RNA (1 nM) and tenfold molar excess of different truncated region of argGH RNA were heated to 70 °C and slowly cooled to room temperature, loaded onto 6% native polyacrylamide gel containing 5% glycerol, run at 4 °C, dried and phosphorimaged. The arg-1 and arg-2, and arg-5 truncated region of argGH mRNA, corresponding to coding regions of the argG and argH genes, respectively, interacted with teg58 sRNA in a manner consistent with in silico analysis, while two truncated fragments that were predicted not to interact did not cause any mobility shift. (C) Phosphorimage of a 6% nondenaturing polyacrylamide gel showing the titration of 5’ end-labeled teg58 RNA fragment with increasing concentrations of truncated argGH RNA fragments. Lanes 1–7, mobility of the RNA band in the presence of 0, 10, 20, 50, 100, 200, and 300 -fold molar excess of the arg-2 or arg-5 RNA. (D) Phosphorimage of a 6% nondenaturing polyacrylamide gel showing the titration of 5’end-labeled teg58 fragment as indicated with increasing concentrations of mutated argGH RNA fragments in a manner analogous to panel C. Original blots for B,C, and D are presented in Supplementary Material files Fig. X5A–C.
Teg58 and argGH interactions validated in vivo growth and biofilm formation, and argGH mRNA stability
To verify in vivo RNA-RNA interaction between teg58 and argGH mRNAs, we complemented the teg58 mutant with pSK236 containing teg58 fragment but with a deletion of 8-nt putative argG or a scrambled 9-nt argH interaction site followed by growth and biofilm analysis. Both mutated teg58 fragments on a plasmid mirrored the growth of the teg58 mutants in CDM without l-arginine (Fig. 7A) whereas the native teg58 fragment phenocopied the wild type. Chromosomal deletion of the 9-nt of argG or scrambling 9-nt site (coding for SLT instead of SLQ) of argH for interactions with teg58 in JE2 yielded growth in CDM lacking l-arginine (Fig. 7A), thus mimicking the growth pattern of the teg58 mutant instead of the wild type. Thus, the predicted interactions between teg58 and argGH mRNA are important to prevent production of arginine for growth in media lacking exogenous l-arginine.

In vivo validation of potential sRNA::mRNA interactions between teg58 and argGH transcript and mRNA stability in S. aureus cells. (A) Growth analysis in CDM containing 1% glucose without supplemented l-arginine for various isogenic strains as indicated. These strains include the wild type JE2, isogenic teg58 mutant; teg58 mutant complemented with native teg58, argG::ermC; argH::ermC; teg58 mutant with shuttle vector pSK236 carrying teg58 with the deletion of 8-nt interaction site for argG; teg58 mutant with shuttle vector pSK236 carrying teg58 with the 9-nt interaction site for argH scrambled; chromosomal mutation of the argG interaction site in teg58 (9-nt or 3 codons/AFA deletion); chromosomal mutation of the argH interaction site in teg58 (9-nt scrambled or SLQ to SLT). (B) Biofilm formation for various strains as indicated and described in (A) in TSB with added 0.25% glucose for 24 h in a microtiter plate. (C) argG mRNA stability in various strains was evaluated by qRT-PCR (2−ΔΔCT) using total RNA isolated from respective strains at the exponential phase of growth after treatment with rifampicin (200 μg per mL) at different time points. The data were normalized against rpoB as the reference transcript for the qRT-PCR. Relative expression of the gene (argG) in the wild type or teg58 mutant was plotted against no rifampicin treatment set as 100%. Means and standard deviations from triplicate experiments are shown. Student t-test (**P < 0.01; *** or ****P < 0.001).
Besides growth, we also ascertained biofilm formation. As shown in Fig. 7B, the teg58 mutant, harboring the recombinant pSK236 carrying teg58 with specific argG or argH mutation or chromosomal mutation of argG or argH at the putative interaction sites, failed to restore biofilm formation to the level of the parent. In addition, RNA stability studies for the argGH transcript in isogenic teg58 strains by qRT-PCR (Fig. 7C) clearly showed that the argGH transcript is more stable in the teg58 mutant than the wild type/complemented strains. The argGH mRNA half-life, a parameter for RNA stability, as defined by reduction of the transcript abundance by a factor of two, was determined to be ~ 1 min in the wild type and about ~ 5 min in the teg58 mutant. Taken together, these results from our in vitro and in vivo studies strongly suggested that failure to base-pair teg58 with argGH mRNA due to mutation stabilizes the transcript and increases arginine biosynthesis and production which represses biofilm formation in S. aureus.
Teg58-mediated biofilm production is independent of l-arginine catabolism
We have established above that reduced biofilm formation in the teg58 mutant is due, at least in part, to increased expression of argGH and ensuing production of l-arginine. As arginine level is balanced by biosynthesis and catabolism, we wanted to determine if reduced arginine catabolism contributes to the observed phenotype in the teg58 mutant. Analysis by qRT-PCR of the putative catabolism genes including arcA, arcB, and arcD (antiporter) (transcribed as a single transcript), argF and rocF from biofilm grown cells revealed no significant differences (0.8 to 1.5-fold) between the teg58 mutant and the parent except for reduced ureA expression (~ 0.38 fold) (Fig. 8A) in the teg58 mutant. Failure to restore the ureA transcript in the complemented teg58 strain to wild type level as detected by qRT-PCR (Fig. 8A) suggested that regulation of the ureA/urease pathway genes by teg58 may be different from the classic arginine catabolism pathway. Results also indicated that argG and sarA as well as teg58 (~ 38 fold in the wild type vs. mutant) remained active in biofilm cells (Fig. 8A). We also found no significant alterations in intracellular l-citrulline concentrations, the catabolite of ArcA, ArgF and Nos enzymes, between biofilm cells of the wild type and the teg58 mutant using a colorimetric microtiter plate method54 (Table 2). In contrast, the ratio of citrulline content in teg58 mutants vs. wild types (JE2 and SH1000) grown under aerobic shaking condition revealed an increase of 1.7 and 2.2-fold, respectively, consistent with the data from UHPC-HRMS/MS (Fig. 4D). To confirm that increased l-citrulline level in aerobic or planktonic cells is associated with elevated transcript level of the arginine catabolism genes, qRT-PCR of aerobic grown cells in TSB was performed (Fig. 8B), showing elevated transcript levels (1.2–2.7 fold) of arcA (1.7-fold), arcB, rocF, and arcD (~ 2.0-fold), argF (1.2-fold), argG (~ 3.0-fold), and nos (~ 2.7-fold) in the teg58 mutant, consistent with increased l-citrulline (Table 2) and l-ornithine levels (Fig. 4D) in cells grown under aerobic conditions. As aerobic and biofilm growth conditions (with glucose) are diverse, these data demonstrated that the catabolic pathway genes are relatively quiescent in biofilm cells but are more active in aerobic growth.

Analysis for the l-arginine catabolic pathway genes in teg58-mediated biofilm formation. (A,B) Real-time qRT-PCR analysis, along with the rpoB control, were evaluated by qRT-PCR (2−ΔΔCT) using total RNA isolated from the respective strains at 24 h grown biofilm cells (A) and post-exponential phase of aerobically grown cells (B) in TSB. The data were normalized against rpoB as the reference transcript for qRT-PCR. Relative expression of the genes was plotted against the wild type set as 1.0. (C) Growth analysis in CDM lacking l-arginine for various arginine catabolic pathway mutant strains as indicated. Growth was performed for 48 h at 37 °C in an incubator shaker. (D) Biofilm formation for various strains in TSB with 0.25% glucose for 24 h in a microtiter plate. Means and standard deviations from triplicate experiments are shown. Student t-test (*P < 0.05, **P < 0.01; ***P < 0.001) and “n.s” indicate “not significant”.
To further investigate the role of catabolic genes in arginine pathways, we have constructed single and double mutants of arcA, rocF, argF, nos, and ureA along with the teg58 mutation in JE2. Analyses of growth in CDM lacking l-arginine showed that the single mutant arcA, and argF mutants grew poorly but slightly higher than the parent while the rocF mutant grew even slower. Notably, there was no growth difference in the ureA and nos mutant vs. the parent (Fig. 8C). Importantly, the double mutants all showed increased growth as compared to the single arcA, rocF, argF, nos, and ureA mutants, but less than that of the single teg58 mutant (Fig. 8C). About biofilm formation, these single catabolic mutants showed higher biofilm formation in TSB compared to the wild type (Fig. 8D), consistent with reduced activity of the catabolic pathway, whereas the double mutants with teg58 exhibited significant reduction in biofilm formation compared to the respective single mutant strains. These results clearly suggest that decreased biofilm formation is due to the inactivation of teg58 rather than the deletion of the arginine catabolic pathway genes. Deleting the ureA gene linked to the production of ammonium (NH4+) from urea and downstream from an arm of the arginine catabolic pathway enzymes, led to mild increase in biofilm formation in the ureA mutant vs. the parent (Fig. 8D). Overall, these results showed that the arginine catabolic pathway genes are not likely to impart any major role in teg58-mediated biofilm formation, but the arginine biosynthesis pathway genes do.
Discussion
In this report, we have identified a small regulatory RNA, teg58, by using ChIP-Seq and RNA-Seq analysis and characterized teg58 that involved in biofilm formation in S. aureus. Remarkably, biofilm formation repressed by teg58 is not possibly tied to known and tested protein-based factors. In addition, factors involved in maturation of biofilm and detachment are not significantly altered in the teg58 mutant (Table 1 and Table S3).
l-arginine is a well-characterized precursor molecule for the biosynthesis of other amino acids and serves as an alternative energy source during anaerobic metabolism38. Various analyses disclosed that the argGH transcript was significantly upregulated in the teg58 mutant. Indeed, growth analysis with and without exogenous arginine as well as arginine determination in teg58 mutant are consistent with this observation. In silico analysis followed by biochemical and genetic studies strongly implicates specific sRNA-mRNA interaction between teg58 and argGH mRNA for arginine production in the teg58 mutant. Thus, biosynthesis of l-arginine is one of the major metabolic factors in the repression of biofilm formation in the teg58 mutant vs. the parent whether directly or indirectly which yet to be identified.
We also ruled out the possibility that reduced catabolism of arginine would contribute to increased arginine level. Most of the genes in the chromosomal arc operon or a second copy of the arginine deiminase pathway (ADI) in the ACME element in MRSA strains55, are not regulated by teg58 in biofilm cells as disclosed by qRT-PCR and enzymatic analysis in biofilm cells. Although various assays such as qRT-PCR, enzymatic and LC–MS/MS determinations for l-citrulline, and l-ornithine from aerobic grown cells in TSB revealed higher expression of some catabolic gene products, these results implied differential regulation of l-arginine metabolic activities between biofilm and aerobic grown cells in the teg58 mutant. We believed that higher production of l-arginine in teg58 mutant leads to higher activities of arginine metabolic pathway genes under aerobic growth condition. Interestingly, arginine permease (lysP) was found to be downregulated (~ fourfold) while arcD (antiporter) was unaltered in biofilm (Fig. 8A) but increased 2.0-fold in aerobically grown (Fig. 8B) cells of the teg58 mutant, likely to minimize import of arginine while arginine can be synthesized to meet biological need under biofilm-growing condition.
We surmise that increased arginine production in the teg58 mutant likely neutralizes acidic pH arising from glucose metabolism, in part to reduce the need to hydrolyze urea (by ureases) to form ammonia to elevate both the pHin and the pHout. We are further investigating the growth phenotype of teg58 mutant that can grow at acidic pHs (~ 5.0–5.5) compared to the wild type/complemented strains, suggesting that possibly increased intracellular l-arginine concentration likely enables the cells to sustain the growth of the teg58 mutant under acidic pH condition. The acid tolerance of the teg58 mutant with respect to growth is of clinical interest because neutrophils are formidable defender based in part on its ability to lower pH, generation of ROS, proteases, and host defense peptides inside the phagolysosomes. Therefore, it will be interesting to find out the exact role of teg58 at acidic pHs and the role ureases play under acidic pH conditions.
Arginine has been reported to inhibit biofilm formation in several oral bacterial species by reducing insoluble extracellular polysaccharide production, resulting in a fragile biofilm architecture33,34. Biofilm assays (Fig. 5 and Fig. S4) demonstrated that biofilm formation can be inhibited by exogenously l-arginine or endogenous overexpression of arginine biosynthesis genes, a new finding in S. aureus. However, the exact manner by which arginine impacts biofilm formation in S. aureus is not clearly defined. We acknowledged that discrepancy in biofilm formation ability for the double mutants (argG or H) of teg58 compared to the single mutant argG or H that could be due to other factors such as relA (Table 1) involved in biofilm dispersion49,50 or l-arginine mediated gene products, which yet to be identified in S. aureus. Our preliminary results indicated that the transcript level of relA by qRT-PCR and (p)ppGpp production determined by metabolomic are three–fivefold more in teg58 mutants than the wild type and biofilm formation is up in relAsyn mutant. We are actively investigating the role of relA in S. aureus biofilm formation as well as in teg58 mutant in combination with argGH system. Several metabolic transcriptional regulators such as CcpA, PurR, CodY and SrrAB are known to monitor metabolite levels and respond by directly modulating the transcription of genes utilized for central metabolism, energy generation and pathogenesis56, but expression of these genes was not significantly altered in the teg58 mutant (Table S4). It remains unclear whether other modes of regulation monitor arginine level via the teg58 pathway.
Overall, our results indicated that teg58, a sRNA repressed by SarA, is involved in biofilm formation in a process that potentially involves arginine production at the post-transcriptional level via teg58-argGH mRNA interaction (Fig. 9). We have also demonstrated that the catabolic pathway genes for arginine are not involved in teg58-mediated biofilm formation. Notably, RNA-Seq analysis revealed several up-regulated genes in the purine metabolism pathway in the teg58 mutant vs. the parent (Table1). Interestingly, we have found increased amount of stringent molecule, (p)ppGpp involved in biofilm dispersal57, in the teg58 mutant, which is under investigation. Whether combination of l-arginine and (p)ppGpp synthesis are responsible for decreased biofilm formation in the teg58 mutant remains to be defined.

Proposed teg58-mediated pathway in biofilm formation via arginine production in S. aureus. SarA repressed teg58, a sRNA that represses argGH for l-arginine synthesis and production. teg58 mediates biofilm formation independent of SarA, agr, ica (PIA), psms (PSMs), proteases (aur, sspA, sspB, splA-F) and nucleases (nuc and nuc2).
Materials and methods
Bacterial strains, plasmids, and primers
All strains, plasmids, and primers used in this study are listed in the Supplementary Tables S1and S2. S. aureus strains were grown in Tryptic Soy Broth (TSB; Benton Dickinson, NJ) or chemically defined medium (CDM) containing 1% glucose42 or on TSB agar or CYGP supplemented with antibiotics when necessary (5 μg/ml of erythromycin, and 10 μg/ml of chloramphenicol). Cultures were grown aerobically in a 1:5 flask-to-volume ratio, with shaking at 250 rpm at 37 °C. Luria–Bertani (LB) broth or agar was used for growing Escherichia coli supplemented with suitable antibiotics when necessary (100 μg/ml of ampicillin).
Genetic manipulations in E. coli and S. aureus
All primers used for cloning, PCR, qRT-PCR, mutant construction, and plasmid construction can be found in Supplementary Table S2. Construction of mutant strains was performed using pMAD vector58 as described previously23,24. Briefly, to construct a teg58 deletion mutant, the teg58 sRNA region together with flanking sequences on both sides was amplified by PCR with primer pair teg58 F and R to yield a 2.3 kb region flanking with BamHI sites (Table S2), using chromosomal DNA from strain SH1000 as a template. The 2.3 kb PCR fragment was digested and cloned into the cloning vector pUC19 at the BamHI site in E. coli. A 220-bp fragment comprising teg58 was deleted by PCR with primer pair teg58 ko F and R (Table S2). The fragment containing teg58 deletion was excised with BamHI and cloned into the temperature-sensitive shuttle vector pMAD in E. coli IM08B. Plasmid isolated from IM08B59 was authenticated by digestion and sequencing and then introduced into JE2 and SH1000 strains by electroporation. Transformants were selected at 30 °C on erythromycin and X-gal (5-bromo-4-chloro-3-indoxyl-beta-d-galactopyranoside) containing plates. Mutant construction and confirmation were performed as described previously23,24. Utilizing the same vector (pMAD) and method, we constructed in-frame deletion mutants of the arcA, rocF, argF, and ureA genes in JE2. The double mutants of these genes with sRNA, teg58, were constructed using JE2△teg58 (ALC8715) and the respective gene deletion in pMAD construct. The nitric oxide synthase (nos) mutants in JE2 and JE2△teg58 (ALC8715) were constructed by phage transduction from the lysate of NE library strain NE2711 and confirmed by chromosomal PCR and DNA sequencing.
To complement the teg58 deletion strains, a 450-bp fragment encompassing the teg58 sRNA with 170-bp upstream and 101-bp downstream was cloned into shuttle plasmid pSK23643 in E. coli IM08B strain59. The construct was verified by plasmid restriction analysis and DNA sequencing, then electroporated into parental and isogenic teg58 mutant strains. To create the transcriptional fusion, a 210-bp teg58 promoter or 202-bp argGH promoter fragment was amplified by PCR using chromosomal DNA of S. aureus strain JE2 and primers with flanking EcoRI or XbaI sites and cloned into shuttle plasmid pALC148444 to generate the transcriptional fusion of the teg58 or argGH promoter to the gfpuvr reporter gene. The effect of endogenous arginine on biofilm formation was evaluated with an anhydrotetracycline-inducible promoter system to yield a gradient of argGH expression. The polycistronic argGH coding region, together with the upstream ribosomal binding site, was ligated downstream of the xylR/tetO promoter in pALC2073 containing the tetR repressor51.
Isolation of total cellular RNA, northern blot hybridization
Isolation of total cellular RNA from various growth phases or biofilm cells and subsequent analysis by Northern blot hybridization were performed as described previously24. Biofilm cells were scrapped from the wells of 96-well plate and pooled before harvesting. For sRNA, 15 μg each of total RNAs were separated onto 8% polyacrylamide/8 M urea gels and transferred them onto Hybond-N + membranes (Amersham, USA). For mRNA, 10 μg each of total RNAs were separated onto 1% agarose-formaldehyde gels and transferred them onto membranes. DNA fragments encoding the open reading frames of the sarA, agrA, agr RNAIII, icaA, icaR, argG, argH, sRNA teg58, Tm RNA, and other genes were amplified by PCR or excised from the plasmids containing the desired genes with restriction endonucleases and then gel purified. For detection of specific transcripts, gel-purified DNA probes were radiolabeled with [α-32P]-dCTP by using the random-primed DNA labeling kit (Roche Diagnostics GmbH) and hybridized under aqueous-phase conditions at 65 °C. The blots were subsequently washed, exposed for overnight to PhosphoImager screen and scanned. Each of the experiments was repeated at least three times independently.
Chromosome immunoprecipitation (ChIP) assay
ChIP experiment was performed as described60. Detailed method and analysis of ChIP-Seq were described in our previous publication40.
Primer extension and 3′ RACE assays
Mapping of the 5′-end of teg58 sRNA transcript by primer extension was performed using the primer 5´-ACAATAGCCACCTCGCTTGTTCA-3′, complementary to the teg58 RNA strand and located from nt positions 112 to 90 downstream from the mapped putative transcriptional start site. Primer extension and 3´ RACE assays to map the 5´- and 3´- end of teg58 sRNA transcript, total cellular RNA was isolated from the wild type and sarA mutant strains, purified, and assays were performed as described previously23. Reverse transcription was carried out as described elsewhere by using total RNA isolated from wild-type SH1000 or the sarA mutant as described previously24. Finally, 3′ RACE-PCR products were sequenced, and sequences were aligned with teg58 region of the NCTC8325 annotated genome sequence.
qRT-PCR analysis
For real-time qRT-PCR experiments, strains SH1000 or JE2, isogenic teg58 mutant, and teg58 complemented teg58 mutant were grown in TSB media to post-exponential phase of growth (~ OD600nm of 1.4). Total RNA was isolated from planktonic, or biofilm cells as described earlier. Quantitative real-time PCR (qRT-PCR) was performed as previously described24. Briefly, 5 μg of isolated RNA was treated with Turbo DNaseI, purified, and 500 ng was used as a template for making cDNA by using RevertAid H minus first strand cDNA synthesis kit (Thermo Scientific, USA). SsoFast EvaGreen supermix (Bio-Rad, USA) was used to generate standard curves for the cDNA concentration/crossing point (Cp) for the target genes and the reference gene, rpoB. The mean target transcriptional expression level for the three transcript measurements was calculated. The threshold cycle (2−ΔΔCT) method was used to calculate relative changes in gene expression, using triplicate samples, Bio-Rad’s CFX Maestro software was used to analyze the qRT-PCRs. Control reaction mixtures containing master mix and primers, but no cDNA was also analyzed.
RNA-Seq library preparation and analysis
Samples for transcriptome sequencing (RNA-Seq) were prepared from the following strains, the wild type SH1000, and its isogenic derivative teg58 mutant (ALC8717) and the isogenic teg58 mutant complemented teg58 strain (ALC8749). Briefly, overnight cultures were diluted 1:100 in fresh TSB (an initial OD600 of about 0.04–0.05) and grown at 37 °C for 4 h. Two replicate cultures for each sample were grown, and total cellular RNAs from two biological replicates were extracted as described previously24. RNA was quantified and 1 µg of total RNA was ribo-depleted with the bacterial Ribo-Zero kit from Illumina. The truseq total RNA stranded kit from Illumina was used for the library preparation, and quantity and quality were measured/assessed. The libraries were pooled at equimolarity and loaded at 2 nM for clustering. Oriented 50 bases single-read sequencing was performed on the Illumina HiSeq 4000 sequencer yielding a minimum of 50 million mapped reads per sample. Final RNA-Seq analysis and data analysis were carried out using previous described procedures24. Statistical analyses were done in R v3.2.3 using the edgeR package47 following the bioinformatics protocol described61.
Biofilm assay
Quantification of biofilm formation on abiotic surfaces was performed as described previously24. Briefly, S. aureus strains grown overnight in TSB were diluted (1:50) in TSB supplemented with 0.25% glucose or CDM containing 1% glucose and l-arginine (0.5 mM). This cell suspension was used to inoculate sterile 96-well “U” bottom polystyrene microtiter plates (Costar, Corning Inc., USA) in triplicate. After 24 h of incubation at 37 °C, wells were gently washed three times, air dried, and stained with 0.1% crystal violet dye. Wells were rinsed 3–4 times, dried for overnight, solubilized in 30% acetic acid, and solubilized dye was transferred to a fresh plate and read at 550 nm (Tecan Infinite M1000 Pro, Austria). Each assay was repeated at least three times in separate experiments.
PIA detection
PIA production in S. aureus was detected by Dot blot as described by Cramton et al.62. Briefly, cells were grown overnight in TSB supplemented with 0.25% glucose, the optical density was determined, and the same number of cells from each culture was resuspended in 50 μl of 0.5 M EDTA (pH 8.0). Cells were incubated for 7 min at 100 °C and centrifuged to pellet the cells, and the supernatant was incubated with 10 μl of proteinase K (10 mg/ml) for 30 min at 37 °C. After incubation, 10 ul of Tris-buffered saline (pH 7.5) containing 0.01% bromophenol blue was added, and 5 μl was spotted on a nitrocellulose membrane, dried, blocked with 3% bovine serum albumin for 2 h., and incubated overnight with an anti-S. aureus PIA antibody (1:250) (gifted from Dr. M. Otto, NIH). Bound antibodies were detected with a secondary alkaline phosphatase conjugated anti-rabbit immunoglobin G (IgG) antibody (Jackson Laboratory) diluted 1:5000. Finally, blot was detected in developing solution.
Butanol extraction of PSMs
A comparative PSMs analysis for various strains was performed by extracting PSMs from various S. aureus culture supernatant using previously described procedure46. Briefly, various S. aureus strains were grown for biofilm formation in plastic plates in TSB medium containing 0.25% additional glucose for 24 h, scrapped from the wells, the OD650nm measured and centrifuged to obtain the culture supernatants which were then sterile filtered to remove any cells. One third (v/v) of 100% n-butanol was added to the spent supernatants, shaken vigorously at 37 °C for 2 h, and centrifuged. The upper (butanol) layer was removed and dried by vacuum centrifugation. To visualize PSMs, extracts were dissolved in TE buffer (10 mM Tris–Cl pH7.6 and 1 mM EDTA), mixed with 6 X SDS PAGE gel loading buffer, separated on 12% PAGE-SDS gels, and stained with Coomassie brilliant blue.
DNA and RNA electrophoretic mobility shift assay
Gel shift experiments for the binding of SarA to the radiolabeled promoter fragment (210 bp) of teg58 was performed as previously described5,59. The sRNA-mRNA interaction was performed according to the described procedures by Morita et al.52. Briefly, ~ 2.6 kb long argGH coding region was divided into five different overlapping fragments (1–600 bp, 350–950 bp, 875–1475 bp, 1000–1625 bp, and 1500–2200 bp). These DNA fragments and teg58 were amplified by PCR using upstream primer containing T7 promoter sequence and purified using GeneJET PCR purification kit (Thermo Fisher Scientific, USA). RNA was synthesized using HiScribe T7 In Vitro Transcription kit (NEB Biolabs, USA) according to the manufacturer’s protocol, treated with RNase-free DNase I and purified using GeneJET RNA purification kit (Thermo Fisher Scientific, USA). Ten pmol of various synthesized teg58 sRNAs were dephosphorylated with alkaline phosphatase, purified, end-labeled with γ32P ATP, purified with a 6% polyacrylamide—6 M urea gel and eluted with elution buffer (0.5 M ammonium acetate, 10 mM magnesium acetate, 1 mM EDTA, 0.1% SDS) at 4 °C for overnight followed by purification and ethanol precipitation. The pellets were dissolved in sterile RNA grade water to a 0.1 pmol per μl. 0.2 pmol of 32P-labeled teg58 RNA was mixed with 0.4 pmol of various truncated argGH mRNAs in 20 μl of binding buffer (20 mM Tris–Cl pH8.0, 1 mM MgCl2, 20 mM KCl, 1.0 mM Na2HPO4–NAH2PO4, pH8.0) and incubated at 70 °C (or 37 °C) for 5 min. After heating, the samples were slowly cooled to 30 °C, mixed with 0.2 vol of loading buffer, loaded onto a 4% polyacrylamide native gel in 0.5 × TBE containing 5% glycerol and ran at 4 °C until the bromophenol blue migrates to 2/3 of the gel. The gel was vacuum dried on Whatman paper, exposed to PhosphorImager screen, and developed.
Western blotting and immunodetection
Whole cell extracts from S. aureus wild types or various mutant strains were prepared from cells grown to different growth phases as described previously24. The concentration of total proteins from clear lysates was determined by using the Bio-Rad BCA protein assay dye using bovine serum albumin as the standard. Western blotting and detection with primary antibody (anti-SarA) and goat anti-mouse secondary antibody conjugated with alkaline phosphatase and 1-Step NBT/BCIP blotting substrate (Thermo Scientific) were performed as described previously24.
RNA stability assay by real-time qRT-PCR
For RNA stability experiments, strains SH1000 or JE2, isogenic teg58 mutant, and teg58 complemented teg58 mutant were grown in TSB media to an OD600 of 1.2 (mid-log phase of growth). After the addition of rifampin to 200 μg per ml, samples were collected between 0- and 30-min. Total RNA was isolated as described earlier and quantified by measuring the absorbance at 260 nm. 5 μg of isolated RNA was treated with Turbo DNaseI, purified, and 500 ng was used as a template for making cDNA by using RevertAid H minus first strand cDNA synthesis kit (Thermo Scientific, USA). qRT-PCR was performed as described earlier in qRT-PCR section using argG specific primers.
Measurement of the enzymatic activities of the arginine catabolic pathway by determining l-citrulline concentrations
The l-citrulline concentration was determined by a colorimetric 96-well microtiter plate assay as described54. Briefly, various cells were grown in shaking tubes or biofilm formation growth in 96-well plastic microtiter plate for 24 h. Biofilm cells were scrapped, pooled, centrifuged, and washed once with 0.1 M sodium phosphate buffer (pH 6.2). The cell pellets were resuspended in 0.5 ml of 0.1 M phosphate lysis buffer (25 mM Tris-pH7.0, 150 mM NaCl, and 0.1 mM EDTA) and lysed in combination with 0.1-mm-diameter zirconia-silica beads in a Fast Prep reciprocating shaker. The concentration of the lysate proteins was determined with the Bio-Rad protein assay solution (Bio-Rad, USA), using bovine serum albumin as the standard.
The calibration curve was obtained using l-citrulline (L7629; Sigma-Aldrich, USA) concentrations between 0 and 400 μM in a volume of 60 μl in a 96-well polystyrene microtiter plate (Costar RIA/EIA clear flat bottom plate) in triplicates. A color developing reagent (COLDER) solution was freshly prepared by mixing 1 vol of solution A [80 mM DAMO (diacetyl monoxime, B0753, Sigma-Aldrich) and 2.0 mM thiosemicarbazide, T33405, Sigma-Aldrich] and 3 vol of solution B [3.0 M H3PO4, 6.0 M H2SO4, and 2 mM NH4Fe(SO4)] and storing in the dark before use within 1 h. Then 200 μl of COLDER was added to each well and a microseal “B” adhesive seal (Bio-Rad, USA) was used for plate closure. The plate was placed onto the bottom of a preheated aluminum block, covered with a preheated glass plate, and incubated in an oven at 95 °C for 15 min. After cooling down for 10 min, the sample absorptions were measured in a plate reader (Tecan Infinite M1000 Pro, Austria) at 540 nm. The values were plotted against the concentrations of l-citrulline to obtain a standard curve.
Measurement of the arginine catabolic pathway enzymatic activities lead to l-citrulline production under different conditions of various strains was performed using fixed amount (50 or 100 μg) of various cell lysates. Fixed amount of cell lysate was added to the well in triplicates and the volume was adjusted to 55 μl with 0.1 M sodium phosphate buffer (pH 6.2). The enzymatic reaction was initiated with addition of 5 μl of 80 mM MMA (monomethylated l-arg, M7033, Sigma-Aldrich, USA), a substrate, and incubated for 30 min at 37 °C in a water bath. The reaction was stopped by the addition of 200 μl COLDER solution and the concentration of l-citrulline as determined as described above. One unit is defined as the amount of enzyme that produces 1 μM of l-citrulline per minute under the experimental conditions. The enzymatic activities for various strains were calculated based on the l-citrulline standard curve. Each assay was repeated at least three times in separate experiments.
Determination of l-arginine by UHPLC-HRMS(/MS)
The wild type and teg58 mutant of JE2 were grown under aerobic conditions. Cells were collected by centrifugation and washed with ice-cold 150 mM ammonium acetate before adding 1 ml of ice-cold MeOH:H2O 80:20 (v/v) onto the pellet for metabolism quenching and cell content extraction. Cells were lysed by a bead beater (FastPrep) and supernatants were separated from pellets by centrifugation, collected into fresh tubes and evaporated. Dry extracts were redissolved in H2O/200 mM NH4OAc pH 9.05/MeCN 30:10:60 (v/v/v) prior to LC–MS analysis. Chromatographic separation was performed on an Acquity I-Class UHPLC system (Waters, Milford, USA), equipped with a flow-through needle (FTN) autosampler, heated column compartment and binary solvent delivery system with a delay volume of 80 μl. The samples were injected onto Acquity™ BEH Z-HILIC (2.1 × 150 mm, 1.7 µm, 95 Å) column and temperature of the column compartment was maintained at 30 °C. Gradient elution was performed in 35 min. On-line coupled QExactive™ Focus mass spectrometer (Thermo Fisher Scientific, USA), featuring heated electrospray ionization (HESI II) ion source, orbitrap mass analyzer with mass selection quadrupole and higher energy dissociation (HCD) collision cell, supplied with N2 as a collision gas had been used for acquisition of the MS/MS data. Mass accuracy was calibrated below 2 ppm using Pierce LTQ Velos calibration solution according to the requirements of the manufacturer. All operations were controlled by Xcalibur software supplied by vendor. MS/MS experiments were performed in top3-DDA mode with an absolute collision energy (CE) stepping of 10/20/50 eV at R = 35,000 (m/z 200), 1 microscan, fixed injection time of 90 ms (30 ms/step) and AGC target of 2e5 charges. Quadrupole isolation width was set to 1 Da, isolation threshold of 1e4 and precursor exclusion for 3 s were applied. Survey scan parameters for top3-DDA experiment were identical to those used in full scan measurements except the number of microscans, which was set to 1. Reference spectra were obtained from an injection of 1 ppm solution (ACN/H2O, 3:1) of commercially available l-arginine (Sigma-Aldrich) or other metabolites.
Software analysis
All statistical analysis and graph production were done using GraphPad Prism 9 and Microsoft excel programs. All data were obtained from at least three independent experiments with multiple replicates unless stated otherwise. Student’s t-test was applied to analyze data on CFU, biofilm assays, and qRT-PCR. A p-value of < 0.05 was considered as statistically significant. Scanned images from non-saturated exposed PhosphorImager were analyzed densitometrically using ImageJ 1.51 g (NIH). Cropping of the original files were performed using Image J and Adobe Photoshop CS6 programs.
Data availability
The datasets generated during and/or analyzed during the current study are available from the corresponding author upon reasonable request. Raw RNA sequencing data have been deposited at ENA (https://www.ebi.ac.uk/ena) under the following name: PRJEB48126.
References
Foster, T. J. Immune evasion by staphylococci. Nat. Rev. Microbiol. 3, 948–958 (2005).
Kennedy, A. D. & DeLeo, F. R. Neutrophil apoptosis and the resolution of infection. Immunol. Res. 43, 25–61 (2009).
Prax, M. & Bertram, R. Metabolic aspects of bacterial persisters. Front. Cell. Infect. Microbiol. 4, 1–6 (2014).
Cheung, A. L. et al. The SarA protein family of Staphylococcus aureus. Int. J. Biochem. Cell Biol. 40, 355–361 (2008).
Ballal, A., Ray, B. & Manna, A. C. sarZ, a sarA family gene, is transcriptionally activated by MgrA and is involved in the regulation of genes encoding exoproteins in Staphylococcus aureus. J. Bacteriol. 191, 1656–1665 (2009).
Guillet, J., Hallier, M. & Felden, B. Emerging functions for the Staphylococcus aureus RNome. PLoS Pathog. 9, e1003767 (2013).
Raina, M. et al. Dual-function RNAs, p471-485. In Regulating with RNA in Bacteria and Archaea (eds Storz, G. & Papenfort, K.) (American Society of Microbiology, 2018).
Storz, G., Vogel, J. & Wassarman, K. M. Regulation by small RNAs in bacteria: Expanding frontiers. Mol. Cell 43, 880–891 (2011).
Vogel, J. & Luisi, B. F. Hfq and its constellation of RNA. Nat. Rev. Microbiol. 9, 578–589 (2011).
Liu, W. et al. Staphylococcus aureus pigmentation is not controlled by Hfq. BMC Res. Notes 13, 63–68 (2020).
Fey, P. D. et al. A genetic resource for rapid and comprehensive phenotype screening of nonessential S. aureus genes. mBio 4, e00537-12 (2013).
Bohn, C., Rigoulay, C. & Bouloc, P. No detectable effect of RNA-binding protein Hfq absence in Staphylococcus aureus. BMC Microbiol. 7, 10 (2007).
Pichon, C. & Felden, B. Small RNA genes express from Staphylococcus aureus genomic and pathogenicity islands with specific expression among pathogenic strains. Proc. Natl. Acad. Sci. USA 102, 14249–14254 (2005).
Carroll, R. K. et al. Genome-wide annotation, identification, and global transcriptomic analysis of regulatory or small RNA gene expression in Staphylococcus aureus. mBio 7, e01990-15 (2016).
Beaume, M. et al. Cartography of methicillin-resistant S. aureus transcripts: Detection, orientation and temporal expression during growth phase and stress conditions. PLoS ONE 5, e10725 (2010).
Tomasini, A. et al. The importance of regulatory RNAs in Staphylococcus aureus. Infect. Genet. Evol. 21, 616–626 (2014).
Gupta, R. K., Luong, T. T. & Lee, C. Y. RNAIII of the Staphylococcus aureus agr system activates global regulator MgrA by stabilizing mRNA. Proc. Natl. Acad. Sci. USA 112, 14036–14041 (2015).
Rochat, T. et al. The conserved regulatory RNA RsaE down-regulates the arginine degradation pathway in S. aureus. Nucleic Acid Res. 46, 8803–8816. https://doi.org/10.1093/nar/gky584 (2018).
Bohn, C. et al. Experimental discovery of small RNAs in Staphylococcus aureus reveals a riboregulator of central metabolism. Nucleic Acids Res. 38, 6620–6636 (2010).
Xue, T. et al. ArtR, a novel sRNA of Staphylococcus aureus, regulates α-toxin expression by targeting the 5’-UTR of sarT mRNA. Med. Microbiol. Immunol. 203, 1–12 (2014).
Chabelskaya, S. et al. A Staphylococcus aureus small RNA is required for bacterial virulence and regulates the expression of an immune-evasion molecule. PLoS Pathog. 6, e1000927 (2010).
Barrientos, L. et al. Assembling the current pieces: The puzzle of RNA-mediated regulation in Staphylococcus aureus. Front. Microbiol. 12, 706690 (2021).
Kim, S. et al. Contribution of teg49 small RNA in the upstream transcriptional region of sarA to virulence in Staphylococcus aureus. Infect. Immun. 82, 4369–4379 (2014).
Manna, A. C. et al. Small RNA Teg49 is derived from a sarA transcript and regulates virulence genes independent of SarA in Staphylococcus aureus. Infect. Immun. 86, e00635-e717 (2018).
Otto, M. Staphylococcal infections: Mechanisms of biofilm maturation and detachment as critical determinants of pathogenicity. Annu. Rev. Med. 64, 175–188 (2013).
Kavanaugh, J. S. & Horswill, A. R. Impact of environmental cues on Staphylococcal quorum sensing and biofilm development. J. Biol. Chem. 291, 12556–12564 (2016).
Lister, J. L. & Horswill, A. R. Staphylococcus aureus biofilms: Recent developments in biofilm dispersal. Front. Cell. Infect. Microbiol. 4, 1–9 (2014).
O’Gara, J. P. ica and beyond: Biofilm mechanisms and regulation in Staphylococcus epidermidis and Staphylococcus aureus. FEMS Microbiol. Lett. 270, 179–188 (2007).
Tormo, M. A. et al. SarA is an essential positive regulator of Staphylococcus epidermidis biofilm development. J. Bacteriol. 187, 2348–2356 (2005).
Mann, E. E. et al. Modulation of eDNA release and degradation affects Staphylococcus aureus biofilm maturation. PLoS ONE 4, e5822 (2009).
Agnello, M. et al. Arginine improves pH homeostasis via metabolism and microbiome modulation. J. Dent. Res. 96, 924–930 (2017).
Jakubovics, N. S. et al. Critical roles of arginine in growth and biofilm development by Streptococcus gordonii. Mol. Microbiol. 97, 281–300 (2015).
Zhu, B. et al. ciaR impacts biofilm formation by regulating an arginine biosynthesis pathway in Streptococcus sanguinis SK36. Sci. Rep. 7, 17183 (2017).
Huang, X. et al. Effect of arginine on the growth and biofilm formation of oral bacteria. Arch. Oral Biol. 82, 256–262 (2017).
Nuxoll, A. S. et al. CcpA regulates arginine biosynthesis in S. aureus through repression of proline catabolism. PLoS Pathog. 8, e1003033 (2012).
Zhu, Y. et al. Staphylococcus aureus biofilm metabolism and the influence arginine on polysaccharide intercellular adhesion synthesis, biofilm formation, and pathogenesis. Infect. Immun. 75, 4219–4226 (2007).
Halsey, C. R. et al. Amino acid catabolism in Staphylococcus aureus and the function of carbon catabolite repression. mBio 8, e01434-16 (2017).
Kinkel, T. L. et al. An essential role of bacterial nitric oxide synthase in Staphylococcus aureus electron transfer and colonization. Nat. Microbiol. 2, 16224 (2016).
Ibberson, C. B. & Whiteley, M. The Staphylococcus aureus transcriptome during cystic fibrosis lung infection. mBio 10, e02774-19 (2019).
Charlotte, O. et al. Expanding the Staphylococcus aureus SarA regulon to small RNAs. mSystems 6, e00713-21 (2021).
Wright, P. R. et al. CopraRNA and IntaRNA: Predicting small RNA targets, networks and interaction domains. Nucleic Acids Res. 42, W119–W123 (2014).
Hussain, M., Hastings, J. G. & White, P. J. A chemically defined medium for slime production by coagulase-negative staphylococci. J. Med. Microbiol. 34, 143–147 (1991).
Gaskill, M. E. & Khan, S. A. Regulation of the enterotoxin B gene in Staphylococcus aureus. J. Biol. Chem. 263, 6276–6280 (1988).
Cheung, A. L., Nast, C. C. & Bayer, A. S. Selective activation of sar promoters with the use of green fluorescent protein transcriptional fusions as the detection system in the rabbit endocarditis model. Infect. Immun. 66, 5988–5993 (1998).
Riggs, A. D., Suzuki, H. & Bourgeois, S. lac repressor-operator interaction: Equilibrium studies. J. Mol. Biol. 48, 67–83 (1970).
Joo, H. S. & Otto, M. The isolation and analysis of phenol-soluble modulins of Staphylococcus epidermidis. Methods Mol. Biol. 1106, 93–100 (2014).
Robinson, M. D. et al. Edger: A Bioconductor package for differential expression analysis of digital gene expression data. Bioinformatics 26, 139–140 (2010).
Borriello, G. et al. Arginine or nitrate enhances antibiotic susceptibility of Pseudomonas aeruginosa in biofilms. Antimicrob. Agents Chemother. 50, 382–384 (2006).
Diaz-Salazar, C. et al. The stringent response promotes biofilm dispersal in Pseudomonas putida. Sci. Rep. 7, 18055 (2017).
de la Fuente-Nunez, C. et al. Broad spectrum anti-biofilm peptide that targets a cellular stress response. PLoS Pathog. 10, e1004152 (2014).
Bateman, B. T. et al. Evaluation of a tetracycline-inducible promoter in Staphylococcus aureus in vitro and in vivo and its application in demonstrating the role of sigB in microcolony formation. Infect. Immun. 69, 7851–7857 (2001).
Morita, T., Maki, K. & Aiba, H. Detection of sRNA-mRNA interactions by electrophoretic mobility shift assay. In Bacterial Regulatory RNA: Methods and Protocols in Molecular Biology Vol. 905 (ed. Keiler, K. C.) 235–255 (Humana Press, 2012).
Bak, G. et al. Electrophoretic mobility shift assay of RNA–RNA complexes. In RNA-RNA Interactions. Methods in Molecular Biology (ed. Schmidt, F.) (Humana Press, 2015).
Knipp, M. & Vasak, M. A colorimetric 96-well microtiter plate assay for the determination of enzymatically formed citrulline. Anal. Biochem. 286, 257–264 (2000).
Lindgren, J. K. et al. Arginine deiminase in Staphylococcus epidermidis functions to augment biofilm maturation through pH homeostasis. J. Bacteriol. 196, 2277–2289 (2014).
Rudra, P. & Boyd, J. M. Metabolic control of virulence factor production in Staphylococcus aureus. Curr. Opin. Microbiol. 55, 81–87 (2020).
Liu, H. et al. Influence of (p)ppGpp on biofilm regulation in Pseudomonas putida KT2440. Microbial. Res. 204, 1–8 (2017).
Monk, I. R. et al. Complete bypass of restriction systems for major Staphylococcus aureus lineages. mBio 6, e00308-15. https://doi.org/10.1128/mBio.00308-15 (2015).
Arnaud, M., Chastanet, A. & Debarbouille, M. New vector for efficient allelic replacement in naturally nontransformable, low-GC content Gram-positive bacteria. Appl. Environ. Microbiol. 70, 6887–6891 (2004).
Wade, J. T. et al. Genome analysis of LexA binding reveals the permissive nature of the E. coli genome and identifies unconventional target sites. Gene Dev. 19, 2619–2630 (2005).
Anders, S. et al. Count-based differential expression analysis of RNA sequencing data using R and Bioconductor. Nat. Protoc. 8, 1765–1786 (2013).
Cramton, S. E. et al. The intercellular adhesion (ica) locus is present in Staphylococcus aureus and is required for biofilm formation. Infect. Immun. 67, 5427–5433 (1999).
Acknowledgements
This work was supported by NIH grant RO1 AI146116 to ALC and Cystic Fibrosis Foundation grant 003163G221 to ACM. The funders had no role in study design, data collection and interpretation, or the decision to submit the work for publication. The authors want to thank Dr. Michael Otto, NIH, for providing anti-PIA antibodies. We also thank Dr. Junho Cho, Stephen K. Costa, and Liviu Cengher for their helpful discussion and advice. The authors acknowledge the Genomics and Molecular Biology Shared Resources at the Norris Cotton Cancer Center at Dartmouth, and the Vermont Genetics Network (VGN) funded by NIGMS or NIH.
Author information
Authors and Affiliations
Contributions
A.C.M.: research design, experiments, analysis, data interpretation, preparation of Figures and Tables, and manuscript writing. A.C.: data interpretation, and contributed to manuscript writing and editing S.L. and P.F.: analyzed RNA-Seq results S.G., V.G-R., and S.R. : performed and analyzed UHPLC-MS/MS determination of l-arginine, l-citrulline.
Corresponding author
Ethics declarations
Competing interests
The authors declare no competing interests.
Additional information
Publisher's note
Springer Nature remains neutral with regard to jurisdictional claims in published maps and institutional affiliations.
Supplementary Information
Rights and permissions
Open Access This article is licensed under a Creative Commons Attribution 4.0 International License, which permits use, sharing, adaptation, distribution and reproduction in any medium or format, as long as you give appropriate credit to the original author(s) and the source, provide a link to the Creative Commons licence, and indicate if changes were made. The images or other third party material in this article are included in the article's Creative Commons licence, unless indicated otherwise in a credit line to the material. If material is not included in the article's Creative Commons licence and your intended use is not permitted by statutory regulation or exceeds the permitted use, you will need to obtain permission directly from the copyright holder. To view a copy of this licence, visit http://creativecommons.org/licenses/by/4.0/.
About this article

Cite this article
Manna, A.C., Leo, S., Girel, S. et al. Teg58, a small regulatory RNA, is involved in regulating arginine biosynthesis and biofilm formation in Staphylococcus aureus. Sci Rep 12, 14963 (2022). https://doi.org/10.1038/s41598-022-18815-3
Received:
Accepted:
Published:
DOI: https://doi.org/10.1038/s41598-022-18815-3
Comments
By submitting a comment you agree to abide by our Terms and Community Guidelines. If you find something abusive or that does not comply with our terms or guidelines please flag it as inappropriate.
