
Abstract
Radioactive gas of Unit 1 of the Fukushima Daiichi Nuclear Power Station was released from the exhaust stack shared by Units 1 and 2 through the venting line on March 12th, 2011. In the present study, radiochemical analysis of drain water sampled at the drain pit of the exhaust stack was conducted to study radionuclides released during venting of the Unit 1. Not only volatile 129I, 134Cs and 137Cs but also 60Co, 90Sr, 125Sb and Unit 1-originated stable Mo isotopes were detected. Although Unit 1-originated stable Mo isotopes were clearly detected, their amounts were quite low compared to Cs, suggesting that the formation of Cs2MoO4 was suppressed under the accident condition. Approximately 90% of iodine existed as I− and 10% as IO3− in November 2020. Furthermore, larger amount of 129I than 137Cs was observed, suggesting major chemical form of 131I was molecular iodine rather than CsI at the accident time. The 134Cs/137Cs radioactivity ratio decay-corrected to March 11th, 2011 was 0.86, supported the results that Unit 1 originated radiocesium in environment has smaller 134Cs/137Cs radioactivity ratio than Unit 2 and 3 originated radiocesium.
Introduction
Because of the tsunami caused by The Great East Japan Earthquake, TEPCO’s Fukushima Daichi Nuclear Power Station (FDNPS) lost all electric power, followed by the severe accidents at Units 1, 2, and 3. The accident progression has been analyzed by many researches with emphasis on the thermal-hydraulics in the OECD/NEA projects such as Benchmark Study of the Accident at the Fukushima Daiichi Nuclear Power Station (BSAF)1,2,3,4,5,6,7,8 and Analysis of Information from Reactor Buildings and Contaminant Vessels of Fukushima Daiichi Nuclear Power Station (ARC-F). In addition, fission products (FPs) release, distribution of FPs in all over the plant, and source term to environment are also the topics treated in the projects. However, there are still many uncertainties such as a type of leakage, event timings, and chemical species of FPs due to lack of complete data to input calculation codes.
In order to reduce uncertainties concerning assessments of severe accidents, VERDON tests were performed at the CEA Cadarache Centre in which high burn-up UO2 and MOX fuels were heated in a furnace under various conditions to investigate FPs release and transportation9,10,11,12,13. The results indicated a rapid release kinetics for volatile (I, Cs, Te) and even for semi-volatile (Mo, Ba) FPs during oxidizing condition and re-volatilization of iodine during air injection on the contrary to Cs. Transportation of FPs are affected by not only atmosphere and temperature conditions but also chemical species. While many source term studies have assumed Cs chemical form as CsI and CsOH, recent studies pointed out possible formation of Cs2MoO45,6,7,14,15,16,17,18, CsBO219, Cs2CrO419,20, Cs2Si4O919, and CsAlSiO421. The formation of these chemical species would be related to the leakage pathways since some reports indicated the production of Cs2Si4O9 and CsAlSiO4 via chemisorption of Cs onto stainless steel and reaction with concrete22,23. Furthermore, the production of Cs2Si4O9 and CsAlSiO4 is possibly related to the Cs-bearing microparticle found in environmental samples after the FDNPS accident24,25,26.
There are many reports related to the distribution of 134,135,136,137Cs, 129,131I, 90Sr, 110mAg and 132Te in environment caused by the accident at the FDNPS27,28,29,30,31,32,33,34. The measured radionuclides concentrations were compared with those calculated by atmospheric transport and deposition model (ATDM) to estimate the atmospheric release of radionuclides during the FDNPS accident27. The detailed analysis of 134Cs/137Cs radioactivity ratio of the deposition indicated which reactor unit ultimately contaminated a specific area: while the contamination of most continental areas was caused by Units 2 and 3, the contamination of the northwest part near FDNPS was caused by Unit 1 because the 134Cs/137Cs radioactivity ratio was slightly lower than those in the other parts27,28,29. Furthermore, slight difference in the 135Cs/137Cs isotope ratio was reported for the area mainly contaminated by Unit 131. Source term information is important to improve such analysis.
Recently, radiochemical analysis of samples collected inside of FDNPS buildings has been planned to improve severe accident analysis and source term. In the present study, drain water sampled at the drain pit of the exhaust stack shared by Units 1 and 2 was analyzed to obtain the information about components and chemical species of radionuclides released by vent of Unit 1. Cesium-134,137 and 131I are the important FPs of severe accident analysis because of their relatively high volatile and radioactivity. However, 131I was decayed out due to its short half-life (8.0 d). Therefore, 129I which has long half-life (1.57 × 10⁷ y) was measured to estimate the behavior of 131I.32,33 In addition, Mo isotopes and 99Tc, daughter nuclide of 99Mo, were analyzed because Mo was prone to be released as Cs2MoO4 when the reactor vessel was under oxidizing condition with sufficient water vapor. Furthermore, lower volatile FPs (90Sr and 152,154Eu) and actinide (Th, U, Pu, and Am) were analyzed to investigate the release of them as aerosols generated in reactor vessel and Molten Core Concrete Interaction.
Materials and analysis method
Drain water
The sampling point was illustrated in Fig. 1. In the vent operation, the gas in the contaminant vessel was passed through the suppression chamber to reduce the radioactivity, and then, released into environment via stand by gas treatment system pipe and exhaust stack. The exhaust stack was shared by Units 1 and 2. It is considered that the vent of Unit 2 was failed since outflow side of the rupture disk in the vent line of Unit 2 was not contaminated, and the inside of the exhaust stack was mainly contaminated by vent of Unit 1. It is presumed that dew condensation water and rainwater in the stack were accumulated in the drain pit. Drain water was sampled in September 12, 2016. Salinity and pH of the drain water were preliminary measured using salinometer and pH test paper, and they were 0.01% and neutrality.
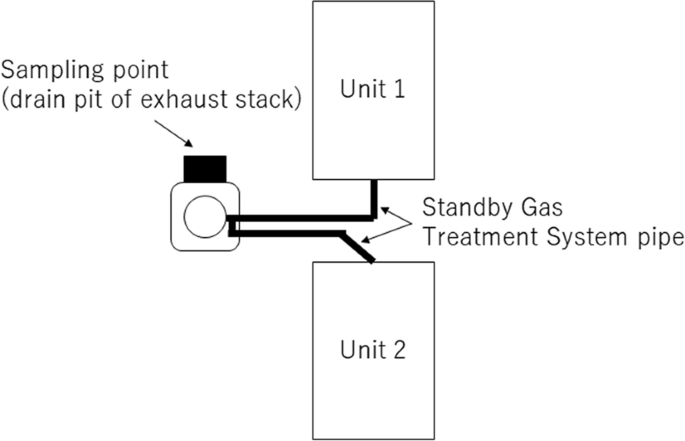
Diagrammatic illustration of the sampling point.
Analysis of γ-emitting nuclides
γ-Ray spectra were measured by a Ge semiconductor detector (GC1020S-CJT-F-1/S-2002C, Mirion Technologies Canberra). Energy and efficiency of the γ-ray spectrum were calibrated using a mixed standard source of 60Co, 133Ba, and 137Cs, which was prepared as a filter paper (Amersham plc, UK). Therefore, the sample for quantitative analysis of drain water was prepared by transfusing 30 μl of sample solution into a filter paper to be the same sample form. The filter paper was doubly sealed in plastic bags. First, measurement of 134Cs and 137Cs was conducted on the drain water as it was. After that, the measurement of the nuclides excluding 134Cs and 137Cs, such as 60Co, 106Rh (daughter nuclide of 106Ru), 125Sb, and 152Eu, was conducted after Cs was eliminated using ammonium phosphomolybdate (AMP) because γ-rays from the other nuclides were considered to be hidden by the higher level of radioactivity of 134Cs and 137Cs in the drain water. The amount of AMP, HNO3 concentration and standing time were optimized to eliminate Cs and to remain the other elements before analysis of the drain water. Sample solutions for the optimization were prepared by diluting the standard solutions of B, Na, Mg, Al, Ca, Mn, Fe, Co, Ni, Se, Rb, Sr, Y, Zr, Mo, Ru, Rh, Ag, Sn, Sb, Te, Cs, Ba, Eu, Re (1 mg/ml solutions purchased from Fujifirm Wako Chemical CO.INC., Kanto Chemical CO.,INC., and Merck) and of Nb (0.1 mg/ml solution purchased from Accu Standard). Based on the optimization, 5 μl of standard solutions of Co, Se, Sr, Ru, Rh, Sb, Cs, Eu and Re (1 mg/ml) were added to 5 ml of drain water and HNO3 concentration was adjusted to 2 M. The drain water sample solution was stood for overnight. After the addition of 0.02 g of AMP to the drain water sample solution, it was stirred for 1 h. AMP was filtered using a syringe and a membrane filter unit of which pore size was 0.45 μm. The filtrate was assigned as Cs-eliminated drain water, and quantitative analysis of γ-ray emitting nuclides was conducted. Furthermore, γ-ray spectra of the Cs-eliminated drain water in a bottle (approximately 5.7 ml) were recorded for the qualitative analysis.
Analysis of 90Sr
Five μl of Cs standard solution was added to the Cs-eliminated drain water, and then, the Cs elimination procedure using AMP was repeated one more time with the same manner of the first time. The obtained filtrate was assigned as the twice Cs-eliminated drain water. 0.1 ml of the twice Cs-eliminated drain water was taken into a bottle, and HNO3 and pure water were added to prepare 2 ml of 8 M HNO3 sample solution. This was assigned as DW-Sr sample.
0.5 ml of the Sr resin (Eichrom Technology, LLC) swollen with ultrapure water was packed into a column and conditioned by passing through 5 ml of 8 M HNO3. Next, the DW-Sr sample was loaded into the column. The bottle which had contained DW-Sr sample was rinsed with 0.5 ml of 8 M HNO3 4 times and all rinse solutions were loaded into the column. After that, 2.5 ml of 8 M HNO3 was passed through the column 4 times. The extracted Sr was recovered by passing through 3 ml of 0.01 M HNO3. 0.2 ml of the recovery solution was sampled and mixed with 1.8 ml of 1 M HNO3 to measure Sr concentration with inductively coupled plasma mass spectrometer, ICP-MS, (Agilent 7700, Agilent Technologies Japan, Lts), and the recovery rate during chemical separation was evaluated. Ultima Gold LLT (PerkinElmer) was added to the remaining recovery solution, and β-ray spectrum was measured with liquid scintillation counter (PerkinRlmer Tri-Carb 3110TR) after reaching radioactive equilibrium between 90Sr and 90Y. Efficiency was corrected by a calibration curve obtained from the measurement of standard samples containing 20 Bq of 90Sr and 90Y, various concentration of HNO3 and Ultima Gold LLT.
Analysis of 99Tc
Aliquot of the twice Cs-eliminated drain water was adjusted to approximately 5 ml of 1 M HNO3 solution (DW-Tc). 0.5 ml of the TEVA resin (Eichrom Technology, LLC) swollen with ultrapure water was packed into a column and conditioned with 1 M HNO3. The DW-Tc was loaded into the TEVA resin column. The bottle which had contained DW-Tc sample was rinsed with ultrapure water 3 times and all rinse solutions were loaded into the column. After that, 2.5 ml of ultrapure water was passed through the column 4 times. The extracted Tc was recovered by passing through 1.5 ml of 8 M HNO3. The recovery solution was appropriately diluted to measure Re with ICP-MS. The remaining recovery solution was also appropriately diluted and mixed with Ultima Gold LLT to measure β-ray of 99Tc with liquid scintillation counter (PerkinElmer Tri-Carb 3110 TR).
Analysis of Mo isotopes
Molybdenum isotopes (mass number 92, 94, 95, 96, 97, 98 and 100) in a Mo standard solution (0.5 ng/mL, this solution was prepared by diluting a standard solution of 1 mg/ml of Mo, Fujifilm Wako Chemical Co. INC.) was measured using ICP-MS (Agilent 7700) and Sector field ICP-MS (Element 2, Thermo Fisher Scientific Co.) to study the effect of mass discrimination on the isotope ratios obtained by ICP-MS measurement. Reference values of the isotope ratio to 98Mo, Rtrue, were divided by those of measured, Rmeas, and plotted against the mass difference of the isotope of interest from 98Mo, Δm.
Previously, separation method for Mo using a TEVA resin was developed to purify Mo from rubble samples35. Because the dissolved solution of the rubble sample contained large amount of Fe3+ and Cr6+, which compete with Mo extraction on the TEVA resin, ascorbic acid was added to the sample solution to decrease their extraction by reducing to Fe2+ and Cr3+. In addition, HF was added to the sample solution to avoid precipitation of Nb. However, influence of Fe, Cr, and Nb in the drain water is negligible due to lower concentration of them. Therefore, sample solution of the drain water to load the TEVA resin was adjusted to 4 M HCl using ultrapure grade HCl solution (31%, Kanto Chemical Co.,INC.), and the solution was assigned as DW-Mo sample. 0.5 ml of the TEVA resin swollen with ultrapure water was packed into a column, followed by washing with 5 ml of 1 M HNO3, 3.4 ml of ultrapure water, and 2 ml of 4 M HCl. Then, 5 ml of the DW-Mo sample was loaded into the column. The bottle which had contained DW-Mo sample was rinsed with 0.5 ml of 4 M HCl 3 times and all rinse solutions were loaded into the column. Next, the column was rinsed with 3.4 ml of 4 M HCl and 0.5 ml of ultrapure water. Finally, extracted Mo was recovered by passing through 2.5 ml of 1 M HNO3. As an operation blank solution, 4 M HCl solution was prepared and the same separation operation was carried out. Recovered Mo isotopes were measured with sector field ICP-MS. Net count rates of Mo isotopes for drain water were obtained by subtracting the measured count rates of Mo isotopes for the operation blank solution from those for the drain water. Whereas, net count rates of Mo isotopes for Mo standard solution, 0.5 ng/ml, were obtained by subtracting the measured count rates for 1 M HNO3 solution from those for the Mo standard solution.
Analysis of 129I− and 129IO3 −
It was reported that I− was extracted on the solid extraction disk, Anion-SR (Empore disk, 3 M Co.), from 3 M NaOH solution, and I− and IO3− were extracted on the Anion-SR from 0.01 M HCl containing 0.1 M NaHSO3 because IO3− was reduced to I− by NaHSO3 in diluted HCl solution36,37. In the present study, 0.5 ml of drain water was adjusted to 5 ml of 2.5 M NaOH solution to analyze I− and to 5 ml of 0.01 M HCl solution containing 0.01 M K2S2O5 to analyze the sum of I− and IO3−. Instead of NaHSO3, K2S2O5 was used because NaHSO3 is unstable in a solid state, and formula number of Na2SO3, 126, is close to mass number of stable iodine, 127. As spike samples, a known amount (approximately 50 pg, “a” in the Eqs. (1) and (2)) of 127I− or 127IO3− was added to the drain water in the same solution conditions. In addition, 2.5 M NaOH solution and 0.01 M HCl solution containing 0.01 M K2S2O5 were also prepared as blank samples. The I− or the sum of I− and IO3− were purified by Anion-SR using the reported method36,37. Briefly, Anion-SR was sequentially conditioned with 10 ml of acetone, 10 ml of methanol, 10 ml of pure water, 10 ml of 1 M HNO3 and 30 ml of pure water. Next, the sample solution was loaded to the Anion-SR, and then, it was rinsed with 5 ml of pure water 6 times. Finally, extracted I− was recovered 9.5 ml of 1 M HNO3. A known amount of Cs was added into the purified I− or (I− + IO3−) solutions as an internal standard and a known amount of NaClO was added to uniform the chemical species to IO3− and to stabilize iodine in 1 M HNO3 solution. The concentrations of 127I (“x” in Eq. (1)) and 129I (“y” in Eq. (2)) were measured by using ICP-MS (Agilent 7700). The amounts of 127I and 129I were calculated by using Eqs. (1) and (2), respectively.
where A and B were the measured amounts of 127I and 129I in a sample solution, respectively, A’ and B’ were the measured amounts of 127I and 129I in the spike sample solutions, respectively, and a was spiked amount of 127I. The amounts of x and y were obtained for chemical species of I− and the sum of I− and IO3−, and the amount of IO3− was calculated by subtracting the amount of I− from that of the sum of I− and IO3−.
Measurement of stable isotopes, Th and U in drain water
The drain water was diluted 200 times with 1 M HNO3 and the concentrations of 59Co, 77,82Se, 88Sr, 99Tc, 101Ru, 103Rh, 121Sb, 133Cs, 153Eu, 185Re, 232Th and 238U in the drain water were determined using ICP-MS (Agilent 7700) by calibration curve method.
Measurement of Pu and Am
One (1) ml of the drain water was adjusted to 2 ml of 1 M HNO3 solution containing 0.1 M NaNO2 and assigned as DW-PuAm sample. Pulutonium-242- or 243Am-spiked drain water sample was prepared as the same manner and assigned as Pu-DW-PuAm and Am-DW-PuAm samples, respectively. 0.5 ml of TRU resin (Eichrom Technology, LLC) swollen with ultrapure water was packed into a column and conditioned with 1 M HNO3. Then, the sample solution was loaded into the column. The bottle which had contained the sample was rinsed with 1 M HNO3 3 times and all rinse solutions were loaded to the column. The column was rinsed with 3.4 ml of 1 M HNO3. Extracted Am was recovered with 3.4 ml of 4 M HCl, and next, extracted Pu was recovered with 3.4 ml of 4 M HCl containing 0.02 M TiCl3. 0.3 ml of Sm solution (1 mg/ml) and 1 ml of HF were added to the recovery solutions of Am and Pu to precipitate AmF3 and PuF3 with SmF3. The micro precipitate was collected on PTFE membrane filter and dried with a little amount of ethanol. The filter was fixed with double-stick tape on a stainless-steel dish to subject to the measurement by α-ray spectrometer (α-Ray Detector BU-020-450-AS0, α-Ray Module SOLOIST,SEIKO EG&G ORTEC). The recovery rate of the micro precipitate was normalized with the recovery of 147Sm, which is a natural alpha-emitting radioisotope (half-life: 1.06 × 10¹¹ y, alpha energy: 2.2476 MeV).
Results
Analysis of γ-emitting nuclides
Before the Cs elimination from the drain water using AMP, the solution condition and AMP amount were optimized to remove Cs so that the other elements remained (Supporting Table 1 and 2), 99.9% of Cs was removed with 0.01 g of AMP from 10 ml of 1 M HNO3 containing 1 μg/ml of B, Na, Mg, Al, Ca, Mn, Fe, Co, Ni, Se, Rb, Sr, Y, Zr, Mo, Ru, Rh, Ag, Sn, Sb, Te, Cs, Ba, Eu and Re, and 0.1 μg/ml of Nb. Most elements remained in the solution although the rates of remaining Rb and Ag were low and those of Zr, and Nb decreased with increasing AMP amount. The concentration of Mo in the solution was increased to dozens of μg/ml because Mo in the AMP was dissolved to the solution. Remaining rates of metal ions were also affected by HNO3 concentration. Increment of HNO3 concentration tends to enhance remaining rates of metal ions. Although Zr and Nb hardly remained in 0.1 M HNO3, 94% and 67% of Zr and Nb, respectively, remained in 2 M HNO3. Therefore, 2 M HNO3 condition was selected so that larger amount of Zr and Nb remain in the solution. Furthermore, the rate of remaining Sb depended on the standing time after preparation of sample solution. Although Sb existed as SbCl3 in the standard solution, it could be changed to Sb5+ in the oxidizing solution, 2 M HNO3, to remain in the filtrate. It seemed that a part of Sb3+ was captured by AMP but Sb5+ remained in the solution. Therefore, drain water was stood for overnight after adding acid and carrier to wait for the oxidization of Sb3+ to Sb5+.
Figure 2 shows the γ-ray spectra for (a) quantitative analysis of drain water, (b) quantitative analysis of Cs-eliminated drain water, and (c) qualitative analysis of Cs-eliminated drain water. Only peaks of 134Cs and 137Cs were observed in spectrum (a) except those of natural background nuclides and backscattering. The concentrations of 134Cs and 137Cs were 2.4 × 10³ and 4.8 × 10⁴ Bq/ml, respectively. When the radioactivity was decay-corrected to March 11, 2011, they were (5.1 ± 0.02) × 104 and (5.9 ± 0.007) × 104 Bq/ml, respectively, and the 134Cs/137Cs radioactivity ratio was 0.86 ± 0.01.

Gamma-ray spectra of drain water and Cs eliminated drain water. Sample solution (30 μl) was transfused into filter paper for quantitative analysis, (a) and (b). Sample solution in a bottle was measured for quantitative analysis, (c).
The concentration of 137Cs was decreased to 63 Bq/ml for the Cs-eliminated drain water, and peaks of 125Sb showed up. The concentration of 125Sb in the drain water was 14 Bq/ml. It is reported that Sb was released by the oxidation of LWR fuel cladding by steam38. While not only 125Sb but also 60Co were observed for the qualitative analysis of the Cs-eliminated drain water, the concentration of 60Co were less than its detection limit for quantitative analysis, 0.7 Bq/ml, due to a small amount of sample, 30 μl.
Analysis of β-emitting nuclides
Figure 3 shows the liquid scintillation spectrum of the Sr measurement sample separated from DW-Sr sample. The spectrum consists of β-rays emitted from 90Sr and 90Y. The maximum energies were shifted to lower energy side because of chemical quenching due to HNO3. Recovery rate of Sr for chemical separation was (92 ± 8)%. The obtained 90Sr concentration was (47 ± 4) Bq/ml at the measurement time, and (55 ± 5) Bq/ml at the time point of the accident at the FDNPS.
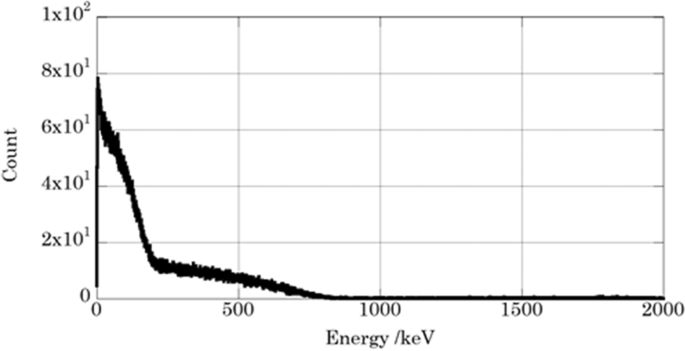
Liquid scintillation spectrum of 90Sr-90Y for the drain water after separation and reached radioactive equilibrium.
There is no stable Tc isotope. Because Re and Tc tend to form ReO4− and TcO4−, respectively, and show similar behavior, Re was used as a carrier of Tc. The recovery rate of Re after all chemical separation processes was 99.5%, and this result supports that the chemical separation procedure is suitable for the 99Tc separation. However, the concentration of 99Tc in the drain water was less than detection limit, 0.012 Bq/ml.
Analysis of iodine species
In this study, organic and molecular iodine were not measured because they seemed to be vaporized during long period until sampling and analysis on September 12th, 2016, and on November 17-18th, 2020, respectively. Furthermore, it was reported that the largest fraction of the radioiodine present in BWR condensate was found to be I−39, and molecular I2 was hydrolyzed and disproportionated in water to produce I− and IO3−40. Therefore, these species were considered dominant species and measured. Table 1 shows the concentrations of iodine species in the drain water. As the total inorganic iodine, 20 ± 3 and 21 ± 2 ng/ml of 127I and 129I, respectively, were obtained and the values were the same order of the reported 129I concentration in the accumulated water before treatment36. It was estimated that the amounts of 127I and 129I in Unit 1 core were 2.14 × 10³ and 9.44 × 10³ g/core, respectively41, whereas reported 127I concentrations in the rainwater collected from Fukushima prefecture were a few ng/ml level42. Therefore, 127I in the drain water is considered a mixture of Unit 1-originated 127I and rainwater-originated 127I. Although the chemical form might be changed until the analysis and measurement, most iodine was observed as I− in the present time; approximately 90% of iodine was I− and 10% was IO3− in both isotopes. In case of the seawater collected at the offshore Fukushima on June 3-17th, 2011, the I−/IO3− ratio for 129I different from that for nature-originated 127I was observed; the 129I originated from FDNPS existed mainly as I− form but nature-originated 127I mainly as IO3− form43. However, our result shows similar I−/IO3− ratio for both isotopes, indicating isotope exchange reaction reached equilibrium.
Analysis of Mo isotopes
Stable Mo isotopes of which mass number 95, 97, 98, 100, have high fission yield, 6.497, 6.045 5.701, and 6.579%, respectively44. Furthermore, it was reported that Mo and Cs showed similar distribution within the corium after heating of MOX fuel at 2620℃ with hydrogen and steam condition, suggesting the formation of Cs2MoO445. Therefore, Mo is an important element to consider chemical form of radiocesium.
Mass discrimination effect was evaluated to measure Mo isotope ratios precisely. Figure 4 shows the relationship between (Rtrue/Rmeas) ratio and Δm for the measurement of Mo standard solution using Agilent 7700 and Element 2 with relational expression. Noticeable mass discrimination effect was observed for the measurement using Agilent 7700, suggesting that the isotope ratios should be corrected by the mass discrimination factor obtained from the slope of the relational expression. On the other hand, mass discrimination effect for Element 2 was relatively small, and their dispersion was less than 1.5%. Therefore, Mo isotopes in the drain water sample was measured by Element 2 and the obtained isotope ratio was used without correction in this study.
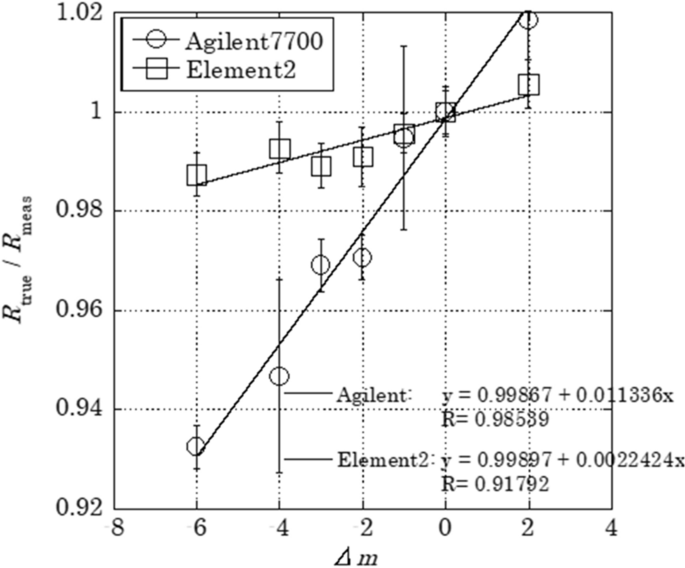
Relationship between mass difference (Δm) and ration of true isotope ratio to measured value (Rtrue/ Rmeas).
Table 2 shows the Mo isotope ratios in the Mo standard solution and the drain water after separation using the TEVA resin. In addition, the isotope ratios of Mo generated in the Unit 1 were estimated by ORIGEN code41,44. Isotope ratios for the Mo standard solution after separation using TEVA resin agreed with those of natural isotope ratios, indicating isotope effect is negligible during the chemical separation, whereas Mo isotope ratios for drain water was different from the natural isotope ratios and those originated from Unit 1. It is considered that nature-originated Mo and Unit 1-originated Mo were mixed in the drain water. Molybdenum-92 in the drain water is considered nature-originated isotope because the fission yield of 92Mo is approximately 10 order magnitude lower than those of 95,97,98,100Mo44. Then, count rates of nature-originated Mo isotopes in the drain water were calculated from the count rate of 92Mo and natural isotope ratio. Next, count rates of Mo isotopes originated from Unit 1 were calculated by subtracting the calculated count rates of nature-originated Mo in the drain water from the measured count rates of Mo isotopes for the drain water. Molybdenum isotope ratios originated from Unit 1 in the drain water were calculated and listed in Table 2. They were roughly agreed with those calculated by ORIGEN code, indicating that the drain water contains Unit 1-originated Mo isotopes. This is the first measurement result of the stable Mo isotopes released from FDNPS. The concentrations of the total Unit 1-originated stable Mo and nature-originated Mo in the drain water were 0.13 and 0.82 μg/L, respectively. Considering that it is reported that sub-μg/L quantities of Mo are expected in rainwater46, main source of nature-originated Mo in the drain water is probably rainwater.
Analysis of Th, U, Pu and Am
Thorium and U were not detected. The limit of detection of ICP-MS measurement for Th and U were 0.0006 and 0.0013 ng/mL, respectively, and this means that the concentrations of Th and U in the drain water were less than 0.12 and 0.25 ng/mL, respectively, because the drain water was diluted 200 times for the measurement. Also, Pu and Am were not detected in the drain water. Here, the recovery rates for Pu and Am obtained from the analytical results of 242Pu or 243Am-spiked drain water samples were 93% and 101%, respectively, and the limits of detection for 242Pu and 243Am were both 0.002 Bq.
Discussion
Mole ratios of determined isotopes
The measured radioactivity concentrations of target nuclides in the drain water were decay-corrected to the time point of the accident at FDNPS, March 11th, 2011, and then, the radioactivity ratios of the target nuclides to 137Cs were calculated (see Table 3).
TEPCO and some researchers reported radioactivity concentrations of 134Cs and 137Cs in stagnant water in the FDNPS47,48,49. The 134Cs/137Cs radioactivity ratios for stagnant water of Unit 1 decay-corrected to March 11th, 2011 were varied from 0.89 to 0.97 and the averages reported by Komori et al. and Nishihara et al. were 0.93 ± 0.03 and 0.92 ± 0.02, respectively. Furthermore, the radioactivity ratio reported by Komori et al. was 0.91 ± 0.2 for the stagnant water sampled before October, 22th 2011 to avoid mixture of stagnant water from Unit 2 due to transportation of stagnant water from Unit 1 to Unit 2. Our value, 0.86, is slightly smaller than these reported values. It is reported that neutron spectrum and flux are not uniform throughout a reactor core50,51. In consequence, variety occurs in the Cs isotopic composition as a function of location within the core: the upper side had smaller 134Cs/137Cs radioactivity ratio. In addition, Snow et al. suggested that (i) when power excursion and/or loss of coolant happened rapidly, Cs isotope ratio would be similar to total core ratio, ii) when coolant loss happened gradually over the course of minutes to hours, radiocesium component would be changed51. Compare to the variety of Cs isotope composition in reactor core, the difference in the obtained 134Cs/137Cs radioactivity ratios is small and close to the ratio in the Unit 1 core. Therefore, power excursion and/or loss of coolant is possibly happened rapidly.
The measured 134Cs/137Cs radioactivity ratio for stagnant water of Unit 1 was clearly smaller than those for the stagnant water of Units 2 and 3 (1.00 ± 0.03), and clearly smaller 134Cs/137Cs radioactivity ratio was observed at north-northwest site near FDNPS and Oshika Peninsula27,28,29,48. Although released amounts of radionuclides by vent operation of the Unit 1 was estimated smaller than those by explosion, the 134Cs/137Cs radioactivity ratio could become an index for the source term analysis.
The 90Sr/137Cs radioactivity ratio in the drain water on March 11th, 2011 is calculated to be 9.3 × 10⁻⁴. Nishihara et al. and Asai et al. reported 90Sr radioactivity in the stagnant water of Unit 1 collected on 24th and 27th of March 201149,52. The calculated 90Sr/137Cs radioactivity ratio on 11th of March from the reported values was 1.3 × 10⁻⁴, which is one order magnitude lower than that of the drain water. On the other hand, the 90Sr/137Cs radioactivity ratio for rubble collected at the 1st floor of Unit1 on October 2013 and at just outside of Unit 1 on June 25th, 2012 and July 26th and 27th, 2012 was 1.5 × 10⁻³–5.0 × 10⁻³ and 1.4 × 10⁻³–5.6 × 10⁻³, respectively53,54, and these values were close to our value. In addition, it is reported that 90Sr concentration in the accumulated water increased gradually over time and reached almost comparable to 137Cs concentration in early 201255. Since transportation process of 90Sr during accident and after accident would be different, the sampling location and time should be noted for consideration. This complicated transportation processes of Sr may cause wide variation of 90Sr/137Cs radioactivity ratio for environmental samples56,57,58,59.
In order to discuss the chemical form of radiocesium, mole ratio is important rather than radioactivity ratio. Therefore, radioactivity concentrations were converted to mole concentrations, and the mole concentrations of the target nuclides were divided by the mole concentration of 137Cs to obtain their mole ratios to 137Cs. It is considered that the radionuclides in the drain water were originated from vent operation of the Unit 1. Therefore, the amounts of radionuclides in the Unit 1 core were considered as original inventory. The mole ratios of the target nuclides to 137Cs in the Unit 1 core were calculated by using the reported values of ORIGEN calculation and listed in Table 3. Furthermore, the mole ratios to 137Cs obtained from the measurement were divided by the mole ratios to 137Cs obtained from ORIGEN calculation (hereafter referred to as the ratio of drain water to Unit 1 core ratios). These results are summarized in Table 3. The order of ratios of the drain water to Unit 1 core ratios was 129I > 137Cs≈134Cs > 125Sb > Mo > 90Sr. It is reported that Mo release increased under oxidizing conditions with sufficient water vapor inside reactor core through the formation of volatile species60. However, the amount of Mo was quite low compared to that of Cs in the case of this study, suggesting that the formation of Cs2MoO4 had been suppressed under steam-starved conditions.
Based on the ORIGEN calculation, isotope mole ratio of 129I to the total I and 137Cs to the total Cs in Unit 1 core were calculated to be 78.69% and 40.27%, respectively, at the accident time41 From the isotope mole ratio and measured concentration of 129I and 137Cs in the drain water, the concentration of the total I and the total Cs were calculated to be 2.1 × 10⁻¹⁰ and 3.4 × 10⁻¹⁰ mol/ml, respectively, and the ratio of the total I to the total Cs was 0.6 in the drain water. Compared to the ratio of the total I to the total Cs in the Unit1 core, 0.08, the ratio in the drain water was approximately one order magnitude larger. This trend implies that major chemical form of I was molecular I rather than CsI.
Conclusion
In order to study the behavior of radionuclides released during venting of Unit 1 at FDNPS, radiochemical analysis was conducted for the drain water sampled from the drain pit of the exhaust stack shared between Units 1 and 2.
Although γ-ray spectra of the drain water showed only peaks related to 134Cs and 137Cs, 60Co and 125Sb were detected after elimination of radiocesium using ammonium phosphomolybdate. The decay-corrected 134Cs/137Cs radioactivity ratio to March 11th, 2011 was 0.86.
In this study, Unit 1-originated stable Mo isotopes were clearly detected. Their amounts were quite low compared to Cs, suggesting that the formation of Cs2MoO4 was suppressed under the accident condition.
Inorganic iodine chemical forms in samples collected at the FDNPS were analyzed, and it was found that approximately 90% of iodine existed as I− and 10% as IO3− in the samples. Although it is a big subject to extrapolate the present result to accident time, the information related to the iodine chemistry was obtained for the first time.
The ratios of the mole concentration ratios of nuclides to 137Cs in the reactor core to those in the drain water was calculated: The order was 129I > 137Cs≈134Cs > 125Sb > Mo > 90Sr. The larger ratio for 129I implies that iodine was released as molecular iodine rather than CsI.
The results and information obtained from this study could be used as source terms to analyze contamination of environment, and would be applied for the accident analysis of Unit 1 at FDNPS to discuss chemical form of released radionuclides and reactor condition of the accident time.
Abbreviations
- FDNPS:
-
Fukushima Daiichi Nuclear, Power Station
- AMP:
-
Ammonium phosphomolybdate
References
Herranz, L. E. et al. Overview and outcomes of the OECD/NEA Phase 2: results of severe accident analysis for Unit 1. Nucl. Eng. Des. 369, 110849 (2020).
Sonnenkalb, M. et al. Overview and outcome of the OECD/NEA benchmark study of the accident at the Fukushima Daiichi NPS (BSAF), phase 2: results of the severe accident analysis for Unit 2. Nucl. Eng. Des. 369, 110840 (2020).
Lind, T. et al. Overview and outcome of the OECD/NEA benchmark study of the accident at the Fukushima Daiichi NPS (BSAF), phase 2 -Results of the severe accident analysis for Unit 3. Nucl. Eng. Des. 376, 111138 (2021).
Pellegrini, M., Naitoh, M., Kudo, Y. & Mizokami, S. Confirmation of severe accident code modeling in light of the findings at Fukushima Daiichi NPPs. Nucl. Eng. Des. 354, 110217 (2019).
Tamaki, H., Ishikawa J., Sugiyama, T., Maruyama, Y. Analysis for the accident at Unit 1 of the Fukushima Daiichi NPS with THALES2/KICHE code in BSAF2 project. Proceedings of 18th International Topical Meeting on Nuclear Reactor Thermal Hydraulics (NURETH-18). 2019, 72–82.
Tamaki, H., Ishikawa J., Sugiyama, T., Maruyama, Y. Analysis for the accident at Unit 2 of the Fukushima Daiichi NPS with THALES2/KICHE code in BSAF2 project. Proceedings of 18th International Topical Meeting on Nuclear Reactor Thermal Hydraulics (NURETH-18). 2019, 100–111.
Ishikawa J., Tamaki, H., Sugiyama, T., Maruyama, Y. Analysis for the accident at Unit 3 of the Fukushima Daiichi NPS with THALES2/KICHE code in BSAF2 project. Proceedings of 18th International Topical Meeting on Nuclear Reactor Thermal Hydraulics (NURETH-18). 2019, 536–547.
Song, J. H. & Kim, T. W. Severe accident issues raised by the Fukushima accident and improvements suggested. Nucl. Eng. Technol. 46(2), 207–216 (2014).
Pontillon, Y. et al. Fission products and nuclear fuel behavior under sever accident conditions part 1: main lessons learnt from the first VERDON test. J. Nucl. Mater. 495, 363–384 (2017).
Geiger, E. et al. Fission products and nuclear fuel behavior under sever accident conditions part 2: Fuel behavior in the VERDON-1 sample. J. Nucl. Mater. 495, 349–357 (2017).
Gall, C. L. et al. Fission product speciation in the VERDON-3 and VERDON-4 MOX fuels samples. J. Nucl. Mater. 530, 151948 (2020).
Gallais-During, A. et al. Overview of the VERDON-ISTP program and main insights from the VERDON-2 air ingress test. Ann. Nucl. Energy 101, 109–117 (2017).
Shiotsu, H., Ito, H., Ishikawa, J., Sugiyama, T., Maruyama, Y. Analysis of transport behaviors of cesium and iodine in VERDON-2 experiment for chemical model validation. Proceedings of 11th Korea-Japan Symposium on Nuclear Thermal Hydraulics and Safety (NTHAS-11) Busan, Korea, November 18–21, 2018.
Shiotsu, H., Ishikawa, J., Sugiyama, T. & Maruyama, Y. Influence of chemical speciation in reactor cooling system on pH of suppression pool during BWR severe accident. J. Nucl. Sci. Technol. 55(4), 363–373 (2018).
Knebel, K., Jokiniemi, J. & Bottomley, P. D. A review of revaporisation behavior of radioactive Cs deposit and its impact on the source term in sever nuclear accidents from Phebus FP results and single effect testing. J. Nucl. Sci. Technol. 56(9–10), 772–789 (2019).
Walles, G., Raison, P. E., Smith, A. L., Clavier, N. & Dacheux, N. High-temperature behavior of dicesium molybdate Cs2MoO4: Implications for fast neutron reactors. J. Solid State Chem. 215, 225–230 (2014).
Dubourg, R., Faure-Geors, H., Nicaise, G. & Barrachin, M. Fission product release in the first two PHEBUS tests FPT0 and FPT1. Nucl. Eng. Des. 235, 2183–2208 (2005).
Gregoire, A. C. et al. Sutdies on the role of molybdenum on iodine transport in the RCS in nuclear severe accident conditions. Ann. Nucl. Energy 78, 117–129 (2015).
Miwa, S. et al. Development of fission product chemistry database ECUME for the LWR severe accident. Mech. Eng. J. 7(3), 19–00537 (2020).
Miyahara, N. et al. Experimental study on transport behavior of cesium iodine in the reactor coolant system under LWR severe accident conditions. J. Nucl. Sci. Technol. 57(12), 1287–1296 (2020).
Rizaal, M., Nakajima, K., Saito, T., Osaka, M. & Okamoto, K. Investigation of high-temperature chemical interaction of calcium silicate insulation and cesium hydroxide. J. Nucl. Sci. Thecnol. 57(9), 1062–1073 (2020).
Kobata, M. et al. Chemical form analysis of reaction products in Cs-adsorption on stainless steel by means of HAXPES and SEM/EDX. J. Nucl. Mater. 498, 687–394 (2018).
Maeda, K. et al. Distribution of radioactive nuclides of boring core samples extracted from concrete structure of reactor buildings in the Fukushima Daiichi Nuclear Power Plant. J. Nucl. Sci Technol. 51(7–8), 1006–1023 (2014).
Adachi, K., Kajino, M., Zaizenm, Y. & Igarashi, Y. Emission of spherical cesium-bearing particles from an early stage of the Fukushima Nuclear accident. Sci. Rep. 3, 2554. https://doi.org/10.1038/srep02554 (2013).
Igarashi, Y. et al. A review of Cs-bearing microparticles in the environment emitted by the Fukushima Dai-ichi Nuclear Power Plant accident. J. Environ. Radioact. 205–206, 101–118 (2019).
Furuki, G., Imoto, J., Ochiai, A., Yamasaki, S., Nanba, K., Ohnuki, T., Grambow, B., Ewing, R.C., Utsunomiya, S. Caesium-rich micro-particles: a window into the meltdown events at the Fukushima Daiichi Nuclear Power Plant. Sci. Rep. 2017, 1. doi:https://doi.org/10.1038/srep42731.
Chino, M. et al. Utilization of 134Cs/137Cs in the environment to identify the reactor units that caused atmospheric releases during the Fukushima Daiichi accident. Sci. Rep. https://doi.org/10.1038/srep31376 (2016).
Kobayashi, S., Shinomiya, T., Ishikawa, T., Imaseki, H., Iwaoka, K., Kitamura, H., Kodaira, S., Kobayashi, K., Oikawa, M., Miyashiro, N., Takashima, Y., Uchihori, Y. Low 134Cs/137Cs ratio anomaly in the north-northwest direction from the Fukushima Dai-ichi Nuclear Power Station. J. Environ. Radioact. 2017, 178–179. 84–94.
Mikami, S. et al. Spatial distribution of radionuclides deposited onto ground soil around the Fukushima Dai-ichi Nuclear Power Plant and their temporal change until 2012. J. Environ. Radioact. 139, 320–343 (2015).
Fujiwara, T. et al. Isotopic ratio and vertical distribution of radionuclides in soil affected by the accident of Fukushima Dai-ichi nuclear power plant. J. Environ. Radioact. 113, 37–44 (2012).
Shimada, A., Tsukahara, T., Nomura, M., Kim, M.S., Shimada, T., Takeda, S., Yamaguchi, T. Determination of 135Cs/137Cs isotopic ratio in soil collected near Fukushima Daiichi Nuclear Power Station through mass spectrometry. J. Nucl. Sci. Technol. Accepted.
Muramatsu, Y., Matsuzaki, H., Toyama, C. & Ohno, T. Analysis of 129I in the soils of Fukushima Prefecture: preliminary reconstruction of 131I deposition related to the accident at Fukushima Daiichi Nuclear Power Plant (FDNPP). J. Environ. Radioact. 139, 344–350 (2015).
Ebihara, M., Oura, Y., Shirai, N., Nagakawa, Y., Sakurai, N., Haba, H., Matsuzaki, H., Tsuruta, H., Moriguchi, Y. J. Environ. Radioact. 2019, 208–209, 106000.
Tagami, K., Uchida, S., Ishii, N. & Zheng, J. Estimation of Te-132 Distribution in Fukushima Prefecture at the Early stage of the Fukushima Daiichi Nuclear Power Plant reactor failure. Environ. Sci. Technol. 47, 5007–5012 (2013).
Shimada, A. et al. Development of a separation method for molybdenum from zirconium, niobium, and major elements of rubble samples. J. Chromatgr. A 1371, 163–167 (2014).
Shimada, A., Sakatani, K., Kameo, Y. & Takahashi, K. Determination of 129I in the accumulated radioactive water and processing water of the Fukushima Daiichi Nuclear Power Plant. J. Radioanal. Nucl. Chem. 303(2), 1137–1140 (2015).
Shimada, A., Ozawa, M., Kameo, Y., Yasumatsu, T., Nebashi, K., Niiyama, T., Seki, S., Kajio, M., Takahashi, K. Development of a rapid analytical method for 129I in the contaminated water and tree samples at the Fukushima Daiichi Nuclear Power Station. Nuclear Back-End and Transmutation Technology for Waste Disposal. 2015, 311–317.
Osborne, M. F., Collins, J. L., Lorenz, R. A., Norwood, K. S. Measuremnt and characterization of fission products released from LWR fuel. CONF-840914–28. 1984.
Lin, C. C. Chemical behavior of radioiodine in BWR systems. J. Inorg. Nucl. Chem. 42, 1093–1099 (1980).
Tigeras, A., Bachet, M., Catalette, H. & Simoni, E. PWR iodine speciation and behavior under normal primary coolant conditions: an analysis of thermodynamic calculations, sensibility evaluations and NPP feedback. Prog. Nucl. Energy 53, 504–515 (2011).
Nishihara, K. , Iwamoto, H., Suyama, K. Estimation of fuel composition in Fukushima-Daiichi nuclear power plant. Tokai-mura (Japan) Japan Atomic Energy Agency, 2012, JAEA-Data/Code 2012–018 [in Japanese].
Xu, A. et al. Iodine isotopes in precipitation: Four-year time series variations before and after 2011 Fukushima nuclear accident. J. Environ. Radioact. 155–156, 38–45 (2016).
Hou, X., Povinec, P. P., Zhang, L., Shi, K., Biddulph, D., Chang, C.-C., Fan, Y., Golser, R., Hou, Y., Jeskovsky, M., Jull, A.J.T., Liu, Q., Luo, M., Steier, P., Zhou, W. Iodine-129 in seawater offshore Fukushima: Distribution, inorganic speciation, sources, and budget. Environ, Sci. Technol. 2013, 47, 3091–3098.
Nuclear Data Center, Table of nuclear data, https://wwwndc.jaea.go.jp/NuC/index.html
Pontillon, Y. & Ducros, G. Behavior of fission products under sever PWR accident conditions The VERCORES experimental programme-Part 2: Release and transport of fission gases and volatile fission products. Nucl. Eng. Des. 240, 1853–1866 (2010).
Smedley, P. L. & Kinniburgh, D. G. Molybudenum in natural waters: a review of occurrence, distributions and controls. Appl. Geochem. 84, 387–432 (2017).
Tokyo Electric Power Company Holdings, Transition of radioactivity concentrations and air dose rate at the Fukushima Daiichi Nuclear Power Station. https://www.tepco.co.jp/nu/fukushima-np/images/handouts_111203_01-j.pdf. Accessed at 9th May 2021. In Japanese.
Komori, M., Shozugawa, K., Nogawa, N. & Matsuo, M. Evaluation of radioactive contamination caused by each plant of Fukushima Daiichi Nuclear Power Station using 134Cs/137Cs activity ratio as an Index. Bunseki Kagaku 62(6), 475–483 (2013) (In Japanese).
Nishihara, K. et al. Radionuclide release to stagnant water in the Fukushima-1 nuclear power plant. J. Nucl. Sci. Technol. 52(3), 310–307 (2015).
Guenther, R. J., Blahnik, D. E., Campbell, T. K., Jenquin, U. P., Mendel, J. E., Thomas, L. E., Thornhill, C. K. Characterization of spent fuel approved testing material – ATM-105. PNL-5109–105, 1991.
Snow, M. S., Snyder, D. C. & Delmore, J. E. Fukushima Daiichi reactor source term attribution using cesium isotope ratios from contaminated environmental samples. Rapid Commun. Mass Spectrom. 30, 523–532 (2016).
Asai, S., Okano, M. & Kameo, Y. Analysis of 89Sr and 90Sr in stagnant water of turbine building of the Fukushima Daiichi Nuclear Power Station. Radiochemistry News 25, 25–28 (2012) (In Japanese).
Sato, Y., Tanaka, K., Ueno, T., Ishimori, K. & Kameo, Y. Radiochemical analysis of rubble collected from Fukushima Daiichi Nuclear Power Station. Jpn. J. Health Phys. 51(4), 209–217 (2016).
Tanaka, K. et al. Radiochemical analysis of rubble and trees collected from Fukushima Daiichi Nuclear Power Station. J. Nucl. Sci. Technol. 51(7–8), 1032–1043 (2014).
Koma, Y., Shibata, A. & Ashida, T. Radioactive contamination of several materials following the Fukushima Daiichi Nuclear Power Station accident. Nucl. Mater. Energy 10, 35–41 (2017).
Steinhauser, G., Schauer, V. & Shozugawa, K. Concentration of strontium-90 at selected hot spots in Japan. PLOS ONE 8(3), e57760 (2013).
Mishra, S., Sahoo, S. K., Arae, H., Watanabe, Y. & Mieteiski, J. W. Activity ratio of caesium, strontium and uranium with site specific distribution coefficient in contaminated soil near vicinity of Fukushima Daiichi Nuclear Power Plant. J. Chromatogr. Sep. Tech. 5(6), 1000250 (2014).
Zhang, Z. et al. Activity of 90Sr in fallout particles collected in the difficult-to-return zone around the Fukushima Daiichi Nuclear Power Plant. Environ. Sci. Technol. 53, 5868–5876 (2019).
Zhang, Z., Ninomiya, K., Yamaguchi, Y., Kita, K., Tsuruta, H., Igarashi, Y., Shinohara, A. Atmospheric activity concentration of 90Sr and 137Cs after the Fukushima Daiichi Nuclear accident. Environ, Sci. Technol. 2018, 52, 9917–9925.
Pontillon, Y., Ducros, Malgouyres, P.P. Behavior of fission products under sever PWR accident conditions The VERCORES experimental programme-Part 1: general description of the programme. Nucl. Eng. Des. 2010, 240, 1843–1852.
Acknowledgements
This work was supported by the Secretariat of Nuclear Regulation Authority, Nuclear Regulation Authority, Japan.
Ethics declarations
Competing interests
The authors declare no competing interests.
Additional information
Publisher's note
Springer Nature remains neutral with regard to jurisdictional claims in published maps and institutional affiliations.
Supplementary Information
Rights and permissions
Open Access This article is licensed under a Creative Commons Attribution 4.0 International License, which permits use, sharing, adaptation, distribution and reproduction in any medium or format, as long as you give appropriate credit to the original author(s) and the source, provide a link to the Creative Commons licence, and indicate if changes were made. The images or other third party material in this article are included in the article's Creative Commons licence, unless indicated otherwise in a credit line to the material. If material is not included in the article's Creative Commons licence and your intended use is not permitted by statutory regulation or exceeds the permitted use, you will need to obtain permission directly from the copyright holder. To view a copy of this licence, visit http://creativecommons.org/licenses/by/4.0/.
About this article

Cite this article
Shimada, A., Taniguchi, Y., Kakiuchi, K. et al. Radiochemical analysis of the drain water sampled at the exhaust stack shared by Units 1 and 2 of the Fukushima Daiichi Nuclear Power Station. Sci Rep 12, 2086 (2022). https://doi.org/10.1038/s41598-022-05924-2
Received:
Accepted:
Published:
DOI: https://doi.org/10.1038/s41598-022-05924-2
Comments
By submitting a comment you agree to abide by our Terms and Community Guidelines. If you find something abusive or that does not comply with our terms or guidelines please flag it as inappropriate.
