
Abstract
Subjective cognitive decline (SCD) has been proposed as a risk factor for future cognitive decline and dementia. Given the heterogeneity of SCD and the lack of consensus about how to classify this condition, different operationalization approaches still need to be compared. In this study, we used the same sample of individuals to compare different SCD operationalization approaches. We included 399 cognitively healthy individuals from a community-based cohort. SCD was assessed through nine questions about memory and non-memory subjective complaints. We applied four approaches to operationalize SCD: two hypothesis-driven approaches and two data-driven approaches. We characterized the resulting groups from each operationalization approach using multivariate methods on comprehensive demographic, clinical, cognitive, and neuroimaging data. We identified two main phenotypes: an amnestic phenotype characterized by an Alzheimer’s Disease (AD) signature pattern of brain atrophy; and an anomic phenotype, which was mainly related to cerebrovascular pathology. Furthermore, language complaints other than naming helped to identify a subgroup with subclinical cognitive impairment and difficulties in activities of daily living. This subgroup also showed an AD signature pattern of atrophy. The identification of SCD phenotypes, characterized by different syndromic and biomarker profiles, varies depending on the operationalization approach used. In this study we discuss how these findings may be used in clinical practice and research.
Introduction
In 2014, the subjective cognitive decline initiative (SCD-I) published a research framework for SCD as a risk factor for mild cognitive impairment (MCI) and Alzheimer’s disease (AD)1. However, SCD is an heterogeneous clinical condition that can be related to other pathologies such as cerebrovascular disease2. Despite intense research, the field still lacks data on which is the best way to operationalize SCD, and the SCD-I has recently called for studies that compare different operationalization approaches of SCD3.
Since SCD is postulated as the pre-MCI stage4, hypothesis-driven approaches based on well-established MCI criteria could be useful to operationalize SCD. Alternatively, data-driven approaches may also be of interest. An option is operationalizing SCD subtypes based on the frequency and distribution of cognitive complaints. For instance, memory and word-finding complaints are frequently reported5,6,7. Other options are methodologically more complex. An example is the study by Amariglio et al.8, in which the authors applied regression models to identify the specific complaints associated with lower cognitive performance on cross-sectional data.
Reaching a consensus on how to operationalize SCD is important because different operationalization approaches may provide groups with different syndromic and biomarker profiles9. To our knowledge, there are no studies comparing different operationalization approaches in the same sample of SCD individuals. Hence, our aims were to: (1) apply four different SCD operationalization approaches in the same sample; (2) describe the frequency of subtypes resulting from the different operationalization approaches; (3) compare the approaches and subtypes in terms of cognitive, clinical, and structural magnetic resonance imaging (sMRI) biomarker profiles. We hypothesized that memory and word-finding complaints would be frequently reported, hence subtypes based on memory and word-finding complaints would have a high frequency. Although objective cognitive impairment was not expected, congruent with the definition of SCD, we anticipated lower cognition (subclinical impairment) and abnormal sMRI biomarkers in SCD individuals, with different profiles depending on the operationalization approach. Reaching a definitive answer on which is the best operationalization of SCD may only be achieved by large multi-center studies investigating different cohorts and using various instruments for measuring subjective complaints. We thus consider our current study as a first step towards providing preliminary data and methodological examples that may guide and encourage future studies in this area.
Methods
Participants
A total of 399 individuals from the GENIC-database10, 11 were included in this study. The GENIC is a prospective community-based study from the Canary Islands, Spain. Details on this cohort are provided in previous publications11. Briefly, recruitment was carried out through primary care health centers, advertisements in local schools, and relatives and acquaintances of the research staff. For the current study, individuals were selected according to the basic criteria from the research framework for SCD1: (a) normal age-, gender-, and education-adjusted performance on extensive neuropsychological testing according to clinical normative data; (b) normal performance in activities of daily living and global cognition defined in this study by a score ≤ 4 on the Blessed Dementia Rating Scale (BDRS)12, a score ≤ 5 on the Functional Activity Questionnaire (FAQ)13, and a score ≥ 26 on the Mini-Mental State Examination (MMSE)14; (c) absence of MCI or dementia; (d) and absence of past or present psychiatric or neurologic diseases, medical disorders, substance abuse, or use of medications that might explain the presence of subjective cognitive complaints.
This study was approved by the Ethical Committee on Research and Animal Welfare from the University of La Laguna, Spain. Each participant provided written informed consent and completed the same experiment protocol in accordance to the Declaration of Helsinki.
Subjective cognitive complaints
Subjective complaints were assessed through nine yes/no-type questions covering the following cognitive domains: memory, orientation, executive functions, face recognition, language production, language comprehension, word-finding, reading, and writing (Table 1).
In a simplified manner, these nine questions cover the five cognitive domains included in validated scales such as Everyday Cognition (ECog)15 . Furthermore, these nine questions also extend the domains covered by the only questionnaire validated in Spanish, i.e., Subjective Cognitive Decline-Questionnaire (SCD-Q)16. Item-by-item correspondence among these three methods can be seen in Table 2. Of note, both ECog and SCD-Q are endorsed by the SCD-I, and ECog is the most commonly used scale among the participating studies of the world-leading SCD initiative5. Answers were referred to cognitive changes observed during approximately the last six months. Each answer was scored as one (presence) or zero (absence). A total score was computed by adding up all the scores for each complaint, giving a continuous variable ranging from 0 to 9, where higher scores indicate greater number of complaints.
SCD operationalization approaches
Individuals were classified as healthy controls (HC) if they did not endorse any subjective cognitive complaint, or as SCD if they endorsed one or more complaints. We applied four operationalization approaches on the SCD individuals as follows:
-
1.
A hypothesis-driven approach based on Winblad’s criteria for MCI (from here, Clinical approach)17. The so-called Winblad’s criteria rely on a clinical judgment for determining cognitive impairment in MCI and include four subtypes: amnestic single or multiple domain and non-amnestic single or multiple domain17. We identified the same cognitive subtypes on SCD individuals based on the type of subjective complaint instead of on actual objective impairment. This approach gave four SCD subtypes depending on whether individuals reported a complaint in memory alone (amnestic single-domain SCD, aSCD-sd); in memory and other cognitive domains (amnestic multiple-domains SCD, aSCD-md); in a cognitive domain alone other than memory (non-amnestic single-domain SCD, naSCD-sd); or more than one cognitive domain other than memory (non-amnestic multiple-domains SCD, naSCD-md).
-
2.
A hypothesis-driven approach based on the MCI criteria from Mayo Clinic (US), which puts greater emphasis on the -1.5 SD criterion to define cognitive impairment (from here, Psychometric approach)18. These criteria were adjusted to SCD by requiring a total number of complaints. Since the total number of complaints variable was not normally distributed (Fig. 1A), we chose the 90th percentile instead of the -1.5 SD to determine the cut-off for SCD, as suggested elsewhere19.
Figure 1 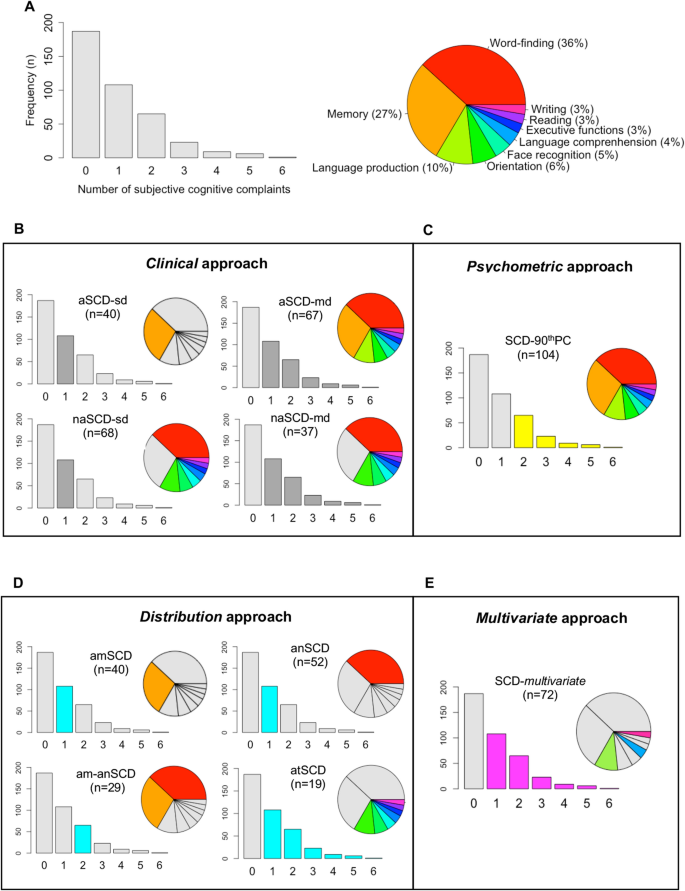
Overview of subjective cognitive complaints and SCD groups in the GENIC cohort. (a) Frequency of subjective cognitive complaints. (b–e) Overview of the SCD groups according to the four operationalization approaches. All the bar charts show number of subjective cognitive complaints in the x-axis and the frequency (n) in the y-axis. HC, healthy controls; aSCD-sd = amnestic Subjective Cognitive Decline—single domain; aSCD-md, amnestic Subjective Cognitive Decline—multiple domain; naSCD-sd, non-amnestic Subjective Cognitive Decline—single domain; naSCD-md, non-amnestic Subjective Cognitive Decline—multiple domain; SCD-90thPC, Subjective Cognitive Decline defined by the presence of two or more cognitive complaints, corresponding to the 90thPC of the total number of complaints variables; anSCD, anomic Subjective Cognitive Decline; amSCD, amnestic Subjective Cognitive Decline; am-anSCD, amnestic and anomic Subjective Cognitive Decline; atSCD, atypical Subjective Cognitive Decline; SCD-multivariate, Subjective Cognitive Decline defined by the presence of language production, language comprehension and/or writing complaint alone or in combination with other complaints.
-
3.
A data-driven approach based on the frequency and distribution of subjective cognitive complaints observed in the sample (from here, Distribution approach). We explored the frequencies of the different cognitive complaints when they were reported alone or in combination with the other complaints. For that, we divided the variable ‘number of complaints’ into quartiles; then, we investigated the distribution of the different complaints within each quartile in order to identify the SCD groups. We elaborate more on this approach in the results section: we describe the procedure that uncovered which specific complaints define the different SCD subtypes in our cohort; we also explain how individuals were assigned to the resulting subgroups.
-
4.
A data-driven approach using multivariate data analysis (from here, Multivariate approach). Amariglio et al.8 applied predictive models to identify which complaints were associated with lower cognitive performance in cross-sectional data from a large community-based cohort. The authors reported that the complaint of “getting lost” was strongly associated with lower cognitive performance. Inspired by this study, we also applied a predictive model to identify which complaints were associated with lower cognitive performance in our cross-sectional data. To increase the sensitivity of this approach towards early stages of neurodegenerative diseases, we aimed to identify complaints predicting lower performance in cognitive variables that are strongly associated with measures of activities of daily living (ADL). The reason behind this decision was to capture subclinical levels of impairment in cognition and ADL, which often prelude progression to MCI and dementia (stage III of preclinical AD)1. We applied a principal component analysis (PCA) on 67 cognitive variables and 4 ADL measures. The dimension that clustered cognitive measures together with the ADL measures was defined as our dimension of interest. We then conducted a predictive model (random forest regression model) to identify which complaints predicted such clinical-cognitive dimension of interest. We finally created the corresponding SCD group based on the identified complaints. Complementary, the PCA also reduced the dimensionality of the cognitive and clinical data (71 variables). The resulting components were used for further representation of certain results.

Demographic, clinical, and cognitive variables
Age and sex were included as demographic variables. We used the Information subtest from the Wechsler Adult Intelligence Scale—Third edition (WAIS-III) as an estimation of crystallized intelligence/education11,20. Clinical measures included information on ADL from both FAQ13 and BDRS12 (total score as well as scores from the three BDRS subscales: 1) changes in performance on everyday activities, 2) habits, and 3) personality, interest, and drive). Depressive symptomatology was assessed with the Beck Depression Scale (BDI)21 in individuals below 63 years of age, and the Geriatric Depression Scale (GDS)22 in individuals 63 years old or older. Z-scores from both scales were calculated and combined together in order to have a single measure of depressive symptomatology23. We highlight that none of the participants in this study had a clinical diagnosis of depression or were taking antidepressant medication, and scores in these scales were within the normal range. We applied a comprehensive neuropsychological protocol including tests for processing speed, attention, executive functions, premotor functions, memory, visuoconstructive, visuoperceptive, and visuospatial functions, and language functions. The neuropsychological protocol includes 67 cognitive variables and is fully detailed in previous publications24.
Magnetic resonance imaging (MRI) data acquisition and processing
Participants were scanned using a 3.0 T General Electric imaging system (Milwaukee, United States). A three-dimensional T1-weighted fast spoiled gradient echo (FSPGR) sequence was acquired in sagittal plane (repetition time/echo time/inversion time = 8.73/1.74/650 ms, field of view = 250 × 250 mm, matrix = 250 × 250 mm, flip angle = 12°, slice thickness = 1 mm).
The T1-weighted images were processed with FreeSurfer 5.1.0 (http://surfer.nmr.mgh.harvard.edu/) through our database system (theHiveDB)25 as detailed elsewhere26. Careful visual quality control was performed on both the original and the processed data, and manual edits were done when appropriate to ensure optimal output. Measures of thickness were calculated for 34 cortical regions from both hemispheres27, and measures of volume for 21 subcortical regions28. A measurement of total intracranial volume (ICV) was also estimated with FreeSurfer in order to account for individual differences in brain size on all the volumetric measures29.
MRI biomarkers of AD and cerebrovascular disease
Previous research has linked SCD with AD and cerebrovascular disease1,2,30,31. AD-related neurodegeneration and cerebrovascular disease can be assessed in vivo with structural MRI. In the current study, we investigated how different SCD operationalization approaches may relate to sMRI biomarkers of AD-related neurodegeneration and cerebrovascular disease. A novel sMRI biomarker of AD is the “disease severity index”, which captures the AD signature atrophy pattern in SCD individuals30. This index is strongly associated with increased amyloid burden and higher risk of progression to MCI or dementia31. A common sMRI biomarker of cerebrovascular disease is white matter signal abnormalities (WMSA)32,33. Both methods are explained below.
The AD signature atrophy pattern (“disease severity index”) was calculated as in a previous publication31. Briefly, a classification model was trained on an external database to discriminate between 69 healthy controls and 39 AD dementia patients from the AIBL cohort (Australian Imaging Biomarkers and Lifestyle flagship study of ageing)34. The 34 measures of cortical thickness from both hemispheres and the 21 subcortical volumes from FreeSurfer were used as input data. These data were previously corrected for age and ICV, since both variables are known to influence brain morphology29,35. The variance in the sMRI measures related to age and ICV was estimated and removed from the original data using multiple linear regression. After correcting the data, the classification model was built using the orthogonal partial least square (OPLS) method included in the software package SIMCA (Sartorius Stedim AB, Umeå, Sweden). The OPLS method separates the systematic variation in the data into two blocks: predictive and orthogonal. The first component of the model is predictive and includes information related to class separation (e.g. AD vs. HC). The orthogonal components in the model, if any, are related to other variation in the data not related to the actual problem, such as within class variation. Each model receives an R2(X), an R2(Y), and a Q2(Y) value. R2(X) represents the explained variance between the criterion variable (Y) and predictor variables (X), for the predicted and the orthogonal components. R2(Y) represents the goodness of fit of the model and refers to the fraction of the criterion variable (Y) variation modeled in the component, using the predicted model. Q2(Y) defines how well the model predicts new data. The significance of a model is based on the Q2(Y) parameter and is reported as acceptable (Q2 > 0.1), good (Q2 > 0.5), and optimal (Q2 > 0.9)36. In the current study, the sevenfold validation method to separate AD patients from HC achieved an R2(X) value of 0.171, an R2(Y) value of 0.848, and a Q2(Y) value of 0.700, indicating a high performance to discriminate between the HC and AD groups. The brain regions that contributed the most to this model were the hippocampal volume, the precuneus, the right supramarginal gyrus, and the inferior parietal gyrus, all of them displaying reduced values in the AD group. The inferior part of the lateral ventricles was also important, displaying larger volume in the AD group, as in previous publications31. Afterwards, age- and ICV-corrected values of the same cortical and subcortical sMRI variables from the GENIC individuals were projected onto this classification model as unseen data. By doing this, all the GENIC individuals receive a score for the “disease severity index”. This score reflects the AD signature atrophy pattern and ranges from 0 to 1. Values close to 0 are indicative of a HC-like pattern, and values close to 1 reflect an AD-like pattern of brain atrophy. This index can be used either as a continuous variable, or as a dichotomous variable by applying a threshold.
The WMSA volume was calculated on T1-weighted images using FreeSurfer, subsequently extended to label white matter lesions28. WMSA is an indicator of underlying cerebrovascular disease. This procedure has demonstrated sensitivity in measuring white matter damage in both healthy and SCD individuals, as well as in patients with AD23,37,38. The T1-weighted WMSA volume from FreeSurfer is correlated with hyperintensity volume measured on T2/FLAIR, as well as with microstructural white matter changes as measured on diffusion tensor imaging data10,38,39.
Statistical analysis
Two per cent of the values were missing across all cognitive variables and were thus imputed for subsequent analyses. Random forest analyses (5000 trees) were conducted to characterize the SCD groups against the HC across multiple variables (classification models) or to investigate the association between multiple predictors and an outcome variable (regression models), while avoiding multiple testing. In random forest models, the contribution of the predictors in the models is reported as Imp (importance), which reflects the relative error in prediction when a predictor is excluded from the model. Pearson, point-biserial, and partial correlations were performed to study relationships between variables. ANOVA/ANCOVA, Mann–Whitney, and Kruskal Wallis tests were conducted to investigate between-group differences in continuous variables and the Chi-square test was used for categorical variables. Posthoc analyses were conducted in ANOVA/ANCOVA for the sMRI variables using the Hochberg correction for multiple comparisons40. Principal component analysis (PCA) was conducted on the 67 cognitive variables and 4 ADL variables for reducing data dimensionality and identifying a clinical-cognitive dimension of interest as explained above in the “SCD operationalization approaches” section. The components from this PCA were also used for investigating borderline cognitive performance in a reduced set of cognitive variables. Borderline cognitive performance was defined as a score below the 10th percentile on the cognitive components after adjusting for age, sex, and crystallized intelligence/education (WAIS-III Information subtest) using multiple linear regression analysis. A p value ≤ 0.05 (two-tailed) was deemed significant in all these analyses.
Results
Frequency of subjective cognitive complaints and SCD groups
Overall, 53.1% of the individuals (n = 212) reported at least one complaint. Word-finding (36%, n = 145) and memory (27%, n = 107) were the most frequent complaints (Fig. 1A). Table 3 shows the main demographic and clinical characteristics of the different SCD groups by operationalization approach. Additionally, the association of each cognitive complaint with demographic, clinical, cognitive, and MRI data are displayed on the supplementary Table S1.
-
1.
Clinical approach (Table 3, Fig. 1B): the naSCD-sd (17%) and aSCD-md (17%) subtypes were significantly larger than the aSCD-sd (10%) and naSCD-md (9%) subtypes (p = 0.001).
-
2.
Psychometric approach (Table 3, Fig. 1C): since the total number of complaints variable was not normally distributed, the 90th percentile was chosen instead of the -1.5 SD to determine the cut-off for SCD, as suggested elsewhere19.
-
3.
Distribution approach (Table 3, Fig. 1D): Firstly, the variable ‘number of complaints’ was divided into quartiles. We observed that each quartile corresponded to zero (Q1), one (Q2), two (Q3), and three or more (Q4) cognitive complaints. Secondly, we scrutinized the distribution of complaints within each quartile. Since memory and word-finding complaints were the most frequently reported complaints, both dominated Q2, Q3, and Q4, either alone or in combination with other complaints. Therefore, for simplicity, we only illustrated the distribution of these two most common complaints. Based on this finding, four subtypes could be ascertained: amnestic SCD (amSCD; individuals with a complaint limited to memory); anomic SCD (anSCD; individuals with a complaint limited to word-finding); amnestic and anomic SCD (am-anSCD; individuals with two complaints limited to memory and word-finding); and atypical SCD (atSCD; individuals with one or more complaints in any cognitive domain other than memory or word-finding). Figure 2 shows the quartiles and the distribution of memory and word-finding complaints. The anSCD (16%) and amSCD (12%) subtypes were significantly larger than the atSCD (6%) subtype. The anSCD subtype was also larger than the am-anSCD subtype (9%) (p < 0.001).
Figure 2 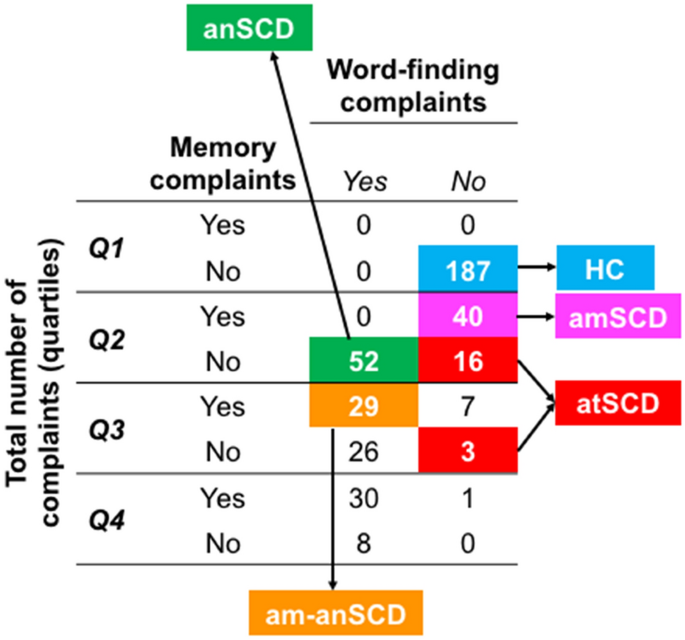
Identification of SCD subtypes in the Distribution approach. Cross-table of frequencies between each quartile of the variable ‘total number of complaints’ and the variables of ‘memory’ and ‘word-finding’ complaints. anSCD, anomic Subjective Cognitive Decline; amSCD, amnestic Subjective Cognitive Decline; am-anSCD, amnestic and anomic Subjective Cognitive Decline; atSCD, atypical Subjective Cognitive Decline.
-
4.
Multivariate approach (Table 3, Fig. 1E): The PCA gave 5 components (R2 = 0.49). Components #1, #2, and #5 each explained 12% of the variance, and included variables related to visual functions, verbal episodic memory, and executive and premotor functions, respectively. Component #3 explained 8% of the variance and included variables related to visual memory. Component #4 explained 5% of the variance and clustered the ADL measures (i.e. FAQ and BDRS ‘changes in daily life activities’ subscale) together with several cognitive variables, including episodic memory, semantic fluency, and visual discrimination. Thus, component #4 was labeled as the ‘clinical severity component’ and it was considered as our component of interest for subsequent analyses in this approach. Lower scores in this component #4 indicates worse clinical and cognitive status. We then predicted component #4 by the nine different complaints as well as age, sex, WAIS-III Information subtest, and depressive symptomatology in a random forest model (regression). Component #4 was mainly predicted (R2 = 0.08) by the score on WAIS-III Information subtest (Imp = 0.13), the writing complaint (Imp = 0.05), and sex (Imp = 0.04). The language production complaint and language comprehension complaint marginally contributed to the prediction of component #4 (Imp < 0.01). Worse clinical-cognitive status as reflected by component #4 was associated with a lower score in WAIS-III Information (r = 0.28), the presence of complaints on writing (rpb = -0.23), language production (rpb = -0.03) and language comprehension (rpb = -0.10), as well as female sex (rpb = -0.04). Based on these results, individuals with a complaint either in writing, language comprehension, or language production, were classified as the SCD-multivariate group (14%), independently of whether those individuals also endorsed complaints in other domains.

Figure 3 illustrates the overlap between the four SCD operationalization approaches. The Clinical approach included all the SCD individuals and overlapped with the other three. Two clusters can be identified going from higher sensitivity (overlap with the Distribution approach) to higher specificity (overlap with the Psychometric and Multivariate approaches).

Overlap between the four SCD operationalization approaches. Percentage values indicate the frequency of individuals with subjective complaints classified as SCD by the different approaches and their combination.
In the Psychometric, Distribution, and Multivariate approaches, 51% (n = 108), 34% (n = 72), and 72% (n = 153) of the individuals with subjective cognitive complaints were not classified as SCD (nonSCD), respectively. The characteristics of those nonSCD individuals in each approach are displayed on the supplementary Table S3 and Figure S1.
Clinical characterization of the SCD groups
The SCD groups were characterized by conducting random forest classification models (SCD vs. HC). We included all the demographic, clinical, and cognitive measures as predictive variables in the random forest models. The most important variables from each model and the summary of the results are displayed in Table 4A. All the models provided a classification error greater than chance, indicating that any combination of the variables was able to discriminate between the SCD subtypes and HC. Therefore, SCD groups were comparable to the HC group in demographic, clinical, and cognitive variables, as expected congruent with the definition of SCD (Table 4A). In addition, SCD groups in the Clinical and Distribution approaches were also comparable.
Once demonstrated that there is no objective cognitive impairment in the SCD individuals, we then investigated borderline performance (SCD individuals falling below the 10th percentile of cognitive performance). For simplicity, we investigated the five components of the PCA instead of the 67 cognitive variables (Fig. 4). Visual inspection of Fig. 4 shows that the Multivariate approach identified individuals with worst performance in verbal episodic memory (PCA2) and, as expected, in component #4 (PCA4). SCD subtypes endorsing memory complaints (i.e. aSCD-sd, aSCD-md, and amSCD) showed worst performance in executive and premotor functions (PCA5). The naSCD-md subtype (Clinical approach) showed worst performance in visual memory abilities (PCA3).

Cognitive profile of the SCD groups—Borderline performance. Percentage of SCD individuals with cognitive performance below the 10th percentile is reported for each SCD operationalization approach and subtype. The y-axis shows the percentage of SCD individuals below the 10th percentile. Higher percentage indicates that more individuals in a given group have borderline performance. This analysis was conducted only using SCD data. All the scores were previously adjusted for age, sex, and the WAIS-III Information subtest using multiple linear regression. The five components obtained in the PCA (Principal Component Analysis) were selected for this analysis. aSCD-sd, amnestic Subjective Cognitive Decline—single domain; aSCD-md, amnestic Subjective Cognitive Decline—multiple domain; naSCD-sd, non-amnestic Subjective Cognitive Decline—single domain; naSCD-md, non-amnestic Subjective Cognitive Decline—multiple domain; SCD-90thPC, Subjective Cognitive Decline defined by the presence of two or more cognitive complaints, corresponding to the 90thPC of the total number of complaints variable; anSCD, anomic Subjective Cognitive Decline; amSCD, amnestic Subjective Cognitive Decline; am-anSCD, amnestic and anomic Subjective Cognitive Decline; atSCD, atypical Subjective Cognitive Decline; SCD-multivariate, Subjective Cognitive Decline defined by the presence of language production, language comprehension and/or writing complaints alone or in combination with other complaints.
AD signature atrophy and WMSA
MRI data were available for 220 participants (55%). Compared with the HC, all operationalization approaches displayed increased disease severity index, reflecting an AD signature atrophy (Table 3). Regarding the WMSA (age and ICV included as covariates), the aSCD-md subtype (Clinical approach) showed significantly increased WMSA as compared with the HC (Table 3). A trend for a significant increase in WMSA (p = 0.074) was observed for the anSCD subtype (Distribution approach) (Table 3). Partial correlations were performed within each separate SCD group, controlled by age and ICV. Correlations showed no significant association between the AD signature atrophy and the WMSA load. Additionally, all individuals were classified as having normal/abnormal values in the AD signature atrophy pattern and the WMSA load based on the 90th percentile (Fig. 5). Interestingly, 100% of the individuals with abnormal values in both biomarkers were SCD individuals. Furthermore, 88% of the individuals with an abnormal AD signature atrophy pattern were SCD individuals, most showing an amnestic profile (aSCD-sd, aSCD-md, or amSCD). In contrast, 56% of the individuals with abnormal WMSA load were SCD individuals, and most showed a non-amnestic profile, predominantly anomic (naSCd-sd and anSCD). Regression random forest models were conducted including cognitive complaints, age, sex, depressive symptomatology, and ICV (only for WMSA) as predictors. Results showed that, in the whole sample, the AD signature pattern was mainly predicted by the memory complaint and sex, while WMSA were predicted by the writing complaint, age, ICV, and sex. The word-finding complaint also predicted both biomarkers, and complaints in orientation and reading marginally predicted the AD signature atrophy pattern. Model parameters are reported in Table 4B.

AD signature atrophy pattern versus WMSA load. The AD signature atrophy pattern and the WMSA load are treated as continuous variables in all the analyses in this study. Only for representation purposes in this figure, both measures were dichotomized to reflect an AD-like pattern of brain atrophy and high load of WMSA. This was done by using the 90th percentile cut-off as in previous studies41. The distribution of SCD and HC individuals (color legend) was plotted and, for each quadrant, the percentage of SCD individuals is reported. HC, healthy controls; SCD, subjective cognitive decline; WMSA, white matter signal abnormalities; AD, Alzheimer’s disease.
Discussion
In the current study we addressed one of the priorities for SCD research at present, namely, gaining knowledge on the impact of different SCD operationalization approaches on the resulting SCD groups3. We tested four alternative approaches to operationalize SCD on a large community-based cohort. We then characterized the resulting SCD groups across a comprehensive set of demographical, clinical, and cognitive measures. We also sought to investigate potential AD and cerebrovascular underlying pathologies through surrogate sMRI biomarkers. We found that memory and word-finding were the most frequent complaints. However, they interrelated differently with the other complaints leading to an amnestic cluster strongly associated with AD, as well as to an anomic cluster, in which cerebrovascular disease also played a role. Writing, language comprehension, and language production complaints were also relevant, for example, delineating borderline performance on activities of daily living and verbal episodic memory.
The two first operationalization approaches were hypothesis-driven and were based on well-established MCI criteria. A high proportion of individuals endorsed two or more complaints (Psychometric criteria), similar to previous SCD studies investigating the amount of complaints8. Further, aSCD-md was one of the most frequent subtypes. Both findings support the notion of SCD as a multi-domain condition42,43, and highlight the heterogeneity within SCD. However, many previous studies have only recruited amnestic forms due to their focus on AD5. In addition, previous studies have usually included more homogeneous samples than that of the current study, because they were based on clinical settings where the frequency of memory complaints is higher1,30,42,43,44,45. In line with our results, non-amnestic complaints are frequently reported when heterogeneous community or population-based cohorts are investigated5,6,7. In particular, the word-finding complaint is frequently reported6,7. In the current study, we demonstrated that the Distribution operationalization approach translated these findings directly to SCD subtypes, providing a classification that could be useful in community-based cohorts as compared with operationalization approaches influenced by memory complaints (Clinical and Psychometric approaches).
In our fourth operationalization approach we used a data-driven method to identify the most clinically relevant cognitive variables based on their interrelation with measures of activities of daily living. Of interest, complaints that better predicted these cognitive and clinical variables included writing, language production, and language comprehension, but not memory. Our interpretation of this finding is that memory and/or word-finding complaints may be present in SCD individuals with an underlying neurodegenerative disorder7,46,47,48. However, since memory and/or word-finding complaints are very frequent in our cohort, rarer complaints such as writing, language production, and language comprehension seem to predict features of preclinical stages of a neurodegenerative disorder better (i.e. worse performance in measures of cognition and activities of daily living). Worse performance in these cognitive and clinical variables was also associated with lower crystallized intelligence/education (measured by WAIS-III Information subtest). This finding suggests that these complaints may reflect more premorbid cognitive or education status than preclinical changes associated to a neurodegenerative disease. However, below we discuss two other findings, i.e., cognitive profiles and sMRI biomarkers, that support the interpretation of these atypical complaints as predictors of features related to preclinical stages of a neurodegenerative disorder.
Writing, language production, and language comprehension complaints, which catalyze the Multivariate SCD group, were associated with subclinical impairment in verbal episodic memory (learning and recognition). These complaints, as well as memory complaints, were strongly associated with the AD signature atrophy pattern. Importantly, this AD signature atrophy pattern has been related to higher amyloid burden, higher frequency of the APOE ε4 allele, and greater progression to MCI and dementia in SCD individuals31. Thus, this specific cluster of complaints could be closely related to AD pathology. In contrast, word-finding complaints, which catalyze several of the non-amnestic subtypes, were associated with subclinical impairment in executive and premotor functions. There was also an association with memory functioning, since word-finding saturates on both the amnestic and non-amnestic clusters, but word-finding seemed to be more closely related with WMSA than with the AD signature atrophy. Previous studies have linked word-finding with non-AD pathologies49 and normal aging50 in addition to AD7. Therefore, we suggest that the anomic cluster of complaints in this study could be related to cerebrovascular or mixed pathology (AD plus cerebrovascular pathology). These results are consistent with MCI research showing that amnestic MCI is more closely associated with AD pathology, while non-amnestic and multi-domain MCI forms are more commonly related to cerebrovascular, mixed, or other pathologies51.
Some limitations should be mentioned. Our data is cross-sectional and from a single center. Future research should focus on validating our findings longitudinally and on independent cohorts. It is of relevance to ascertain which is the best operationalization method for identifying SCD individuals at highest risk for developing cognitive decline in the future. Our current analyses should be extended to include direct biomarkers of amyloid and neurofibrillary tangle pathology. Nonetheless, we investigated a community-based cohort, where the a-priori prevalence of AD is much lower than in clinical cohorts, and cerebrovascular and age-related tauopathies are more prevalent.
Conclusions
In conclusion, our findings highlight the distinction between amnestic/non-amnestic phenotypes in SCD, perhaps anticipating corresponding subtypes of MCI, and different AD presentations and other dementias. Based on our findings we suggest that the SCD operationalization approach needs to be chosen depending on several factors, including the aims of the study, the source of the individuals, the clinical purpose, the characteristics of the clinical center, and the target of the clinical trial, among others. If the aim is early detection of any neurodegenerative disorder, the Clinical approach seems to have greater sensitivity but lacks of specificity and should be combined with the Multivariate approach. However, this strategy may overlook anomic forms in community-based cohorts. Hence, the Distribution approach may be a good starting point to explore the characteristics of the cohort, and other approaches shall be used later on depending on the frequency of amnestic and anomic profiles. To our knowledge, the current study is the first in applying and comparing different SCD operationalization approaches in the same cohort. We provide relevant data that could be used as preliminary research guidance. Since SCD-I support certain flexibility in the classification of SCD1,3, individual studies may still vary in their major aims. Therefore, it is imminent that researchers clarify how they operationalize SCD and why they choose a given approach. Our study could serve as a preliminary framework to guide and support their decision. However, more validation work needs to be done to be able to directly generalize our methods and reach a standardized operational/diagnostic criterion for SCD. The field needs to move forward conducting large multi-center studies that investigate operationalization approaches of SCD in different cohorts and using various instruments for measuring subjective complaints. Our present study is only a preliminary step and we hope that our findings help pave the way and encourage continuing the task of standardizing the operationalization of SCD in the near future.
References
Jessen, F. et al. A conceptual framework for research on subjective cognitive decline in preclinical Alzheimer’s disease. Alzheimers. Dement. 10, 844–852 (2014).
Diniz, B. S., Butters, M. A., Albert, S. M., Dew, M. A. & Reynolds, C. F. Late-life depression and risk of vascular dementia and Alzheimer’s disease: systematic review and meta-analysis of community-based cohort studies. Br. J. Psychiatry 202, 329–335 (2013).
Molinuevo, J. L. et al. Implementation of subjective cognitive decline criteria in research studies. Alzheimers. Dement. 13, 296–311 (2017).
Reisberg, B. & Gauthier, S. Current evidence for subjective cognitive impairment (SCI) as the pre-mild cognitive impairment (MCI) stage of subsequently manifest Alzheimer’s disease. Int. Psychogeriatr. 20, 1–16 (2008).
Rabin, L. A. et al. Subjective cognitive decline in older adults: an overview of self-report measures used across 19 international research studies. J. Alzheimers. Dis. 48(Suppl 1), S63-86 (2015).
Martins, I. P., Mares, I. & Stilwell, P. A. How subjective are subjective language complaints. Eur. J. Neurol. 19, 666–671 (2012).
Valech, N. et al. Executive and language subjective dognitive decline complaints discriminate preclinical Alzheimer’s disease from normal aging. J. Alzheimers. Dis. 61, 689–703 (2018).
Amariglio, R., Townsend, M. K., Grodstein, F., Sperling, R. A. & Rentz, D. M. Specific subjective memory complaints in older persons may indicate poor cognitive function. J. Am. Geriatr. Soc. 59, 1612–1617 (2011).
Busse, A., Hensel, A., Guhne, U., Angermeyer, M. C. & Riedel-Heller, S. G. Mild cognitive impairment: long-term course of four clinical subtypes. Neurology 67,2176–2185 (2006).
Nemy, M. et al. Cholinergic white matter pathways make a stronger contribution to attention and memory in normal aging than cerebrovascular health and nucleus basalis of Meynert. Neuroimage 211, 116607 (2020).
Gonzalez-Burgos, L., Hernández-Cabrera, J. A., Westman, E., Barroso, J. & Ferreira, D. Cognitive compensatory mechanisms in normal aging: a study on verbal fluency and the contribution of other cognitive functions. Aging (Albany, NY) 11, 4090–4106 (2019).
Blessed, G., Tomlinson, B. E. & Roth, M. The association between quantitative measures of dementia and of senile change in the cerebral grey matter of elderly subjects. Br. J. Psychiatry 114, 797–811 (1968).
Pfeffer, R. I., Kurosaki, T. T., Harrah, C. H., Chance, J. M. & Filos, S. Measurement of functional activities in older adults in the community. J. Gerontol. 37, 323–329 (1982).
Folstein, M. F., Folstein, S. E. & McHugh, P. R. ‘Mini-mental state’. A practical method for grading the cognitive state of patients for the clinician. J. Psychiatr. Res. 12, 189–198 (1975).
Tomaszewski Farias, S. et al. The measurement of everyday cognition: development and validation of a short form of the Everyday Cognition scales. Alzheimers. Dement. 7, 593–601 (2011).
Rami, L. et al. The Subjective Cognitive Decline Questionnaire (SCD-Q): a validation study. J. Alzheimers. Dis. 41, 453–466 (2014).
Winblad, B. et al. Mild cognitive impairment–beyond controversies, towards a consensus: report of the International Working Group on Mild Cognitive Impairment. J. Intern. Med. 256, 240–246 (2004).
Petersen, R. C. et al. Mild Cognitive Impairment: clinical characterization and outcome. Arch. Neurol. 56, 303–309 (1999).
Ganguli, M. et al. Sensitivity and specificity for dementia of population-based criteria for cognitive impairment: The MoVIES project. J. Gerontol. 48, M152–M161 (1993).
Ferreira, D. et al. Different reserve proxies confer overlapping and unique endurance to cortical thinning in healthy middle-aged adults. Behav. Brain Res. 311, 375–383 (2016).
Beck, A. A. T., Ward, C. H. H., Mendelson, M., Mock, J. & Erbaugh, J. An inventory for measuring depression. Arch. Gen. Psychiatry 4, 561–571 (1961).
Yesavage, J. A. et al. Development and validation of a geriatric depression screening scale: a preliminary report. J. Psychiatr. Res. 17, 37–49 (1982).
Ferreira, D. et al. Cognitive variability during middle-age: possible association with neurodegeneration and cognitive reserve. Front. Aging Neurosci. 9, 188 (2017).
Cedres, N. et al. Subjective cognitive decline below and above the age of 60: a multivariate study on neuroimaging, cognitive, clinical, and demographic measures. J. Alzheimer’s Dis. 68, 295–309 (2019).
Muehlboeck, J.-S., Westman, E. & Simmons, A. TheHiveDB image data management and analysis framework. Front. Neuroinform. 7, 1–13 (2014).
Ferreira, D. et al. Cognitive decline is mediated by gray matter changes during middle age. Neurobiol. Aging 35, 1086–1094 (2014).
Desikan, R. S. et al. An automated labeling system for subdividing the human cerebral cortex on MRI scans into gyral based regions of interest. Neuroimage 31, 968–980 (2006).
Fischl, B. et al. Whole brain segmentation: automated labeling of neuroanatomical structures in the human brain. Neuron 33, 341–355 (2002).
Voevodskaya, O. et al. The effects of intracranial volume adjustment approaches on multiple regional MRI volumes in healthy aging and Alzheimer’s disease. Front. Aging Neurosci. 6, 264 (2014).
Stewart, R. et al. Longitudinal neuroimaging correlates of subjective memory impairment: 4-year prospective community study. Br. J. Psychiatry 198, 199–205 (2011).
Ferreira, D. et al. A ‘Disease Severity Index’ to identify individuals with Subjective Memory Decline that will progress to mild cognitive impairment or dementia. Sci. Rep. 7, 188 (2017).
Haley, A. P. et al. Subjective cognitive complaints relate to white matter hyperintensities and future cognitive decline in patients with cardiovascular disease. Am. J. Geriatr. Psychiatry 17, 976–985 (2009).
Benedictus, M. R. et al. White matter hyperintensities relate to clinical progression in subjective cognitive decline. Stroke 46, 2661–2664 (2015).
Ellis, K. A. et al. The Australian Imaging, Biomarkers and Lifestyle (AIBL) study of aging: methodology and baseline characteristics of 1112 individuals recruited for a longitudinal study of Alzheimer’s disease. Int. Psychogeriatr. 21, 672–687 (2009).
Falahati, F. et al. The effect of age correction on multivariate classification in Alzheimer’s disease, with a focus on the characteristics of incorrectly and correctly classified subjects. Brain Topogr. 29, 296–307 (2016).
Eriksson, L., Kettaneh-Wold, N., Trygg, J., Wikström, C. & Wold, S. Multi-and megavariate data analysis: Part I: basic principles and applications (Umetrics Academy, 2006).
Salat, D. H. et al. White matter pathology isolates the hippocampal formation in Alzheimer’s disease. Neurobiol. Aging 31, 244–256 (2010).
Leritz, E. C. et al. Associations between T1 white matter lesion volume and regional white matter microstructure in aging. Hum. Brain Mapp. 35, 1085–1100 (2014).
Cedres, N. et al. Predicting Fazekas scores from automatic segmentations of white matter signal abnormalities. Aging (Albany, NY) 12, 894–901 (2020).
Hochberg, Y. & Benjamini, Y. More powerful procedures for multiple significance testing. Stat. Med. 9, 811–818 (1990).
Falahati, F. et al. Monitoring disease progression in mild cognitive impairment: associations between atrophy patterns, cognition, APOE amyloid. NeuroImage Clin. 16, 418–428 (2017).
La Joie, R. et al. Qualitative and quantitative assessment of self-reported cognitive difficulties in nondemented elders: Association with medical help seeking, cognitive deficits, and β-amyloid imaging. Alzheimer’s Dement (Amsterdam, Netherlands) 5, 23–34 (2016).
van Harten, A. C. et al. Subjective cognitive decline and risk of MCI: The Mayo Clinic Study of Aging. Neurology 91, e300–e312 (2018).
Reisberg, B. et al. The pre-mild cognitive impairment, subjective cognitive impairment stage of Alzheimer’s disease. Alzheimers Dement. 4, S98–S108 (2008).
Donovan, N. J. et al. Subjective cognitive concerns and neuropsychiatric predictors of progression to the early clinical stages of Alzheimer disease. Am. J. Geriatr. Psychiatry 22, 1642–1651 (2014).
Abdulrab, K. & Heun, R. Subjective Memory Impairment. A review of its definitions indicates the need for a comprehensive set of standardised and validated criteria. Eur. Psychiatry 23, 321–330 (2008).
Derouesné, C., Rapin, J.-R. & Lacomblez, L. Memory complaints in 200 subjects meeting the diagnostic criteria for age-associated memory impairment: psychoaffective and cognitive correlates. Psychol. Neuropsychiatr. Vieil. 2, 67–74 (2004).
Wang, L. et al. Subjective memory deterioration and future dementia in people aged 65 and older. J. Am. Geriatr. Soc. 52, 2045–2051 (2004).
Smith, K. M., Ash, S., Xie, S. X. & Grossman, M. Evaluation of linguistic markers of word-finding difficulty and cognition in Parkinson’s disease. J. Speech Lang. Hear. Res. 61, 1691–1699 (2018).
Burke, D. M. & Shafto, M. A. Aging and language Production. Curr. Dir. Psychol. Sci. 13, 21–24 (2004).
Buckley, R. F. et al. Region-specific association of subjective cognitive decline with tauopathy independent of global β-amyloid burden. JAMA Neurol. 74, 1455–1463 (2017).
Acknowledgements
This research was funded by the Estrategia de Especialización Inteligente de Canarias RIS3 de la Consejería de Economía, Industria, Comercio y Conocimiento del Gobierno de Canarias, co-funded by the Programa Operativo FEDER Canarias 2014–2020 (ProID2020010063); the research grant Formación de Profesorado Universitario (FPU) from Ministerio de Educación, Cultura y Deporte (convocatoria 2015; FPU-14/060); Fundación Canaria Dr. Manuel Morales (convocatoria 2012, 2014 y 2017); the Swedish Foundation for Strategic Research (SSF); the Strategic Research Programme in Neuroscience at Karolinska Institutet (StratNeuro); the Swedish Research Council (VR); the Åke Wiberg foundation; Hjärnfonden; Alzheimerfonden; Demensfonden; Stiftelsen Olle Engkvist Byggmästare; and Birgitta och Sten Westerberg. The funders of the study had no role in the study design nor the collection, analysis, and interpretation of data, writing of the report, or decision to submit the manuscript for publication. The authors would like to thank Dr. Diaz-Flores Varela (Hospital Universitario de Canarias, Tenerife, Spain) for his collaboration in the inspection of magnetic resonance images for inclusion criteria; Dr. Antonio Rodríguez for providing access to participants and helpful assistance; the Servicio de Resonancia Magnética para Investigaciones Biomédicas del SEGAI (University of La Laguna, Spain). Data used in preparation of this article is part of the GENIC-database (Group of Neuropsychological Studies of the Canary Islands, University of La Laguna, Spain. Principal investigator: Professor José Barroso. Contact: Dr. Daniel Ferreira, daniel.ferreira.padilla@ki.se). The following collaborators contributed to the GENIC-database but did not participate in analysis or writing of this report (in alphabetic order by family name): Rut Correia, Nerea Figueroa, Eloy García, Lissett González, Teodoro González, Zaira González, Cathaysa Hernández, Edith Hernández, Nira Jiménez, Judith López, Cándida Lozano, Alejandra Machado, Yaiza Molina, María Antonieta Nieto, María Sabucedo, Elena Sirumal, Marta Suárez, Manuel Urbano, and Pedro Velasco.
Funding
Open Access funding provided by Karolinska Institute.
Author information
Authors and Affiliations
Contributions
P.D.-G., D.F., J.B., and E.W. contributed to the conceptualization and design of the study. D.F., J.B. and E.W. supervised the study. D.F. and J.B. coordinated data collection for GENIC and D.A. coordinated data collection for AIBL. P.D.-G., F.F. and J.A.H.-C. performed the data analysis. P.D.-G., D.F. and N.C. interpreted the results. P.D.-G. and D.F. drafted the manuscript. All authors read and approved the final manuscript.
Corresponding author
Ethics declarations
Competing interests
The authors declare no competing interests.
Additional information
Publisher's note
Springer Nature remains neutral with regard to jurisdictional claims in published maps and institutional affiliations.
Supplementary Information
Rights and permissions
Open Access This article is licensed under a Creative Commons Attribution 4.0 International License, which permits use, sharing, adaptation, distribution and reproduction in any medium or format, as long as you give appropriate credit to the original author(s) and the source, provide a link to the Creative Commons licence, and indicate if changes were made. The images or other third party material in this article are included in the article's Creative Commons licence, unless indicated otherwise in a credit line to the material. If material is not included in the article's Creative Commons licence and your intended use is not permitted by statutory regulation or exceeds the permitted use, you will need to obtain permission directly from the copyright holder. To view a copy of this licence, visit http://creativecommons.org/licenses/by/4.0/.
About this article

Cite this article
Diaz-Galvan, P., Ferreira, D., Cedres, N. et al. Comparing different approaches for operationalizing subjective cognitive decline: impact on syndromic and biomarker profiles. Sci Rep 11, 4356 (2021). https://doi.org/10.1038/s41598-021-83428-1
Received:
Accepted:
Published:
DOI: https://doi.org/10.1038/s41598-021-83428-1
This article is cited by
-
Spatial navigation is associated with subcortical alterations and progression risk in subjective cognitive decline
Alzheimer's Research & Therapy (2023)
-
Overall and sex-specific risk factors for subjective cognitive decline: findings from the 2015–2018 Behavioral Risk Factor Surveillance System Survey
Biology of Sex Differences (2022)
Comments
By submitting a comment you agree to abide by our Terms and Community Guidelines. If you find something abusive or that does not comply with our terms or guidelines please flag it as inappropriate.
