Abstract
The domestic canine (canis familiaris) is a growing novel model for human neuroscientific research. Unlike rodents and primates, they demonstrate unique convergent sociocognitive skills with humans, are highly trainable and able to undergo non-invasive experimental procedures without restraint, including fMRI. In addition, the gyrencephalic structure of the canine brain is more similar to that of human than rodent models. The increasing use of dogs for non-invasive neuroscience studies has generating a need for a standard canine cortical atlas that provides common spatial referencing and cortical segmentation for advanced neuroimaging data processing and analysis. In this manuscript we create and make available a detailed MRI-based cortical atlas for the canine brain. This atlas includes a population template generated from 30 neurologically and clinically normal non-brachycephalic dogs, tissue segmentation maps and a cortical atlas generated from Jerzy Kreiner’s myeloarchitectonic-based histology atlas. The provided cortical parcellation includes 234 priors from frontal, sensorimotor, parietal, temporal, occipital, cingular and subcortical regions. The atlas was validated using an additional canine cohort with variable cranial conformations. This comprehensive cortical atlas provides a reference standard for canine brain research and will improve and standardize processing and data analysis and interpretation in functional and structural MRI research.
Introduction
There is continual need to develop novel animal models for neurobiological and neuropsychological research. The domestic canine (canis familiaris) shows multiple advantages over more standard rodent and primate models and there is growing use of the dog as a model in neurocognitive, aging and clinical research. Unlike rodents and primates, dogs are highly-trainable and able to undergo non-invasive experimental procedures without restraint, including functional magnetic resonance imaging (fMRI)1,2. In addition, the canine brain has the advantage of being gyrencephalic, making it more similar to the human brain than rodent and avian models. Neurocognitively the canine shares similar behavioral and emotional responses to humans and are highly integrated into human society. These convergent sociocognitive skills places the dog in a unique position to increase our understanding of sociocognition in humans3. The aging canine is being routinely used as model for aging research due to its unique similarities to human brain aging and ability to link aging with learning memory and other cognitive functions4,5,6,7. The canine also suffers from some spontaneous neurological diseases analogous to that of humans, and as such can serve as a unique model for these disease processes including glioma8 and amyotrophic lateral sclerosis9. This growing use of the dog in non-invasive neuroscience, aging and neuropathogical research has generated a need for a standard canine brain atlas that provides common spatial referencing and architectonic based cortical segmentation for standardized data processing, analysis and interpretation3.
Several brain atlases have been made available for the canine10,11,12, however these atlases have limitations, being created from a low number of subjects10, using non-isovolumetric clinical magnetic resonance imaging (MRI) data12, or utilizing dogs that were not neurologically or clinically healthy11. In addition, there is no cortical atlas that provides a microarchitectonic based cortical parcellation for the canine brain12. Cortical brain atlases allow for standardized referencing of brain regions within a particular species and assist in the correlation of function and structural brain regions between species. Digital cortical atlases can be viewed 3-dimensionally and can be used for computational processing and transformation, a critical component for quantitative analysis of MRI data13.
Atlases of the cerebral cortex have been historically created by partitioning into regions with distinct laminar structures using histologically defined criteria. The most commonly used human MRI cortical atlases were created based on cytoarchitectonic maps created by the German anatomist Korbinian Brodmann14 which separated areas of the cortex according to cytoarchitectural organization. Although used commonly, there is a concern that these atlases do not provide sufficient neuroanatomical detail for the degree of cortical segregation more recently identified in neuroimaging research15,16. Though more fine-grained cytoarchitectonic atlases exist, such as Economo and Koskinas, 1925 atlas17 and Sarkisov, 1949 atlas18 they have not been widely utilized. For this reason there has been growing, interest in using a different component of neuronal organization, myeloarchitecture, to create a human cortical atlases such as the one generated by anatomists Oskar and Cecile Vogt16,19,20 and Flechsig21. The atlases by Vogt17,20,21 divide the cortex according myeloarchitecture using the density, orientation and configuration of myelinated axons resulting in the division of the human cortex into 185 regions. These regions are thought to be complementary to cytoarchitectonic based cortical divisions. Currently, a “supermap” of the human neocortex is being created using myeloarchitectonics from the Vogt-Vogt School and has the potential to be a tool that is more detailed and morphologically more accurate than currently available cytoarchitectonic atlases16. Similarly research by Walters22 have shown have shown a direct correlation between the myeloarchitecture of the human cortex and MRI signal intensities could be applied to other species.
The canine cortex has been intricately studied by Jerzy Kreiner who generated a comprehensive myeloarchitectonic-based cortical atlas23,24,25,26,27,28. These document the parcellation of the cortex according to the size, staining, appearance, and arrangement of radial and tangential myelinated fibers and the appearance of myelinated fibers in the superficial plexus24. These manuscripts provide detailed surface and cross-sectional illustrations to show the exact margins of each region, facilitating segmentation23,24,25,26,27,28. They intricately segment the cortex into regions, similar to that described by the Vogt-Vogt school16.
In this manuscript we create a stereotactic cortical atlas for the mesaticephalic canine brain based on data from Kreiner’s myeloarchitectonic parcellations. This cortical atlas is created with a population average template generate from high-resolution 3-dimensional T1-weighted data obtained from 30 neurologically normal dogs. This quality assured and validated atlas includes tissue segmentation maps and a total of 234 cortical and subcortical priors. The atlas is provided in common neuroimaging informatics technology initiative (NIfTI) format and can be integrated into standard neuroscience tools and pipelines for data analysis and processing. This comprehensive cortical atlas provides a reference standard for canine brain research and will improve and standardize processing and data analysis and interpretation in functional and structural MRI research.
Materials and Methods
Study population
For template creation, we recruited 30 dogs from research populations (Cornell University College of Veterinary Medicine). In order to limit the diversity of brain structure between subjects secondary to cranial conformation, we included only non-brachycephalic dogs considered clinically and neurological normal. The population was composed of 22 females and 8 males aged between 2 and 11 years of age (median 5.5, interquartile range 7.5). Ten of these subjects were beagles and twenty were of mixed breed, weighing between 7 and 30 kgs (median 13, interquartile range 12.75). All dogs were imaged for research purposes and the Cornell University Institutional Animal Care and Use Committee (IACUC protocol number: 2015–0115) approved their use (Table 1). All procedures were performed in accordance with the relevant guidelines and regulations.
For skull conformation compatibility testing, data sets from twelve dogs were recruited from a neurologically normal clinical research population (University of Sydney College of Veterinary Science). Five subjects were clinically healthy and seven were previously diagnosed with glaucoma affecting a single or both eyes. All dogs were female aged between 5 and 11 years of age (median 9, interquartile range 3.5). The cohort weighed between 4.7–35.3 kg (median 8.4, interquartile range 7.48) and included the following breeds, flat-coat retriever (n = 1), cocker spaniel (n = 2) and cattle dog (n = 1), Maltese crossbreed (n = 3), labradoodle (n = 3) and terrier crossbreed (n = 2) (Table 2). All dogs were imaged for research purposes and the University of Sydney Ethics Committee approved their use (Protocol no. 2017/1156).
MRI examination
Dogs imaged for template creation were imaged under general anesthesia performed by a board-certified veterinary anesthesiologist. Dogs were premedicated with dexmedetomidine (3 mcg/kg Dexdomitor 0.5 mg/ml, Zoetis Inc, Kalamazoo, MI), induced to general anesthesia with propofol to effect (3.2–5.4 mg/kg Sagent Pharmaceuticals, Schaumburg, III) and intubated. They were maintained under anesthesia with inhalant isoflurane and oxygen with a dexmedetomidine continuous rate infusion (1 mcg/kg/hr Dexdomitor 0.5 mg/ml, Zoetis Inc, Kalamazoo, MI). MRI was performed in a 3.0T General Electric (GE) Discovery MR750 (GE Healthcare, Milwaukee, WI) whole body scanner (60 cm bore diameter), operating at 50mT/m amplitude and 200T/m/s slew-rate. Subjects were placed in dorsal recumbency with their head centered in a 16-channel medium flex radio-frequency coil (NeoCoil, Pewaukee, WI 53072 USA). A high-resolution T1-weighted 3D inversion-recovery fast spoiled gradient echo sequence (Bravo) was performed in each subject with the following parameters; isotropic voxels 0.5 mm3, TE = 3.6 ms, TR = 8.4 ms, TI = 450 ms, excitations = 3, a flip angle of 12°, acquisition matrix size = 256 ×256.
Dogs imaged for skull shape compatibility validation were imaged under general anesthesia performed by a trained veterinary anesthesiologist. All animals were premedicated with methadone (0.1–0.4 mg/kg IM; Physeptone, Aspen Pharma Pty Ltd, St Leonards NSW) with or without acepromazine (0–0.03 mg/kg IM; ACP-2, Ceva Animal Health Pty Ltd, Glenorie NSW). General anesthesia was induced with propofol (4–6 mg/kg IV; Propofol, Sandoz Pty Ltd, Pyrmont NSW) or thiopentone (4 mg/kg IV; Pentothal, Link Medical Products Pty Ltd, Warriewood NSW) to effect and intubated. Inhalational isoflurane and oxygen maintained general anesthesia. Imaging was performed in a 3.0T GE Discovery MR750 (GE Healthcare, Milwaukee, WI) whole body scanner using an 8-channel extremity coil (HD Foot Ankle array, Invivo) with the dog positioned in dorsal recumbency. A T1-weighted 3D fast spoiled gradient recalled echo (FSPGR) pulse sequence was performed with the following parameters; isotropic voxels 0.6 mm3, TE = 2.8 ms, TR = 6 ms, TI = 450 ms, excitations = 1, flip angle = 12°, acquisition matrix size = 192 × 192, slice thickness = 0.6 mm.
Data processing
Preprocessing
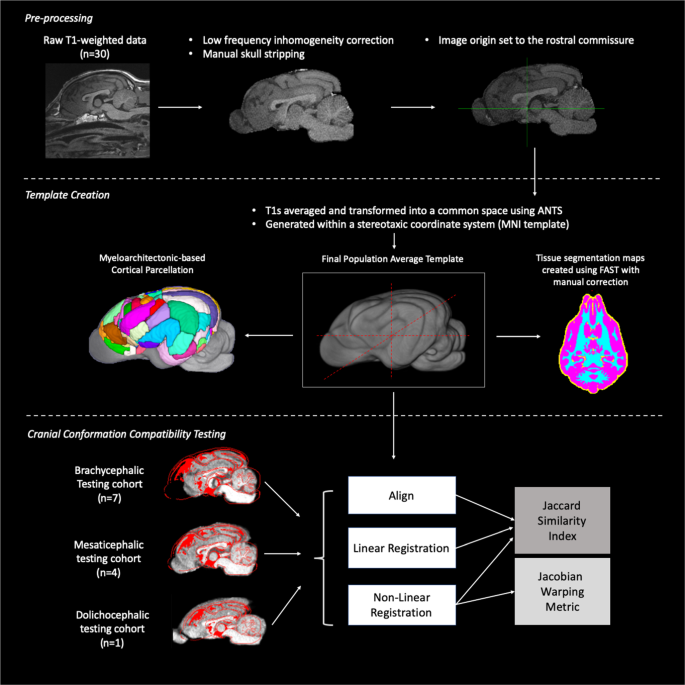
Isovolumetric T1-weighted data from the template group were used to create a population average atlas template. MRI data were corrected for low-frequency inhomogeneity29. A manual removal of non-brain tissues was applied prior to registration and spatial normalization30. The origin of images were manually set to the rostral commissure using SPM1231 and reoriented to a standard FMRI Software Library (FSL) orientation for inter-subject consistency where the x-axis contains right-left orientation, the y-axis contains the caudal-rostral orientation and the z-axis contains the ventral-dorsal orienation32. A flow chart depicts the steps we undertook during data processing and template validation (Figure 1).
Method flow chart: Flow chart demonstrating the pre-processing, template creation and cranial conformation compatibility testing steps that were performed. (n = number of subjects, ANTs = advanced normalization tools, FAST = FMRIB’s automated segmentation tool, MNI = Montreal Neurological Institute). This figure was created using FSLeyes (version 2.1 https://fsl.fmrib.ox.ac.uk/fsl/fslwiki/FSLeyes), OsiriX MD (version 11.0 https://www.osirix-viewer.com/osirix/osirix-md/) and Microsoft Powerpoint (version 16.16.19. www.microsoft.com).
Template creation
Previous atlas literature have tested linear and non-linear methods for template creation and consistently found non-linear registration using Advanced Normalization Tools (ANTs) to provide templates with the best contrast and signal to noise ratios12,33,34. For this reason, we opted to use non-linear registration methods to create our population average template. The individual subjects T1s were averaged and transformed into a common space population template using Advanced Normalization Tools (ANTs) which applied affine registration and diffeomorphic registration via the symmetric normalization (SyN) algorithm using the ANTs multivariate template creation script (Avants et al.35,36, 2010). This template was generated with a stereotaxic coordinate system according to the Montreal Neurological Institute (MNI) template specifications and in line with other animal templates12,37. The origin of the Cartesian system (x,y,z; 0,0,0) was centered on the mid-line over the dorsal aspect of the rostral commissure. The zero x-axis value sagittal plane extended through the center of the brain in line with the falx cerebri, the zero y-axis value transverse plane was parallel to the anterior commissure and transected the brain symmetrically and the zero z axis value dorsal plane ran from the dorsal rostral commissure to the mesencephalic aqueduct, ventral to the caudal commissure. Sagittal plane x-axis values increased left to right, transverse plane y-axis values increased caudal to rostral and dorsal plane z-axis values increased ventral to dorsal. All co-ordinates are provided in millimeters. A neuroanatomical expert evaluated the final template and compared to anatomic specimens for appropriate anatomical detail. Tissue segmentation maps (TSMs) were created from the template using FMRIB’s Automated Segmentation Tool (FAST) which segments brain matter into cerebral spinal fluid (CSF), grey matter (GM), and white matter (WM) while correcting for spatial intensity variations38. FAST was used to create partial volume maps, TSMs of each tissue type, binary segmentation masks and bias field maps. These maps were evaluated and manually corrected to ensure anatomical coherence with the T1 weighted scan. The corrected partial volume masks were used to calculate the tissue volume to account for partial volume effects and increase sensitivity. Figure 1 documents the template creation steps undertaken.
Determination of cranial conformation
Canine cranial conformation is highly variable between animals of different breed and genetic make-ups. There is currently no clear consensus on how to categorize dogs into brachycephalic (short-faced), mesaticephalic (medium-faced) and dolichocephalic (long-faced) groups. Milne et al. (2016) explored multiple different techniques and found that brain length correlated most strongly with a subjective categorization of brain conformation. For this reason, we utilized brain length parameters to identify the cranial conformation of all subjects included in the brain template and testing cohorts. Data sets with a brain length <68 mm were classified as brachycephalic, 72–87 mm were classified as mesaticephalic and >88 mm were classified as dolichocephalic11. These measures confirmed that the template cohort included 25 mesaticephalic and five dolichocephalic subjects (Table 1) and the testing cohort included seven brachycephalic subjects, four mesaticephalic and one dolichocephalic (Table 2).
Skull conformation compatibility
In order to test the impact of registration on brains with differing cranial conformation the testing cohort, made up of five mesaticephalic, one dolichocephalic and seven brachycephalic subjects, were registered and assessed for similarity to the template using the Jaccard similarity index and warping using the Jacobian warping metric. Individual subject data were corrected for low-frequency inhomogeneity (Tustison et al.29) and manual removal of non-brain tissues was applied. Each subject’s brain data were registered to the population template using alignment (center of image 0,0,0 at the anterior commissure with anatomical alignment through the rostral commissure and ventral brain regions), rigid linear registration (registering each subject to the template with six degrees of freedom) using FMRIB’s Linear Registration Tool (FLIRT)39 and nonlinear registration using FMRIB’s Nonlinear registration (FNIRT)40. Binary brain masks were generated for each subject at each level of registration i.e. aligned mask, linear mask, and nonlinear mask.
Jaccard similarity index
The degree of similarity between the individual subject and template masks was tested using the Jaccard similarity index. The index was able to calculate the amount of overlapping between individual subjects at each level of registration compared to the template mask. The Jaccard similarity index between the masks (i.e., subject 1 aligned to template mask etc.) was calculated using the following commonly used formula:
This measure of similarity was compared across skull shape groups and registration method to identify any significant differences between skull shape and similarity to the population template41. A one-way ANCOVA explored the differences between similarity metrics across registration techniques while controlling for interaction effects of body weight (kg), brain volume (mm3) and brain length. Similarly, an ANCOVA tested the differences in alignment similarity between brachycephalic and mesaticephalic groups while covarying for body weight (kg), brain volume (mm3) and brain length. Statistically significant differences or associations were considered present when p < 0.05.
Jacobian warping metric
In order to assess the degree of warping that each subject underwent during non-linear registration Jacobian determinants for each voxel were calculated as a measure of nonlinear warping. In order to visualize and explore the localization and pattern variation of warping across the dog cranial conformation groups, the log-demeaned absolute Jacobian warpfield images were tested for variation by one sample T-test using FSL’s randomize tool for permutation testing general linear models42 for each cranial conformation testing group, brachycephalic (n = 7) and mesaticephalic (n = 4). Since there was a single dolichocephalic subject, this group was not considered for testing. These permutations aim to test the null hypotheses that the mean variation is symmetrical and therefore centered around zero. The output t-statistic was corrected for multiple comparisons using threshold-free cluster enhancement and thresholded at p < 0.05 significance. A post hoc Tukey multiple comparisons of means at 95% family-wise confidence levels explored the differences between each registration method. Mean Jacobian warping metric for each subject across all voxels was plotted with each cranial conformation group. For visualization purposes three subjects’ (one brachycephalic, one mesaticephalic and one dolichocephalic) log demeaned Jacobian warpfields were presented in a 3D format to highlight regional variation across dogs of different skull shapes.
Cortical parcellation
Cortical parcellation into myeloarchitectonic regions was performed manually on the canine population template. Researchers divided the cortex into the following lobes; frontal, cingulate, parietal, sensori-motor, temporal (perisylvian) and occipital following the myeloarhitectonic articles from Jerzy Kreiner23,24,25,26,27,28. Lobe boundaries were established based on the demarcations in Kreiner’s articles. Within these lobes individual regions were parcellated based on Kreiner’s detailed descriptions and depictions of cortex surfaces, sagittal and transverse slices, and referencing histological atlases43,44. In total, 234 regions were parcellated by trained researchers (EFB and BR) and reviewed by a canine MRI anatomy expert (PJJ).
Results
Template
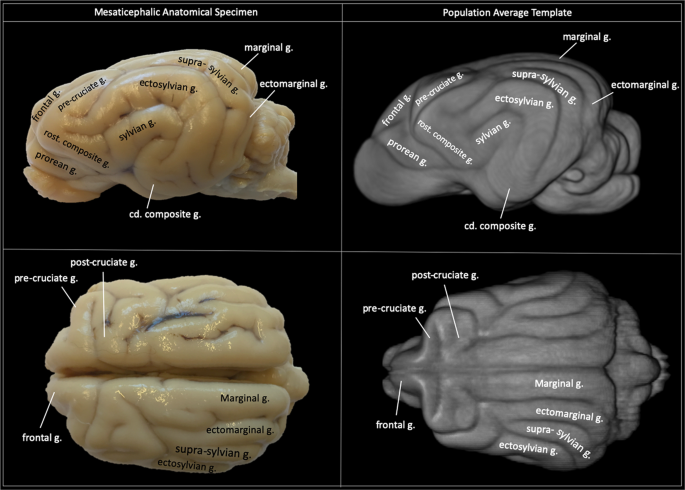
The final population template exhibited surface detail that corroborated well with an anatomic specimen (Figure 2). Generated tissue segmentation maps exhibited appropriate anatomic structure and correlated well to the grey and white matter definition of the temple.
Gyral anatomy: Demonstrates the gyral surface anatomy of the final population average template and correlates that to a mesaticephalic anatomic specimen. The anatomic specimen underwent emersion fixation in 10% buffered formalin after removal from the cranium (g. = gyrus, cd. = caudal, rost. = rostral). This figure was created using FSLeyes (version 2.1 https://fsl.fmrib.ox.ac.uk/fsl/fslwiki/FSLeyes) and Microsoft Powerpoint (version 16.16.19. www.microsoft.com).
Skull conformation compatibility
Jaccard similarity index
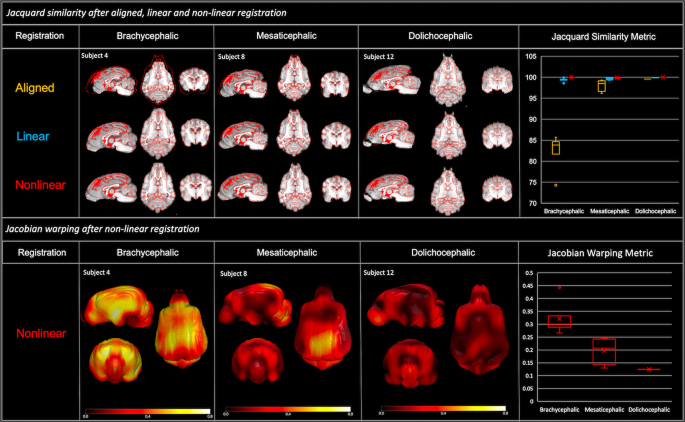
For each skull group, a one-way ANCOVA tested the differences between similarity metrics across registration techniques while controlling for interaction effects of body weight (kg), brain volume (mm3) and brain length. Within the brachycephalic group there was significant difference in similarity metrics across registration techniques while controlling for covariates mentioned above (F(2,12) = 144.58, p < 0.001). Post hoc Tukey multiple comparisons of means at 95% family-wise confidence levels showed a significant difference in similarity metrics between alignment and linear registration (p < 0.01) and alignment and nonlinear registration (p < 0.01) but no significant difference in similarity metrics between linear and nonlinear registration. Within the mesaticephalic group, there was a significant difference in similarity metrics across registration techniques while controlling for covariates mentioned above (F(2,8) = 5.29, p = 0.03). Post hoc Tukey multiple comparisons of means at 95% family-wise confidence levels showed a significant difference in similarity metrics between alignment and nonlinear registration (p = 0.04) (Figure 3).
Jacobian warping metric
The one samples t-test tested the variation in warping metrics in each skull group. Within the brachycephalic group there appeared to be high levels of warping in the frontal and olfactory cortices, and a large cluster of significant voxels survived multiple comparison correction and 0.95 thresholding. While we observed variations in warping in the mesaticephalic group, there were no significant clusters that survived correction. Variation in localization and magnitude was present across the three representative subjects for brachycephalic, mesaticephalic, and dolichocephalic skull shape (Figure 3).
Jaccard similarity after aligned, linear and non-linear registration: Provides a visual demonstration of the overlap of an individual subject’s brain data to the population average template (red outline) after alignment, linear and non-linear registration. A single sample subject from each cranial conformation group is provided. The mean similarity index for each subject was plotted in each cranial conformation group, according to registration technique (aligned = yellow, linear = blue, and non-linear = red). A post hoc Tukey multiple comparisons of means identified statistically significant difference in similarity index between aligned and linear and aligned and non-linear techniques in the brachycephalic group and between aligned and non-linear techniques in the mesaticephalic group. Jacobian warping after non-linear registration: Provides a surface heat map (range 0.0–0.8) demonstrating the degree of warping for a single representative subject for each cranial conformation group. The warping metric used is the log demeaned absolute Jacobian determinant for each voxel. The mean Jacobian warping metric for each subject was plotted within each cranial conformation group in the boxplot on the right side. These figures demonstrate that the highest degree of warping was present within the brachycephalic group. This figure was created using FSLeyes (version 2.1 https://fsl.fmrib.ox.ac.uk/fsl/fslwiki/FSLeyes), microGL (version 2.1 www.mricro.com) and Microsoft Powerpoint (version 16.16.19. www.microsoft.com).
Cortical and subcortical parcellation
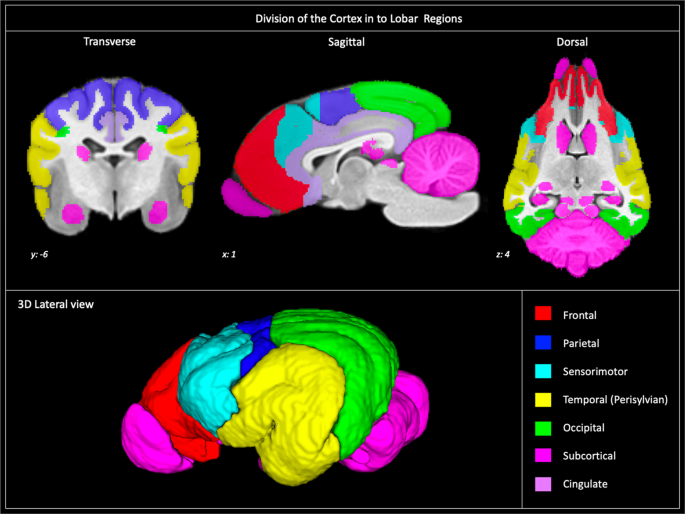
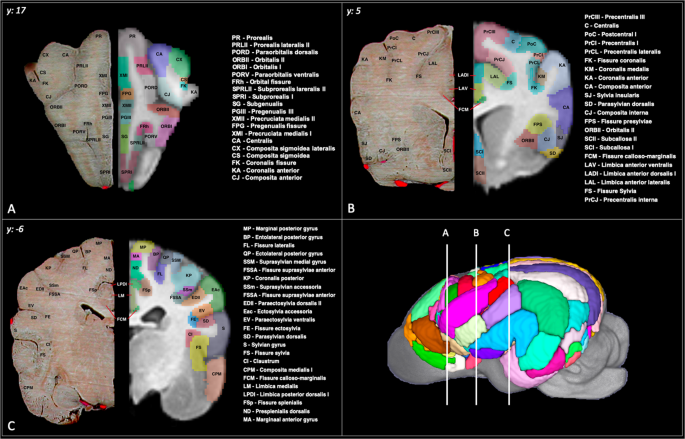
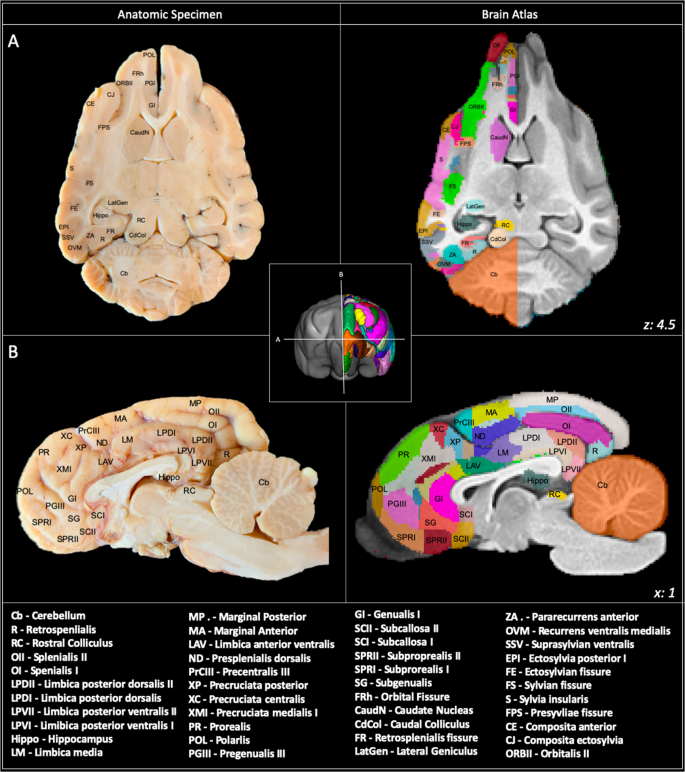
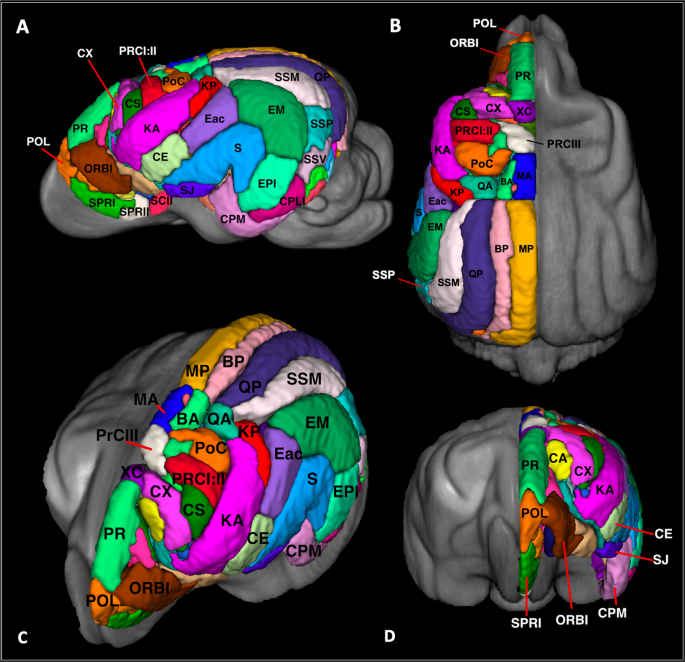
The brain was parcellated into seven lobar regions (Figure 4) and a total of 234 cortical and subcortical regions. The abbreviation, full name, gyrus, lobe and volume of each region is documented in Table 3. Transverse, sagittal and dorsal sliced images or the cortical parcellation with anatomic referencing is provided in Figures 5–7 and three -dimensional depictions provided in Figure 8.
Lobar divisions: Depicts how the brain was divided into lobar regions according to that described by Jerzy Kriener. These regions included frontal (red), parietal (blue), sensorimotor (cian), temporal (yellow), occipital (green), cingulate (mauve), and subcortical (pink). This figure was created using FSLeyes (version 2.1 https://fsl.fmrib.ox.ac.uk/fsl/fslwiki/FSLeyes), ITKsnap (version 3.8.0 www.itksnap.org), Affinity designer (version 1.8 www.affinity.serif.com) and Microsoft Powerpoint (version 16.16.19. www.microsoft.com).
Cortical atlas in transverse sections: Demonstrates the cortical atlas and a corresponding anatomic specimen in transverse section at frontal (A), caudate nuclei (B) and mid-thalamic (C) levels. The anatomic specimen underwent plasticization of the vasculature and fixation. The brain was transected and photographed in-situ within the cranium to maintain normal anatomic structure. This figure was created using FSLeyes (version 2.1 https://fsl.fmrib.ox.ac.uk/fsl/fslwiki/FSLeyes), ITKsnap (version 3.8.0 www.itksnap.org), Affinity designer (version 1.8 www.affinity.serif.com) and Microsoft Powerpoint (version 16.16.19. www.microsoft.com).
Cortical atlas in transverse sections: Demonstrates the cortical atlas and a corresponding anatomic specimen in transverse section at caudal thalamic (A), hippocampal (B) and occipital (C) levels. The anatomic specimen underwent plasticization of the vasculature and fixation. The brain was transected and photographed in-situ within the cranium to maintain normal anatomic structure. This figure was created using FSLeyes (version 2.1 https://fsl.fmrib.ox.ac.uk/fsl/fslwiki/FSLeyes), ITKsnap (version 3.8.0 www.itksnap.org), Affinity designer (version 1.8 www.affinity.serif.com) and Microsoft Powerpoint (version 16.16.19. www.microsoft.com).
Cortical atlas in sagittal and dorsal sections: Demonstrates the cortical atlas and a corresponding anatomic specimen in dorsal (A) and sagittal (B) section. The anatomic specimen brain underwent immersion fixation before transection and photography. This figure was created using FSLeyes (version 2.1 https://fsl.fmrib.ox.ac.uk/fsl/fslwiki/FSLeyes), ITKsnap (version 3.8.0 www.itksnap.org), Affinity designer (version 1.8 www.affinity.serif.com) and Microsoft Powerpoint (version 16.16.19. www.microsoft.com).
Cortical atlas in 3-dimensions: Demonstrates the 3-dimensional figures of the cortical atlas in lateral (A), dorsal (B) and oblique (C) and frontal (D) orientations. This figure was created using FSLeyes (version 2.1 https://fsl.fmrib.ox.ac.uk/fsl/fslwiki/FSLeyes), ITKsnap (version 3.8.0 www.itksnap.org), Affinity designer (version 1.8 www.affinity.serif.com) and Microsoft Powerpoint (version 16.16.19. www.microsoft.com).
Frontal parcellation
The frontal region was delineated by adapting from what Brodmann termed the “regio frontalis” in man14 and was bordered ventrally by the anterior rhinal sulcus and caudally by the sylvian and genual sulci25. This region involved the orbital, pregenual, proreus and subproreus gyri and was segmented into 17 different regions per hemisphere. These regions had a mean volume of 1042.4 mm3 (+/−918.1) (Table 3).
Sensori-motor parcellation
The sensori-motor region was delineated according to that described by Woosley and his associates45 and includes the pre-cruciate, anterior composite, precentral, postcentral and coronal gyri26. This region was segmented into 23 different regions per hemisphere. These regions had a mean volume of 1266.5 mm3 (+/−1037.0) (Table 3).
Cingular parcellation
The cingular cortex represents the limbic region in the dog and comprises subcallosal, genual, anterior cingulate and posterior cingulate gyri. It lies adjacent to the callosal commissure and is borders the deep fissure splenialis dorsolaterally, genual fissure rostrally and caloso-marginalis fissure ventrally24. This region was segmented into 15 different regions per hemisphere. These regions had a mean volume of 528.3 mm3 (+/−261.5) (Table 3).
Parietal parcellation
The parietal region lies caudal to the sensori-motor cortex and is bordered by the splenial fissure medially and suprasylvian fissure laterally. This area includes regions of the entolateral, marginal, coronal, presplenial, ectolateral and suprasylvian gyri and is divided into 16 regions per hemisphere23. These regions had a mean volume of 544.8 mm3 (+/−440.3) (Table 3).
Temporal (peri-sylvian) parcellation
This region lies laterally and includes the sylvian, ectosylvian and posterior composite gyri and functionally represents the auditory cortex28. This area is divided into 13 different hemispheric regions. These regions had a mean volume of 2889.4 mm3 (+/−1618.3) (Table 3).
Occipital parcellation
This region lies caudally within the brain and its margin borders the posterior rhinal, retrosplenial and posterior suprasylvian fissures. It includes regions within the entolateral, marginal, ectolateral, medial occipital, suprasylvian, recurrens and pararecurrents gyri27. This area was segmented into 24 different regions according to the myeloarchitectonic structure. These regions had a mean volume of 2405.2 mm3 (+/−2274.3) (Table 3).
Subcortical parcellation
These regions were delineated according to anatomic descriptions43 and included the amygdala, caudate nuclei, rostral and caudal colliculus, cerebellum, hippocampi, lateral and medial geniculate nuclei and olfactory bulbs. We included only regions whose boundaries were readily visible on the T1-weighted atlas were included in these segmentations. These regions had a mean volume of 6906.9 mm3 (+/−11776.5) (Table 3).
Using this brain atlas
This atlas can be used with common MRI toolboxes such as FSL (https://fsl.fmrib.ox.ac.uk/fsl/fslwiki) and ANTs (http://stnava.github.io/ANTs/) to perform linear or nonlinear registration from subject’s T1 native space to the atlas T1 population space or, inversely, to register T1 population template to a subject’s T1 native space. The authors would suggest using either FSL’s FLIRT (https://fsl.fmrib.ox.ac.uk/fsl/fslwiki/FLIRT) for linear registration or ANTs SyN35 for nonlinear registration, saving the transformation matrices of these registrations and applying them to the brain atlas or other masks. Visual or manual registration can be conducted with itk-SNAP46 if necessary or desired. To view the atlas with labels users can use FSLeyes (https://zenodo.org/record/3530921#.Xkbq1hdKhUM). Once the atlas is loaded the atlas search tab can be used to identify and isolate specific regions by label name.
Ethics statement
All animal use associated with this study was approved by institutional ethics or animal care and use committees.
Discussion
We present a comprehensive cortical atlas for the canine brain based on cortical myeloarchitecture. This atlas includes a population average template generated from 30 neurologically normal non-brachycephalic canines and TSMs for GM, WM and CSF. Cortical parcellation resulted in the generation of 234 cortical and subcortical priors from frontal, sensorimotor, parietal, temporal (perisylvian), occipital, cingular and subcortical regions. Non-linear registration of canine brains from mesaticephalic, dolichocephalic and brachycephalic cranial conformation resulted in high levels of similarity but significant warping within the brachycephalic group. The atlas is made available through an online repository https://ecommons.cornell.edu/handle/1813/67018.
Importance of this brain atlas
This is the most comprehensive architectonically parcellated cortical atlas created for the dog, an essential neuroscientific animal model. Modern stereotaxic brain atlases are a vital tool for neuroimaging research with far-reaching applications in data normalization, registration, segmentation and parcellation47. The lack of a detailed cortical atlas has, so far, limited researchers working with the dog model3. Although an increasing number of studies perform fMRI on the awake and anesthetized canines, the lack of an accepted high-quality canine atlas has limited group-level and cortical region of interest analyses2,48,49,50,51,52. Our atlas is a vital tool that will help standardize cortical localization of regions of functional activation improving our understanding of the functional-structural correlation of the canine brain.
Analyzing the resting-state default mode network is a promising area of research in the canine1. However, as yet, only independent component analysis (ICA) and manually placed seed-based analysis have been performed52. Our atlas provides whole-brain architectonic based cortical priors that could standardize seed-based functional connectivity analysis and assist in interpreting ICA. Vogt and Vogt suggested that the unique nature of each cortical region’s myeloarchitectonic structure indicated that every region has a separate and specific function53. fMRI has helped to identify specific regions of the brain that respond to different stimuli, including audition54, olfaction50,55 and visual facial processing48. Correlating these findings to our cortical brain atlas could help define the functional relevance of these architectonically distinct regions, taking us a step further in understanding the structure-function relationship of the canine brain and how this correlates to what is already well established in humans.
Cortical parcellation can be performed using multiple methods, including architectonics, surface structure, connectivity, electrophysiology and function. The paucity of functional, electrophysiological and connection data for the dog precluded the use of these techniques to create a comprehensive cortical atlas. Architectonic based cortical parcellation has historically created the most important and readily used atlases in the human14 and multiple animal models56,57. Architectonics uses cellular structure and organization to delineate boundaries within the cortex and includes both cytoarchitectonic and myeloarchitectonic methods. In the dog comprehensive histology-based atlases have been created using both cytoarchitectonic and58,59,60 and myeloarchitectonic23,24,25,26,27,28 techniques. The cytoarchitectonic based atlases are relatively simple, exhibit considerable variation in cortex partitioning, and lack cross-sectional illustrations. Thus, making accurate delineation of cortical regions throughout the complex canine brain extremely challenging58,59,60. Also, fMRI research raises the concern that cytoarchitectonic based atlases underestimate the degree of cortical partitioning at a functional level16,61,62. For these reasons, we created our cortical atlas with guidance from the comprehensive series of papers documenting cortical parcellation according to myeloarchitectonic structure by Jerzy Kreiner23,24,25,26,27,28.
Kreiner divided the cortex by assessing the size, staining, appearance, and arrangement of radial and tangential fibers and the appearance of fibers in the superficial plexus24. Myeloarchitectonic based cortical parcellation was the initial technique used to divide the human cortex by the anatomists Cecil and Oskar Vogt20. This technique is thought to corroborate with cytoarchitectonic based cortical divisions and has been used to create a cortical “supermap” in man16,20. When Kreiner compared his myeloarchitectonic cortical division of the canine brain to atlases using cytoarchitectonic based parcellation, there were both similarities and apparent differences in parcellation of the cortex between techniques23,24,25,26,27,28,58,59,60. In the human brain, parcellation similarly identified disparities between the Vogt-Vogt myeloarchitectonic atlas and the cytoarchitectonic-based Brodmann atlas. However, when Vogt and Vogt, and multiple other researchers combined these techniques, they described complete concordance between cytoarchitectonic and myeloarchitectonic based regions20,63,64,65.
Myeloarchitectonic cortical parcellation identifies boundaries within the cortex according to the organization and structure of myelinated fiber layers and radial bundles19. Myelin has a specific signal intensity on MRI and recently non-invasive imaging techniques have been used to create cortical myelin maps in vivo. These techniques take advantage of the intensity differences between degrees of myelination within grey matter observed on T1 and T2 weighted sequences and create cortical myelin maps with distinctive patterns of light, moderate and heavy myelination66. These in vivo maps have been found to correlate well with both cytoarchitectonic and myeloarchitectonically defined cortical boundaries16,66,67,68. In vivo cortical myelin maps have not, as yet, been generated for the canine and our atlas serves as a useful tool for validation and interpretation of future study in this area.
It is optimal to utilize an atlas that most closely resembles the brain structure of the study population47. Dogs have highly variable brain structure depending on their cranial conformation and breed69,70. Most importantly, brachycephalic dogs exhibit shortening of the cranium that causes ventral pitching of the brain’s long-axis and a ventral shift of the olfactory lobe69. The degree of brain deformity associated with brachycephaly warrants a specific brachycephalic population template, as is provided by Milne et al.11. With this in mind, we limited differences in brain structure within our template cohort by including only dogs with mesaticephalic or dolichocephalic cranial conformation and excluding brachycephalics. As a result, our atlas is most suitable for non-brachycephalic canine cohorts, which includes the most common pet dog breeds, the golden retriever, Labrador retriever, German shepherd dog, and the most commonly used research dog breed, the beagle. When we tested the effect of registration of subjects with brachycephalic cranial conformation to the final template, we found that although non-linear registration resulted in a high degree of similarity between the template and the subject, there was an associated high level of data warping. Excessive degrees of warping can create artifact and misclassification of tissues and structures47,71. Considering this limitation is essential when using this atlas in populations of dogs with brachycephalic cranial conformation. The development of parcellated cortical atlases specific to dogs with brachycephaly cranial conformation could be a focus of further study.
The dog is becoming an increasingly important animal model for neurocognitive, translational and comparative neuroscience research; however, tools such as a cortical brain atlas, are required to support research in this species3. We generated this cortical brain atlas from high-quality isovolumetric T1-weighted data obtained from 30 neurologically and clinically healthy dogs. It includes a population average template, tissue probability maps and 234 cortical and subcortical priors from frontal, sensorimotor, parietal, temporal (perisylvian), occipital, cingular and subcortical regions. The resulting population template has been validated using additional populations of mesaticephalic, brachycephalic and dolichocephalic skull conformations. This atlas will improve tissue segmentation and cortical region delineation and represents a unique and vital tool to facilitate neuroimaging research in this useful animal model.
Data availability
The presented data set are stored in NIFTI-1 format and can be viewed on readily available imaging software including SPM and FSL (Analysis Group, FMRIB, Oxford, UK). All data including the T1-weighted population average canine brain template, cortical and subcortical priors, tissue segmentation maps are available at the following online resource center https://ecommons.cornell.edu/handle/1813/67018.
Change history
23 February 2021
A Correction to this paper has been published: https://doi.org/10.1038/s41598-021-84559-1
References
Thompkins, A. M., Deshpande, G., Waggoner, P. & Katz, J. S. Functional Magnetic Resonance Imaging of the Domestic Dog: Research, Methodology, and Conceptual Issues. Comp. Cogn. Behav. Rev. 11, 63–82 (2016).
Berns, G. S., Brooks, A. M. & Spivak, M. Functional MRI in awake unrestrained dogs. PLoS One 7 (2012).
Bunford, N., Andics, A., Kis, A., Miklósi, Á. & Gácsi, M. Canis familiaris As a Model for Non-Invasive Comparative Neuroscience. Trends Neurosci. 40, 438–452 (2017).
Head, E. A canine model of human aging and Alzheimer’s disease. Biochimica et Biophysica Acta - Molecular Basis of Disease 1832, 1384–1389 (2013).
Cummings, B. J., Head, E., Ruehl, W., Milgram, N. W. & Cotman, C. W. The canine as an animal model of human aging and dementia. Neurobiol. Aging 17, 259–268 (1996).
Mazzatenta, A., Carluccio, A., Robbe, D., Giulio, C. D. & Cellerino, A. The companion dog as a unique translational model for aging. Semin. Cell Dev. Biol. 70, 141–153 (2017).
Gilmore, K. M. & Greer, K. A. Why is the dog an ideal model for aging research? Exp. Gerontol. 71, 14–20 (2015).
Hubbard, M. E. et al. Naturally Occurring Canine Glioma as a Model for Novel Therapeutics. Cancer Invest. 36, 415–423 (2018).
Nardone, R. et al. Canine degenerative myelopathy: A model of human amyotrophic lateral sclerosis. Zoology 119, 64–73 (2016).
Datta, R. et al. A Digital Atlas of the Dog Brain. PLoS One 7 (2012).
Milne, M. E. et al. Development of representative magnetic resonance imaging–based atlases of the canine brain and evaluation of three methods for atlas-based segmentation. Am. J. Vet. Res. 77, 395–403 (2016).
Nitzsche, B. et al. A stereotaxic breed-averaged, symmetric T2w canine brain atlas including detailed morphological and volumetrical data sets. Neuroimage 187, 93–103 (2018).
Woodward, A. et al. Data descriptor: The Brain/MINDS 3D digital marmoset brain atlas. Sci. Data 5, 1–12 (2018).
Brodmann, K. Vergleichende Lokalisationslehre der Großhirnrinde. (1909).
Amunts, K. & Zilles, K. Architectonic Mapping of the Human Brain beyond Brodmann. Neuron 88, 1086–1107 (2015).
Nieuwenhuys, R., Broere, C. A. J. & Cerliani, L. A new myeloarchitectonic map of the human neocortex based on data from the Vogt–Vogt school. Brain Struct. Funct. 220, 2551–2573 (2015).
Economo, C. von & Koskinas, G. Die cytoarchitektonik der hirnrinde des erwachsenen menschen. (1925).
Sarkisov, S. 1949, G. P.- & 1949, undefined. Cytoarchitectonics of the human cerebral cortex.
Nieuwenhuys, R. The myeloarchitectonic studies on the human cerebral cortex of the Vogt-Vogt school, and their significance for the interpretation of functional neuroimaging data. Microstruct. Parcel. Hum. Cereb. Cortex From Brodmann’s Post-Mortem Map to Vivo Mapp. with High-f. Magn. Reson. Imaging 55–125, https://doi.org/10.1007/978-3-642-37824-9_3 (2013).
Cecile, V. & Vogt, O. Allgemeinere Ergebnisse unserer Hirnforschung. J. Psychol. Neurol. 25, 292–398 (1919).
Flechsig, P. E. Anatomie des menschlichen Gehirns und Ruchenmarks auf myelogenetischer Grundlage. Thieme 1 (1920).
Walters, N. B. et al. In vivo identification of human cortical areas using high-resolution MRI: An approach to cerebral structure-function correlation. Proc. Natl. Acad. Sci. USA 100, 2981–2986 (2003).
Kreiner, J. Myeloarchitectonics of the parietal cortex in the dog. Acta Biol. Exp. (Warsz) (1964).
Kreiner, J. Myeloarchitectonics of the cingular cortex in dog. J. Comp. Neurol. 119, 255–267 (1962).
Kreiner, J. The myeloarchitectonics of the frontal cortex of the dog. J. Comp. Neurol. 116, 117–133 (1961).
Kreiner, J. Myeloarchitectonics of the sensori-motor cortex in dog. J. Comp. Neurol. 122, 181–200 (1964).
Kreiner, J. Myeloarchitectonics of the occipital cortex in dog and general remarks on the myeloarchitectonics of the dog. J. Comp. Neurol. 127, 531–557 (1966).
Kreiner, J. Myeloarchitectonics of the perisylvian cortex in dog. J. Comp. Neurol. 119, 255–267 (1962).
Tustison, N. J. et al. N4ITK: improved N3 bias correction. IEEE Trans. Med. Imaging 29, 1310–20 (2010).
Friston, K. J. et al. Spatial registration and normalization of images. Hum. Brain Mapp. 3, 165–189 (1995).
Penny, W., Friston, K., Ashburner, J., Kiebel, S. & Nichols, T. Statistical Parametric Mapping: The Analysis of Functional Brain Images. Statistical Parametric Mapping: The Analysis of Functional Brain Images, https://doi.org/10.1016/B978-0-12-372560-8.X5000-1 (2007).
Jenkinson, M., Beckmann, C. F., Behrens, T. E. J., Woolrich, M. W. & Smith, S. M. FSL. Neuroimage 62, 782–790 (2012).
Nitzsche, B. et al. A stereotaxic, population-averaged T1w ovine brain atlas including cerebral morphology and tissue volumes. Front. Neuroanat. 9, 69 (2015).
Stolzberg, D., Wong, C., Butler, B. E. & Lomber, S. G. Catlas: An magnetic resonance imaging-based three-dimensional cortical atlas and tissue probability maps for the domestic cat (Felis catus). Journal of Comparative Neurology 525, 3190–3206 (2017).
Avants, B. B. et al. A reproducible evaluation of ANTs similarity metric performance in brain image registration. Neuroimage 54, 2033–2044 (2011).
Avants, B. B., Epstein, C. L., Grossman, M. & Gee, J. C. Symmetric diffeomorphic image registration with cross-correlation: Evaluating automated labeling of elderly and neurodegenerative brain. Med. Image Anal. 12, 26–41 (2008).
Mandal, P. K., Mahajan, R. & Dinov, I. D. Structural brain atlases: design, rationale, and applications in normal and pathological cohorts. J. Alzheimers. Dis. 31(Suppl 3), S169–88 (2012).
Zhang, Y., Brady, M. & Smith, S. Segmentation of brain MR images through a hidden Markov random field model and the expectation-maximization algorithm. IEEE Trans. Med. Imaging, https://doi.org/10.1109/42.906424 (2001).
Jenkinson, M. & Smith, S. A global optimisation method for robust affine registration of brain images. Med. Image Anal. 5, 143–56 (2001).
Andersson, J. L. R., Jenkinson, M. & Smith, S. Non-linear registration aka spatial normalisation. FMRIB Technical Report TRO7JA2 (2007).
Allen, J. S., Damasio, H. & Grabowski, T. J. Normal neuroanatomical variation in the human brain: An MRI-volumetric study. Am. J. Phys. Anthropol., https://doi.org/10.1002/ajpa.10092 (2002).
Winkler, A. M., Ridgway, G. R., Webster, M. A., Smith, S. M. & Nichols, T. E. Permutation inference for the general linear model. Neuroimage, https://doi.org/10.1016/j.neuroimage.2014.01.060 (2014).
Adrianov, O. S. & Mering, T. A. Atlas of the Canine Brain. (Edwards Brothers Inc, 1964).
Fletcher, T. F. & Saveraid, T. C. Canine Brain MRI Atlas. University of Minnesota College of Veterinary Medicine (2018).
Woolsey, C. N. Some observations on brain fissuration in relation to cortical localisation of function. In Second International Meeting of Neurobiologists 64–69 (1960).
Yushkevich, P. A. et al. User-guided 3D active contour segmentation of anatomical structures: Significantly improved efficiency and reliability. Neuroimage 31, 1116–1128 (2006).
Evans, A. C., Janke, A. L., Collins, D. L. & Baillet, S. Brain templates and atlases. NeuroImage 62, 911–922 (2012).
Dilks, D. D. et al. Awake fMRI reveals a specialized region in dog temporal cortex for face processing. PeerJ 3, e1115 (2015).
Cook, P. F., Spivak, M. & Berns, G. S. One pair of hands is not like another: Caudate BOLD response in dogs depends on signal source and canine temperament. PeerJ 2014, 1–23 (2014).
Berns, G. S., Brooks, A. M. & Spivak, M. Scent of the familiar: An fMRI study of canine brain responses to familiar and unfamiliar human and dog odors. Behav. Processes 110, 37–46 (2015).
Berns, G. S., Brooks, A. & Spivak, M. Replicability and heterogeneity of awake unrestrained canine fMRI responses. PLoS One 8 (2013).
Kyathanahally, S. P. et al. Anterior–posterior dissociation of the default mode network in dogs. Brain Struct. Funct. 220, 1063–1076 (2015).
Vogt, C. & Vogt, O. Gestaltung der topistischen Hirnforschung und ihre Forderung durch den Hirnbau und seine Anomalien. J. Hirnforsch. 1, 1–46 (1954).
Andics, A., Gácsi, M., Faragó, T., Kis, A. & Miklósi, Á. Voice-sensitive regions in the dog and human brain are revealed by comparative fMRI. Curr. Biol. 24, 574–578 (2014).
Jia, H. et al. Functional MRI of the olfactory system in conscious dogs. PLoS One 9, (2014).
Reveley, C. et al. Three-dimensional digital template atlas of the macaque brain. Cereb. Cortex 27, 4463–4477 (2017).
Yuasa, S., Nakamura, K. & Kohsaka, S. Stereotaxic Atlas of the Marmoset Brain: With Immunohistochemical Architecture and MR Images. (2010).
Klempin. Uber die Architektonik der grosshirnrinde des Hundes. J. Psychol. Neurol. 12, 229–249 (1921).
Campbell, A. Histological studies on the localisation of the cerebral function (1905).
Gurewtisch, M. & Bychowsky, G. Zur Architektonik der Hirnrinde (Isocortex) desHundes. J. Psychol. Neurol. 35, 283–300 (1928).
Toga, A. W. & Thompson, P. M. What is where and why it is important. Neuroimage 37, 1045–1049 (2007).
Geyer, S. & Turner, R. Microstructural parcellation of the human cerebral cortex: From Brodmann’s post-mortem map to in vivo mapping with high-field magnetic resonance imaging. Microstruct. Parcel. Hum. Cereb. Cortex From Brodmann’s Post-Mortem Map to Vivo Mapp. with High-f. Magn. Reson. Imaging 5, 1–257 (2013).
Brockhaus, H. Die Cyto- und Myeloarchitektonik des Cortex claustralis und des Claustrum beim Menschen. J. Psychol. Neurol. 49, 249–348 (1940).
Gerhart, E. Die Cytoarchitektonik des Isocortex parietalis beim Menschen. J. Psychol. Neurol. 49, 367–419 (1940).
Sanides, F. The cyto-myeloarchitecture of the human frontal lobe and its relation to phylogenetic differentiation of the cerebral cortex. J. Hirnforsch. 47, 269–282 (1964).
Van Essen, D. C. & Glasser, M. F. In vivo architectonics: A cortico-centric perspective. Neuroimage 93, 157–164 (2014).
Glasser, M. F. & van Essen, D. C. Mapping human cortical areas in vivo based on myelin content as revealed by T1- and T2-weighted MRI. J. Neurosci. 31, 11597–11616 (2011).
Glasser, M. F., Goyal, M. S., Preuss, T. M., Raichle, R. E. & Van Essen, D. C. Trends and Properties of Human Cerebral Cortex: Correlations with Cortical Myelin Content. Neuroimage 44, 1113–1129 (2015).
Roberts, T., McGreevy, P. & Valenzuela, M. Human induced rotation and reorganization of the brain of domestic dogs. PLoS One 5 (2010).
Schmidt, M. J. et al. Comparison of the endocranial- and brain volumes in brachycephalic dogs, mesaticephalic dogs and Cavalier King Charles spaniels in relation to their body weight. Acta Vet. Scand. 56, 30 (2014).
Dickie, D. A. et al. Whole Brain Magnetic Resonance Image Atlases: A Systematic Review of Existing Atlases and Caveats for Use in Population Imaging. Front. Neuroinform. 11, 1 (2017).
Acknowledgements
We would like to acknowledge the assistance of Zonia Clancy, Carol Frederick and Nora Mathews for their assistance in handling and anesthesia during magnetic resonance imaging. We would also thank the Vaika foundation and the Bowman, Boesch and Cheetham Labs based at Cornell University College of Veterinary Medicine for their contributions. This work was supported by The Canine Research Foundation. The Foundation funded a portion of the canine magnetic resonance imaging costs.
Author information
Authors and Affiliations
Contributions
Data planning and acquisition was performed by P.J.J., J.P.L., W.L., K.L.G. and A.W. Data processing and segmentation was performed by P.J.J., B.C.R. and E.F.B. Anatomic correlation was performed by P.J.J. and M.F. Manuscript text was written by P.J.J. and image preparation performed by P.J.J. and E.F.B. Manuscript review was performed by all authors.
Corresponding author
Ethics declarations
Competing interests
The authors declare no competing interests.
Additional information
Publisher’s note Springer Nature remains neutral with regard to jurisdictional claims in published maps and institutional affiliations.
Rights and permissions
Open Access This article is licensed under a Creative Commons Attribution 4.0 International License, which permits use, sharing, adaptation, distribution and reproduction in any medium or format, as long as you give appropriate credit to the original author(s) and the source, provide a link to the Creative Commons license, and indicate if changes were made. The images or other third party material in this article are included in the article’s Creative Commons license, unless indicated otherwise in a credit line to the material. If material is not included in the article’s Creative Commons license and your intended use is not permitted by statutory regulation or exceeds the permitted use, you will need to obtain permission directly from the copyright holder. To view a copy of this license, visit http://creativecommons.org/licenses/by/4.0/.
About this article
Cite this article
Johnson, P.J., Luh, WM., Rivard, B.C. et al. Stereotactic Cortical Atlas of the Domestic Canine Brain. Sci Rep 10, 4781 (2020). https://doi.org/10.1038/s41598-020-61665-0
Received:
Accepted:
Published:
DOI: https://doi.org/10.1038/s41598-020-61665-0
This article is cited by
-
A detailed 3D MRI brain atlas of the African lungfish Protopterus annectens
Scientific Reports (2024)
-
Shape-changing electrode array for minimally invasive large-scale intracranial brain activity mapping
Nature Communications (2024)
-
Automatic brain extraction and brain tissues segmentation on multi-contrast animal MRI
Scientific Reports (2023)
-
Structural connectome alterations in anxious dogs: a DTI-based study
Scientific Reports (2023)
-
Central nodes of canine functional brain networks are concentrated in the cingulate gyrus
Brain Structure and Function (2023)
Comments
By submitting a comment you agree to abide by our Terms and Community Guidelines. If you find something abusive or that does not comply with our terms or guidelines please flag it as inappropriate.

