
Abstract
Previous studies in the long-term experiments at Pendleton, OR (USA), were focused on organic matter cycling, but the consequences of land management for nutrient status over time have received little attention. Soil and wheat (Triticum aestivum L.) tissue samples were analyzed to determine the macronutrient dynamics associated with residue management methods and fertilizer rate under a dryland winter wheat-fallow rotation. The treatments included: no burn residue incorporation with farmyard manure (FYM) or pea vines, no burn or spring burn with application of N fertilizer (0, 45, and 90 kg ha−1), and fall burn wheat residue incorporation. The results revealed no differences on the effect of residue burning on macronutrient concentration over time. After receiving the same treatments for 84 years, the concentrations of soil organic C, total N and S, and extractable Mg, K, P in the 0–10 cm depth significantly increased in FYM plots compared to the rest of the plots. The N fertilization rate of 90 kg ha−1 reduced the accumulations of P, K, and Ca in grain compared to the 0 and 45 kg N ha−1 applications. The results indicate that residue incorporation with FYM can play vital role in reducing the macronutrient decline over time.
Introduction
Crop yields are no longer increasing at the rate of a couple of decades ago1 and, simultaneously, the proportion of arable lands are also constantly shrinking2 – a condition that demands increased cultivation under dryland cropping systems. Therefore, examining various soil management practices and their impacts on soil quality, such as macronutrient status, of such regions may contribute to sustainable food production for the next 100 years. Despite the important roles of macronutrients for plant growth, few studies have evaluated their dynamics under dryland cropping systems over extended periods of time.
The drylands of the Pacific Northwest (PNW) receive an average annual precipitation of 150–437 mm3, while winter wheat requires 500–580 mm of water to complete its lifecycle4, and hence, annual dryland wheat production may not be successful in this region. To overcome this water limitation, farmers in this production region of more than two million hectares have opted to utilize a winter wheat-14 months fallow (WW-F) rotation for over 100 years. This system has so far been proven to be economical and stable5. In the WW-F cropping system, wheat is grown for ten months and the land is in fallow for 14 months to conserve winter precipitation for next year’s wheat6,7. However, during these 14 months of fallow, the surface is exposed to general degradation, wind erosion, and accelerated C and N losses6. Nevertheless, the WW-F cropping system has proven to be the best solution to sustain wheat production in these regions7, therefore, management strategies that can maintain or enhance long-term soil productivity are crucial for this region.
Wheat residue burning was a common soil management method during the 1930’s in the WW-F cropping system6, and is still being practiced by some farmers in the PNW8. The burning of crop residues is favored for better seedling growth, for suppression of plant disease and pest incidences, and to mitigate low soil temperature in the spring6. However, repeated burning may decrease SOC, reduce microbial activity, increase CO2 emissions, and cause air pollution9. The burning of crop residue has decreased soil organic C (SOC) by 20% to 60% within the last 40–50 years6,10. In contrast, incorporation of crop residue with N fertilizer and organic amendments has increased SOC storage, N, crop yield and biological activities in this region6,11. However, excess N fertilization may be detrimental to soil pH, be economically unjustified, and may result in a net loss of SOC due to enhanced crop residue decomposition12. The preceding notion can be debated because some studies have found N fertilization slowed SOC loss compared to no N fertilization13. This controversy highlights the uncertainty in the impacts of N fertilization on macronutrients, whereas FYM is ubiquitously known for its positive impacts on macronutrient levels12. Nevertheless, it is widely recognized that improved agricultural practices, such as residue and manure incorporation and proper N application, minimize the risk of soil nutrient depletion over time14. An understanding of how the above-mentioned crop residue management practices affect soil macronutrient concentrations over time is critical to evaluate the potential success of these practices in the region.
Our study was conducted on one of the several long-term experiments (LTE) maintained by the Columbia Basin Agricultural Research Center (CBARC), near Pendleton, OR. The LTE of our study, hereafter denoted by CR-LTE, was established in 1931 to evaluate the effect of different residue management practices (based on farmers’ practices in the 1930’s) on soil and crop productivity under the WW-F cropping system. Previous studies in CR-LTE demonstrated that N and SOC declined over time6,8. Besides N and SOC in the CR-LTE plots, the long-term effects of different residue management methods on other essential plant macronutrients such as P, K, Ca, S, and Mg are unknown. The knowledge of respective effects on soil macronutrients over time will provide insights into the sustainability of these management practices. This knowledge can then be utilized to fine-tune the systems and make them more resilient and sustainable for crop production. However, the effect of agricultural practices on nutrient status takes decades to manifest6. Under such conditions, only the analysis of archived soil and crop samples from the LTE can provide the resources to detect subtle changes in soil and crop nutrient status over time caused by the different management practices. We aimed to contribute to the limited knowledge of plant macronutrient dynamics in the soil and wheat grain from drylands of the PNW as affected by residue management. The objectives of this study were (i) to quantify the changes in macronutrients and soil pH brought about by different residue management methods and fertilizer inputs after applying the same treatment for at least 64 years and (ii) to determine the trends, if any, in the macronutrients and soil pH over a 20 year time (1995-2005-2015).
Results and Discussion
The main and interaction effects for total N, S, and SOC, and extractable P, K, Ca, Mg, and soil pH are presented in the ANOVA table (Supplementary Table S1).The concentrations of studied macronutrients and soil pH did not show evident trends as a function of residue management methods over 20 years (1995-2005-2015), but the macronutrients concentrations and pH differed among the treatments mostly in the top 10 cm soil depth in 2015. Thus, we mostly discussed the macronutrient status and soil pH in the upper 10 cm soil surface in year 2015 i.e. after the application of same treatments for 84 years.
Soil pH
After 84 years of WW-F rotation, FYM plots had markedly greater soil pH than the rest of the CR-LTE treatments in the 0–30 cm soil depth (Fig. 1A,B). The addition of FYM replenishes the soil with basic cations and maintains soil pH. Soil pH at top 20 cm soil depth was significantly lower in the NB90 and SB90 than in the FYM, PV, FB, SB, NB45, and SB45 which can be attributed to the greater nitrification from the ammoniacal N fertilizer in NB90 and SB90 than others. Greater acidity was observed at the 10–20 cm soil depth than the other soil depths in the NB90 and SB90 plots, possibly due to the fertilizer placement in that depth (Fig. 1A,B). We did not observe differences in soil pH between residue burn and no burn plots (excluding FYM and PV plots).
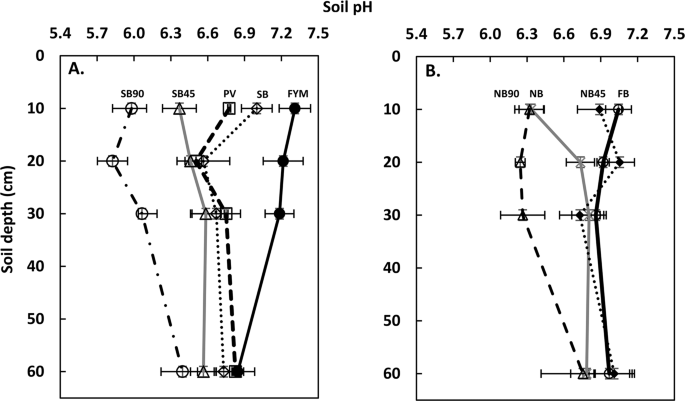
Soil pH depth function as affected by the different agricultural practices of CR-LTE in 2015. (A) PV, FYM, SB, SB45, and SB90. (B) FB, NB, NB45, and NB90. FB = Fall burn; FYM = Farmyard manure; PV = Pea vine; NB = No burn; SB = Spring burn; and 45 and 90 after NB and SB represents the rates (kg ha−1) of inorganic N applications in respective treatments.
Soil organic carbon (SOC) and total N
Although we did not observe any significant trends for macronutrients over the time, remarkably high concentrations of macronutrients were observed in FYM plots. The manure used in FYM plots supplied an average (10 years average) of 1482, 111, 31, 27 kg ha−1 of C, N, P, and S respectively6. In addition to this, typical solid livestock manure contains 2.3, 0.26, and 0.51% of K, Ca, and Mg respectively15. In 2015, the concentration of SOC in the 0–10 cm depth was significantly higher in FYM (14.6 g kg 1) than in the other treatments which were similar to each other (Fig. 2A). Similarly, the concentration of N in the top 10 cm was significantly greater in FYM than in the rest of the plots (Fig. 2B). At 0–10 cm depth, the FYM had a nitrogen concentration of 1.30 g kg−1 whereas FB, which had the lowest N concentration, had 0.76 g kg−1. The FYM plots received extra amounts of carbon and nitrogen along with the other nutrients which can be attributed to the greater concentrations of SOC and N in the FYM plots than the rest of the plots. This increase in N and SOC concentration can be corroborated by the fact that more organic C input to the soil increases the accumulation of organic N16 and reduces its mineralization17. Previous research has shown that manure incorporation increases the soil organic matter and the levels of soil macronutrients and their availability18,19,20,21.
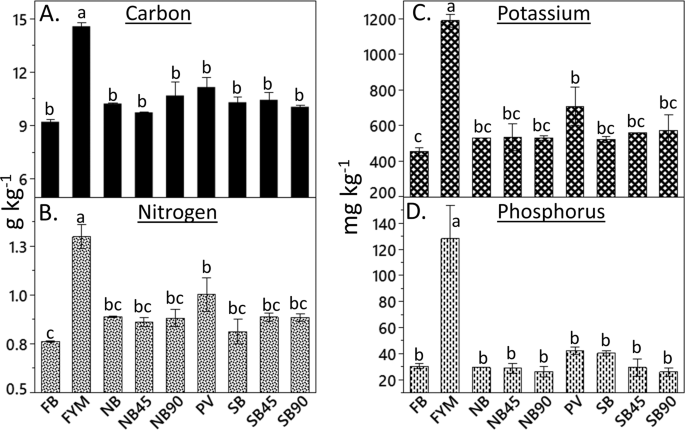
The effect of 84 years of residue management methods on soil nutrients in upper 10 cm soil surface. (A) Concentration of soil organic carbon, (B) Concentration of total nitrogen, (C) Concentration of Mehlich III extractable potassium, and (D) Concentration of Mehlich III extractable phosphorus. Bars sharing the same letter are not significantly different at the 0.05 probability level. FB = Fall burn; FYM = Farmyard manure; PV = Pea vine; NB = No burn; SB = Spring burn; and 45 and 90 after NB and SB represents the rates (kg ha−1) of inorganic N applications in respective treatments.
The decrease in the concentrations of SOC and N in these plots was reported previously8. Similarly, other researchers reported significant SOC and N declines during the 1990s in all the CR-LTE plots except in the FYM plots6,22. Machado et al.23 reported a significant decline in SOC over the time in 0–60 cm depth profile when compared to the SOC level from 1976 to 2005 in the same experiment. However, our results did not show a decreasing trend in 20 years’ time period for any studied nutrients in the CR-LTE plots. With this contradictory finding in SOC between our study and the previous studies in CR-LTE, we can speculate that the 20 years’ time period may be a short time period to manifest significant changes in the nutrient’s dynamics. In semiarid climate like our research site, ecological processes are very slow and takes more than couple of decades to detect marked change in SOC6.
According to Rasmussen et al.22, the application of inorganic N increases SOC compared to no N application because of its positive effect on the amount of crop residue produced. However, we did not observe significant differences in the SOC and soil N concentrations as a function of inorganic N application although significant grain yield differences in these plots were reported for different N application rates6. Similarly, Camara et al.11 reported significant yield differences in different N application rates in other LTE at CBARC. The results from this study agree with a study by Ghimire et al.8 who reported that varying N fertilizer application rates did not affect the concentrations of N or SOC. The plausible reason for unresponsive SOC or soil N to inorganic N application could be due to a rapid decomposition of crop residue in N applied plots compared with the plots without N application. The high N content of the crop residue enhanced residue decomposition when incorporated into the soil6,24. As a result, crop residue contribution was insufficient to significantly impact SOC and soil N in the SB45, SB90, NB45, NB90, SB, and NB plots24. In addition to the rapid decomposition of high N residue, fourteen months fallow period aggravate the depleted SOC pool by depriving the pool with organic matter for prolonged time.
Mehlich III extractable phosphorus (P) and potassium (K) in soil
The concentration of K was significantly higher in the FYM plots than in the rest of the CR-LTE plots (Supplementary Table S2). Potassium in the 0–10 cm soil depth of the FYM plots increased compared to the other CR-LTE plots in 2015 (Fig. 2C). The FYM and PV plots received more K with the addition of organic matter (OM) than the rest of the plots, but K concentrations were significantly higher only in FYM plots (Supplementary Table S2). The FYM plots had 37% greater K concentration in the top 10 cm soil than the K at the same soil depth in PV. The increased concentration of K with the addition of FYM had been reported in other studies25,26. Since manure contains high K, repeated application of manure in the FYM plots could have maintained or increased extractable K compared to the other CR-LTE plots. Another plausible reason for this is that organic manure triggers cation exchange sites to release organic colloids which in turn attracts K from non-exchangeable pools and eventually increases the K availability27.
The concentration of P in FYM plots was significantly higher at the 0–10 and 10–20 cm soil depths than in the rest of the CR-LTE plots for all the studied years (Supplementary Table S3). In 2015, phosphorus concentration in the top 10 cm soil depth was 80% higher in FYM plots than in SB90 plots which had the lowest P among the treatments (Fig. 2D). The reason for greater concentration of extractable P in the FYM plots than the rest of the CR-LTE plots is due to the manure application in the FYM plot. Generally, when manure application is based on N requirement by crop, P and K will be over applied28. Another reason for increased P in FYM plots could be due to the decreased P adsorption to mineral surfaces and improved microbial population with manure addition, which enhances release of readily available P29. Overall, the concentration of extractable P at all studied depths was in the following order: FYM > PV > NB90, with the other treatments being between PV and NB90 (Supplementary Table S3).
Soil total Sulfur (S) and Mehlich III extractable magnesium (Mg)
Among CR-LTE plots, FYM had higher S concentration than the other plots at all depths except in the 30–60 cm depth in 2015 (Fig. 3A,B). Greater S under FYM treatment is plausible because S is an integral part of OM and FYM received more organic matter than the other plots. All other CR-LTE treatments were comparable in S concentration at 30–60 cm depth (Fig. 3A,B).
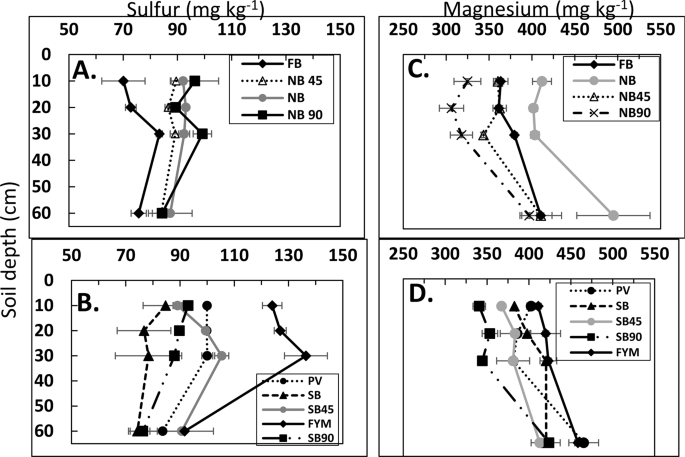
Soil depth function of total sulfur in 2015. (A) FB, NB, NB45, and NB90 plots, (B) PV, FYM, SB, SB45, and SB90 plots. Soil depth function of Mehlich III extractable magnesium in 2015. (C) FB, NB, NB45, and NB90 plots and (D) PV, SB, SB45, SB90, and FYM. FB = fall burn; FYM = Farmyard manure; NB, NB45 and NB90 = No burn with N applied at 0 kg ha−1, 45 kg ha−1, and 90 kg ha−1, respectively; PV = pea vine; SB, SB45 and SB90 = spring burn with N applied at 0 kg ha−1, 45 kg ha−1, and 90 kg ha−1, respectively.
In the 0–10 cm soil depth, the concentration of extractable Mg was greater in the FYM and PV plots than in the SB45, SB90, NB45, and NB90 plots (Fig. 3C,D). The higher amount of extractable Mg in FYM and PV plots could be attributed to the addition of OM through manure or pea vines that directly contributes to the soil Mg. The higher concentration of Mg in 30–60 cm soil depth than in the topsoils could be due to the displacement of Mg by K. Due to the competition between these ions for exchange sites, with K having the larger molecular size than Mg, potassium ion can easily displace Mg30. The concentration of K was greater in topsoils than in subsoils in this study and so, Mg could have been moved to lower soil depth (Supplementary Table S2).
We did not observe differences in soil macronutrients between residue burn and no burn plots (excluding FYM and PV plots) (Supplementary Tables S2–S5). Perhaps the more favorable seedbed temperature and reduced insect/disease incidence in burned plots during germination may have offset the loss of nutrients to the atmosphere caused by burning. Increased biomass yield can be expected from the favorable seed bed and reduced insect/pest incidence. The biomass eventually decomposes and releases several nutrients. However, this benefit of burning could be annulled when residue is burned which increases nutrient loss to the atmosphere. Nevertheless, burning of residue, especially fall burning, is not recommended in the inland PNW as farming in most areas is performed on 8 to 30% slopes (some slopes as steep as 45%) and soils on such slopes can be vulnerable to erosion in the absence of cover for a prolonged period. Burning of residue could also result in erosion-induced nutrient loss over time.
Total concentration of nutrients in wheat grain and straw
There were main and interaction effects of year and treatments on the nutrient accumulation in wheat grain and straw (Supplementary Table S6). Significant treatment effects were observed for total concentrations of C, P, K, Ca, and Mg in wheat grain. Total concentration of C in wheat straw was affected by the treatment. Only the significant effects are discussed below.
Wheat tissue nitrogen (N) and sulfur (S)
Nitrogen and sulfur are two important nutrients for wheat grain and straw because the concentration of N and S determines grain and straw quality. Higher grain N was found in the NB90 treatment compared with plots without inorganic N application (FB, SB, and NB), while N in grain in the NB90 plots was comparable to that in the FYM plots (Supplementary Table S7). The NB90, SB45 and SB90 plots had similar grain N concentrations in 2015 (Supplementary Table S7). In this study, grain N linearly increased with time (Fig. 4A), which could possibly be due to the less rainfall during the 2015 growing season compared with the rainfall in 2005, which was also lower than the rainfall in 1995 (Supplementary Fig. S1). Water stress increases N in grain31.
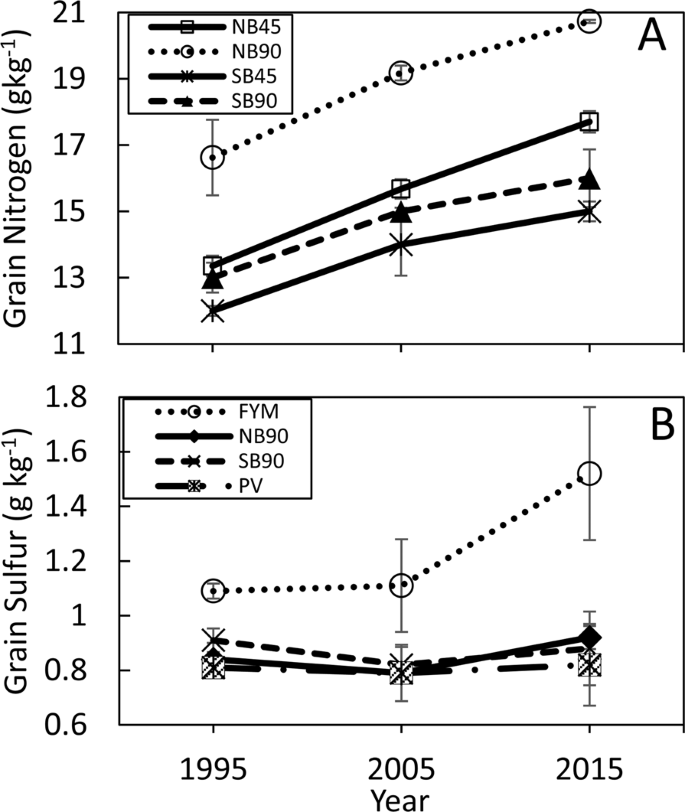
Effect of nitrogen (N) rates on grain N over time (A) and effect of organic amendments and N on grain S over time (B). FB = fall burn; FYM = Farmyard manure; NB, NB45 and NB90 = No burn with N applied at 0 kg ha−1, 45 kg ha−1, and 90 kg ha−1, respectively; PV = pea vine; SB, SB45 and SB90 = spring burn with N applied at 0 kg ha−1, 45 kg ha−1, and 90 kg ha−1, respectively.
Grain S of 1.2 mg S g−1 is considered as the minimum threshold limit for S deficiency in wheat32. The concentrations of S in grain were noticeably higher in FYM plots than the rest of the CR-LTE treatments, and increased from 1995 to 2015 (Fig. 4B and Supplementary Table S7). Only FYM plots had S above the measurement threshold level. Wheat grain has a higher pearling index and decreased dough elasticity when grain S is below the threshold level, which is not a desired trait for marketable grain33.
Wheat tissue carbon (C) and phosphorus (P)
Carbon concentration in wheat grain was affected by treatments and was greater in the SB45, SB90, NB45, NB90 than in FB and SB (Table 1). The accumulation of N in grain has positive correlation with C in the grain34, and SB45, SB90, NB45, NB90 plots had greater N than in FB and SB plots. This could be the reason for greater concentrations of C in the N applied treatments than in the plots without N application. Regarding C in the straw, FYM plots had the highest concentration of C among the CR-LTE (Table 1) suggesting the more pronounced effect of organic N (manure) on C in straw than from inorganic N.
The concentration of P in grain under the FYM (3.21 g kg−1) treatment was significantly higher than that under the rest of the treatments (Table 1). Nitrogen application decreased grain P in both the spring burn and no burn treatments (Table 1), which could be due to the low soil pH in the inorganic N applied plots. Wang et al.27 reported higher P in manure treated soil and subsequently higher P uptake by wheat in FYM treatment. The results from this study agree with the preceding report, as FYM had highest soil P and the highest grain P.
Wheat tissue total cations (K, Ca, and Mg)
Organic and inorganic amendments affected the concentrations of K, Ca, and Mg in grain (Table 1). The FYM plots had higher concentrations of K, Ca, and Mg than in the inorganic N applied plots (Table 1). The results indicate that inorganic N affected the absorption of cations, possibly by the competition of NH4 + (UAN) with K, Ca, and Mg (cations) on the exchange sites and also due to the decreased soil pH. Consequently, low concentrations of K, Ca, and Mg were observed under inorganic N applied plots. The decreased availability of cations in the soil solution were reflected in low cation accumulations in the grain of inorganic N applied plots. Another plausible reason for increased cations in the FYM plots compared to non-organic amended plots is due to the presence of cations in FYM. Applying FYM increases cation availability ion the soils over time. There were no differences in K, Ca, and Mg in grain between residue burn plots and no burn plots (Table 1).
The following inferences can be made from the results of this study:
- (a)
Inorganic N application does neither increase (i) available soil nutrients nor (ii) tissue concentrations of macronutrients over time compared to FYM, and cannot replace FYM application. However, PV application can be replaced by inorganic N application and vice-versa.
- (b)
Excluding FYM and PV plots, both (i) spring burning of plant residues or (ii) no burn treatments have similar impacts on soil and tissue macronutrients over time under dryland WW-F rotation in the PNW.
- (c)
Desirable lower protein content of soft white winter wheat can be obtained by spring burning of residues, but not through “no burn” of residues. The NB90 plots had 12% (2.07% N × 5.8) protein in grain, whereas the SB45 and SB90 (9.4% protein) plots maintained the optimum protein content for soft white winter wheat, which is 9–10%.
- (d)
Soil acidification increased over time by the application of inorganic N, whether the N is applied to burned or unburned residue plots.
Conclusions
This study determined the long-term impacts of the inorganic N application, manure, and pea vines, in residue incorporated (either burned or unburned) long-term plots. The results indicated that the incorporation of pea vines does not offer significant benefits for reducing macronutrient decline compared to the application of inorganic N. However, manure application showed superior performance than rest of the treatments in the dryland WW-F cropping system and is necessary to curb the macronutrient decline over time. While manure can substantially improve the soil health, including manure alone to meet the crop’s nutrient demand can be challenging from the economic and environment perspectives. In addition to the application of inorganic N, soil must be replenished periodically with other macronutrients to maintain a healthy soil ecosystem where FYM application can play a vital role. Despite having similar effects on soil macronutrient from both the residue burn and no burn treatments, avoiding residue burning may be a preferable option because of the impact of residue burning on air quality and wind erosion. Nonetheless, residue burning can be a better management practice to manage residue, disease, weeds, and to increase soil temperature under some field conditions compared with no burning. Future studies on physical properties and microbial activities in soils of CR-LTE plots may be needed to offer robust guidance in formulating farming strategies and to quantify other aspects of residue burning such as effects on overall soil health.
Materials and Methods
Site description
The experiment site is at the Columbia Basin Agricultural Center (CBARC), 15 km northeast of Pendleton, OR (45°42′N, 118°36′W, 438 m asl). The CBARC is one of the 14 field experiment stations of Oregon State University. This experiment was initiated in 1931 and is one of very few LTE remaining in the Western US. The site has dry summers and wet winters with average annual precipitation of 437 mm (90% of precipitation occurs between November and June)3, and the 81-yr (1932–2012) average annual maximum and minimum temperatures are 17.4 °C and 3.06 °C, respectively35. According to the Soil Survey Staff, the soil at the experimental site is Walla Walla silt loam (coarse-silty, mixed, superactive, mesic Typic Haploxeroll) derived from loess overlying basalt and is well drained. Its main properties are 18% clay, 70% silt (upper 20 cm), pH: 6.1–7.0, and cation exchange capacity: 18 cmolc kg−1.
Experimental design
The experiment was an ordered block of two identical blocks of nine treatments with two replications, each series representing wheat or fallow phase of the WW–F system. Although this experiment was established in 1931 without randomizing the treatments within each block, extensive investigation of plot by plot soil samples and yield data before the experiment started, and later on, revealed no biases6. The size of individual plots is 11.6 m by 40.2 m. The two series were offset by 1 year with the sole purpose of collecting wheat yield and biomass data each year. The wheat cultivars grown since 1992 were: Malcolm from 1992–1995, Stephens from 1996–2005, and ORCF102 from 2006–2015.
Treatments and field management
The CR-LTE treatments include: fall burning of wheat residue without N addition (FB); spring burning of wheat residue with the addition of N at the rate of 0 kg ha−1 (SB), 45 kg ha−1 (SB45), and 90 kg ha−1 (SB90); no burning of wheat residue with the addition of N at the rate of 0 kg ha−1 (NB), 45 kg ha−1 (NB45) and 90 kg ha−1 (NB90); and no burning of wheat residue with farm yard manure (FYM), or with pea vine (PV) incorporation.
The FYM at a rate of 11.2 Mg ha–1 yr–1 (Dry matter 47.5%, 0.85 Mg C ha–1, and 70 kg N ha–1 yr−1), and pea vine (PV), at a rate of 1.12 Mg ha–1 yr–1 (Dry matter 87.8%, 0.41 Mg C ha–1 yr–1, and 18.5 kg N ha–1 yr–1), were applied just prior to plowing in the spring of the fallow year. Nitrogen was applied as urea-ammonium nitrate solution (UAN 32%, Poole Chemical, Texline, Texas, US) in October, using shank applicator, one week before seeding wheat in SB and NB treatments. The undisturbed wheat stubble was burned after harvests in September for fall burn treatment (FB0) and in late March-early April for spring burn treatment (SB0, SB45, and SB90). The process of burning is rapid with temperatures reaching 300 °C in the canopy for 3 minutes6. The soil is left undisturbed between burning and plowing for 195 or 5 days for fall or spring burn, respectively6.
After burning and organic amendment application, the entire experiment field is moldboard plowed 20 cm deep and smoothed with a field cultivator or a tine harrow. Before 2002, wheat was sown at 90 kg ha−1 and thereafter, the rate of 92 kg ha−1 was used. Between April and October, the field is tilled three to four times with a rod weeder to control weeds and maintain seed-zone moisture.
Soil sampling and laboratory analysis
Soil sampling and laboratory analysis process were similar to that of previous research of similar kind conducted in CBARC36,37,38,39,40,41. Soil cores collected at the 0–10 cm, 10–20 cm, 20–30 cm, and 30–60 cm depths from 1995, 2005, and 2015 were used in this study. We used archived soil samples of 1995 and 2005 while soil samples of 2015 were collected in the summer of 2015. The soil cores (Internal diameter: 3.6 cm) from two locations (north and south central) within each subplot were collected after wheat harvest using a truck-mounted Giddings Hydraulic Probe (Giddings Machine Company, Inc., Windsor, CO). Soil samples from the two locations within a subplot were then composited. Soil pH values (1:2 soil to 0.01 M CaCl2 solution) were measured after a 30 min equilibrium time. The CR-LTE had slightly acidic soil to below 60 cm depth and thus, we assumed the total C determined in this study to be SOC. Earlier studies on this plot have confirmed total C in these plots are SOC6,8. We did not measure the soil bulk density, however, previous study on the same LTE had reported similar bulk density among the treatments for individual soil depths (0–10, 10–20, 20–30, and 30–60 cm)8.
Visible plant material and debris were removed from the soil samples by sieving. Soil samples were oven dried at 60 °C for 72 hours, and roller milled for 4 hours. Wheat grain and straw samples were collected from the center of each plot and were finely ground. A combustion analyzer (Thermo Finnigan FlashEA 1112 Elemental Analyzer, Milan, Italy) for the 1995 and 2005 samples and a Vario Micro Cube combustion analyzer (Elementar Analysensysteme GmbH, Hanau, Germany) for the 2015 samples were used to determine total C, N, and S in soil and plant tissue. Available concentrations of P, K, Ca, and Mg in soil and the total concentration of these nutrients in plants were determined by inductively coupled plasma-optical emissions spectroscopy (ICP-OES Model #2100 DV, Waltham, Massachusetts, US) following a Mehlich III extraction42 of soil samples and dry ashing of plant samples43.
Statistical analysis
The concentrations of total N, S, and C and extractable P, K, Ca, and Mg in soil were analyzed by Repeated Measures Analysis (RMA) of a split-plot design. The year (1995, 2005, 2015) was the whole plot factor, treatment (Nine levels: NB, SB45, SB90, NB45, NB90, FB, SB, FYM, and PV) was the subplot factor; and the response variables were measured repeatedly in space at 4 soil depths (0–10 cm, 10–20 cm, 20–30 cm, and 30–60 cm). In RMA, since the assumption of independence is likely to be violated, the Akaike Information Criterion was used to determine the most appropriate co-variance structure and was incorporated in the model using the Mixed Procedure of SAS44. Letter groupings were generated using a 5% level of significance for the main effects and using a 1% level of significance for interaction effects to protect Type I experimentwise error rate from over inflation.
Tissue total concentrations of P, K, Ca, and Mg in grain and straw were analyzed as a split-plot design with two blocks where year (1995, 2005, and 2015) was a whole-plot factor and the 9 treatments were a sub-plot factor. We used the Mixed Procedure of SAS44 to analyze the data. For significant (p-value <0.05) effects, multiple means comparisons were completed by comparing the least squares means of the corresponding treatment combinations.
The minor differences in pH represent large differences since it is in a logarithmic scale. The pH data were converted to H + concentration (μmol L−1) before analyses to unmask the differences of the treatments. The ANOVA table of pH is based on analysis of H + concentration. For multiple comparisons, original values of pH scale were used.
References
Reganold, J. P. & Wachter, J. M. Organic agriculture in the twenty-first century. Nat. Plants 2, 15221 (2016).
Foley, J. A. et al. Global consequences of land use. Science (80-.). 309, 570–574 (2005).
Gollany, H. T. CQESTR Simulation of dryland agroecosystem soil organic carbon changes under climate change scenarios. in Synthesis and Modeling of Greenhouse Gas Emissions and Carbon Storage in Agricultural and Forest Systems to Guide Mitigation and Adaptation. Advances in Agricultural Systems Modeling. (eds. Del Grosso, S., Ahuja, L. & Parton, W.) 59–87 (ASA-CSSA-SSSA, 2016).
Al-Kaisi, M. M. & Shanahan, J. F. Irrigation of winter wheat. Crops Series, University Cooperative Extension Bulletin, no. 0.556. Colorado State University, Fort Collins, Colorado. (1999).
Williams, J. D., Wuest, S. B. & Long, D. S. Soil and water conservation in the Pacific Northwest through no-tillage and intensified crop rotations. J. Soil Water Conserv. 69, 495–504 (2014).
Rasmussen, P. E. & Parton, W. J. Long-term effects of residue management in wheat-fallow: I. Inputs, yield, and soil organic matter. Soil Sci. Soc. Am. J. 58, 523–530 (1994).
Schillinger, W. F. & Papendick, R. I. Then and now: 125 Years of dryland wheat farming in the Inland Pacific Northwest. Agron. J. 100, 166–182 (2008).
Ghimire, R., Machado, S. & Rhinhart, K. Long-term crop residue and nitrogen management effects on soil profile carbon and nitrogen in wheat–fallow systems. Agron. J. 107, 2230–2240 (2015).
Rasmussen, P. E., Allmaras, R. R., Rhode, C. R. & Roager, N. C. Crop residue influences on soil carbon and nitrogen in a wheat-fallow system. Soil Sci. Soc. Am. J. 44, 596–600 (1980).
Gollany, H. T. et al. Predicting agricultural management influence on long-term soil organic carbon dynamics: Implications for biofuel production. Agron. J. 103, 234–246 (2011).
Camara, K. M., Payne, W. A. & Rasmussen, P. E. Long-term effects of tillage, nitrogen, and rainfall on winter wheat yields in the Pacific Northwest. Agron. J. 95, 828–835 (2003).
Mulvaney, R. L., Khan, S. A. & Ellsworth, T. R. Synthetic nitrogen fertilizers deplete soil nitrogen: A global dilemma for sustainable cereal production. J. Environ. Qual. 38, 2295–2314 (2009).
Ladha, J. K., Reddy, C. K., Padre, A. T. & van Kessel, C. Role of nitrogen fertilization in sustaining organic matter in cultivated soils. J. Environ. Qual. 40, 1756–66 (2011).
Lal, R. Potential of desertification control to sequester carbon and mitigate the greenhouse effect. Clim. Change 51, 35–72 (2001).
Lekasi, J. K., Tanner, J. C., Kimani, S. K. & Harris, P. J. C. Cattle manure quality in Maragua District, Central Kenya: Effect of management practices and development of simple methods of assessment. Agric. Ecosyst. Environ. 94, 289–298 (2003).
Panwar, N. R., Ramesh, P., Singh, A. B. & Ramana, S. Influence of organic, chemical, and integrated management practices on soil organic carbon and soil nutrient status under semi-arid tropical conditions in Central India. Commun. Soil Sci. Plant Anal. 41, 1073–1083 (2010).
Limon-Ortega, A., Govaerts, B. & Sayre, K. D. Crop rotation, wheat straw management, and chicken manure effects on soil quality. Agron. J. 101, 600–606 (2009).
Jiang, D. et al. Long-term effects of manure and inorganic fertilizers on yield and soil fertility for a winter wheat-maize system in Jiangsu, China. Pedosphere 16, 25–32 (2006).
Kaleem Abbasi, M. & Tahir, M. M. Economizing nitrogen fertilizer in wheat through combinations with organic manures in Kashmir, Pakistan. Agron. J. 104, 169–177 (2012).
Rezig, F. A. M., Mubarak, A. R. & Ehadi, E. A. Impact of organic residues and mineral fertilizer application on soil–crop system: II soil attributes. Arch. Agron. Soil Sci. 59, 1245–1261 (2013).
Ai, C., Liang, G., Sun, J., Wang, X. & Zhou, W. Responses of extracellular enzyme activities and microbial community in both the rhizosphere and bulk soil to long-term fertilization practices in a fluvo-aquic soil. Geoderma 173–174, 330–338 (2012).
Rasmussen, P. E., Albrecht, S. L. & Smiley, R. W. Soil C and N changes under tillage and cropping systems in semi-arid Pacific Northwest agriculture. Soil Tillage Res. 47, 197–205 (1998).
Machado, S. Soil organic carbon dynamics in the Pendleton long-term experiments: Implications for biofuel production in Pacific Northwest. Agron. J. 103, 253–260 (2011).
Rasmussen, P. E., Douglas, C. L. Jr., Collins, H. P. & Albrecht, S. L. Long-term cropping system effects on mineralizable nitrogen in soil. Soil Biol. Biochem. 30, 1829–1837 (1998).
Bhattacharyya, R., Kundu, S., Prakash, V. & Gupta, H. S. Sustainability under combined application of mineral and organic fertilizers in a rainfed soybean-wheat system of the Indian Himalayas. Eur. J. Agron. 28, 33–46 (2008).
Singh, A., Agrawal, M. & Marshall, F. M. The role of organic vs. inorganic fertilizers in reducing phytoavailability of heavy metals in a wastewater-irrigated area. Ecol. Eng. 36, 1733–1740 (2010).
Wang, F., Wang, Z., Kou, C., Ma, Z. & Zhao, D. Responses of wheat yield, macro- and micro-nutrients, and heavy metals in soil and wheat following the application of manure compost on the North China Plain. PLoS One 11, 1–18 (2016).
Antoniadis, V., Koutroubas, S. D. & Fotiadis, S. Nitrogen, phosphorus, and potassium availability in manure- and sewage sludge–applied soil. Commun. Soil Sci. Plant Anal. 46, 393–404 (2015).
Ohno, T. & Erich, M. S. Inhibitory effects of crop residue-derived organic ligands on phosphate adsorption kinetics. J. Environ. Qual. 26, 889–895 (1997).
Hovland, D. & Caldwell, A. C. Potassium and magnesium relationships in soils and plants. Soil Sci. 89, 92–96 (1960).
Robinson, F. E., Cudney, D. W. & Lehman, W. F. Nitrate fertilizer timing, irrigation, protein, and yellow berry in durum wheat. Agron. J. 71, 304–308 (1979).
Zhao, F. J., Hawkesford, M. J. & McGrath, S. P. Sulphur assimilation and effects on yield and quality of wheat. J. Cereal Sci. 30, 1–17 (1999).
Naeem, H. A. Sulfur nutrition and wheat quality. in Sulfur: A Missing Link between Soils, Crops, and Nutrition (ed. Jez, J.) 153–169 (American Society of Agronomy, Crop Science Society of America, Soil Science Society of America, 2008).
Barillot, R., Chambon, C. & Andrieu, B. CN-Wheat, a functional-structural model of carbon and nitrogen metabolism in wheat culms after anthesis. I. Model description. Ann. Bot. 118, 997–1013 (2016).
CBARC. Columbia Basin Agricultural Experiment Center-Pendleton Coop Weather Data. Available at, https://agsci.oregonstate.edu/cbarc/climate-and-soils/weather-observations-columbia-basin-agricultural-research-centerpendleton/ (Accessed 10 August 2018). (2015).
Shiwakoti, S., Zheljazkov, V. D., Gollany, H. T., Xing, B. & Kleber, M. Micronutrient concentrations in soil and wheat decline by long-term tillage and winter wheat-pea rotation. Agronomy 9, 359 (2019).
Shiwakoti, S., Zheljazkov, V. D., Gollany, H. T., Kleber, M. & Xing, B. Effect of tillage on macronutrients in soil and wheat of a long-term dryland wheat-pea rotation. Soil Tillage Res. 190, 194–201 (2019).
Shiwakoti, S. Long-term impacts of nitrogen fertilizer, tillage and crop residue on soil and plant nutrients in winter wheat cropping systems under dryland conditions (PhD Dissertation). (Oregon State University, Corvallis, OR, USA, 2018).
Shiwakoti, S., Zheljazkov, V. D., Gollany, H. T., Kleber, M. & Xing, B. Micronutrients decline under long-term tillage and nitrogen fertilization. Sci. Rep. 9, 12020 (2019).
Shiwakoti, S. et al. Micronutrients in the soil and wheat: Impact of 84 years of organic or synthetic fertilization and crop residue management. Agronomy 9, 464 (2019).
Shiwakoti, S., Zheljazkov, V., Gollany, H., Kleber, M. & Xing, B. Macronutrients in Soil and Wheat as Affected by a Long-Term Tillage and Nitrogen Fertilization in Winter Wheat–Fallow Rotation. Agronomy 9, 178 (2019).
Mehlich, A. Mehlich 3 soil test extractant: A modification of Mehlich 2 extractant. Commun. Soil Sci. Plant Anal. 15, 1409–1416 (1984).
Papp, C. & Harms, T. Comparison of digestion methods for total elemental analysis of peat and separation of its organic and inorganic components. Analyst 110, 237–243 (1985).
SAS Institute Inc. SAS/STAT 9.4 User’s Guide, Cary. (2014).
Acknowledgements
This research was supported by the Oregon State University startup funds awarded to Dr. Valtcho D. Jeliazkov (Zheljazkov). We thank Mr. Karl Rhinhart and his crews for their help with the field soil sampling. We also thank Dr. YanPing Qian and Dr. Shannon Capellazzi for their valuable help with the laboratory work. We gratefully acknowledge Paul Rasmussen (retired) and coworkers for collecting and archiving the soil and tissue samples of the long-term experiments, and Chris Roager (retired) and Joseph St. Claire at USDA Agricultural Research Service (Columbia Plateau Conservation Research Center, Adams, OR) for the CNS analyses of the soil and tissue samples.
Author information
Authors and Affiliations
Contributions
S.S. worked substantially on paper drafting and revisions. V.D.Z. came up with the idea, conceptualization and the methodology and was involved with editing of the manuscripts. T.A. performed statistical analysis and reviewed the draft. H.G., M.K., and B.X. were involved in the review and edit of the manuscripts.
Corresponding author
Ethics declarations
Competing interests
The authors declare no competing interests.
Additional information
Publisher’s note Springer Nature remains neutral with regard to jurisdictional claims in published maps and institutional affiliations.
Supplementary information
Rights and permissions
Open Access This article is licensed under a Creative Commons Attribution 4.0 International License, which permits use, sharing, adaptation, distribution and reproduction in any medium or format, as long as you give appropriate credit to the original author(s) and the source, provide a link to the Creative Commons license, and indicate if changes were made. The images or other third party material in this article are included in the article’s Creative Commons license, unless indicated otherwise in a credit line to the material. If material is not included in the article’s Creative Commons license and your intended use is not permitted by statutory regulation or exceeds the permitted use, you will need to obtain permission directly from the copyright holder. To view a copy of this license, visit http://creativecommons.org/licenses/by/4.0/.
About this article

Cite this article
Shiwakoti, S., Zheljazkov, V.D., Gollany, H.T. et al. Macronutrient in soils and wheat from long-term agroexperiments reflects variations in residue and fertilizer inputs. Sci Rep 10, 3263 (2020). https://doi.org/10.1038/s41598-020-60164-6
Received:
Accepted:
Published:
DOI: https://doi.org/10.1038/s41598-020-60164-6
This article is cited by
-
Evaluating common soil health tests for dryland wheat systems of inland Pacific Northwest
Journal of Soils and Sediments (2024)
-
Long-term agro-management strategies shape soil bacterial community structure in dryland wheat systems
Scientific Reports (2023)
-
Sustainability Assessment of Rice-Wheat System Through Organic Fertilizers and Green Manuring in Sub-Tropical Humid Climate
International Journal of Plant Production (2023)
-
Compost improves plant and soil macronutrient content in a 14-years orchard
Nutrient Cycling in Agroecosystems (2023)
-
Discrimination and Recognition of Bentong Ginger Based on Multi-elemental Fingerprints and Chemometrics
Food Analytical Methods (2022)
Comments
By submitting a comment you agree to abide by our Terms and Community Guidelines. If you find something abusive or that does not comply with our terms or guidelines please flag it as inappropriate.
