
Abstract
Natural abundances of stable nitrogen and carbon isotopes (δ15N and δ13C) can vary with both dietary intake and metabolic (specifically catabolic) state. In low-income countries, weaning is a period of dietary transition from milk to plant-based foods and a high-risk period for malnutrition. We explored how diet and malnutrition impact hair δ15N and δ13C in young children by an observational, cross-sectional study in Cox’s Bazar District, Bangladesh [255 children, 6–59 months with 19.6% wasted (7.1% severely) and 36% stunted (9.8% severely)]. Hair δ15N and δ13C exhibited exponential decreases with age, with the loss of one trophic level (3.3‰ and 0.8‰, respectively) from 6 to 48 months, which we associate with the shift from exclusive breastfeeding to complete weaning. After adjustment for age and breastfeeding status, hair isotopic values were unaffected by wasting but lower in severe stunting (−0.45‰ to −0.6‰, P < 0.01). In this population of young children, whose isotopic values in hair primarily depended on age, we failed to observe any effect of wasting, likely due to opposite, compensating effects between dietary and metabolic changes involved. In contrast, we evidenced low δ15N and δ13C values in severely stunted children that likely indicate chronic exposure to diets low in animal products.
Introduction
The natural abundances of stable carbon and nitrogen heavy isotopes (δ13C and δ15N) in body proteins reflect those of the diet, plus a small discrimination factor, known as the trophic step, which is due to the preferential elimination of light isotopes and is smaller for carbon (+1‰) than for nitrogen (+3–4‰)1,2. Since δ13C and δ15N values in the body primarily reflect those of the diet, they have long been used in ecology and archaeology to reconstruct trophic webs and characterize ancient diets3,4,5,6. More recently, they have been used in epidemiology as biomarkers to assess the consumption of fish, animal products, and sugar7,8,9,10,11,12,13. In this regard, measuring isotopic natural abundances in hair has several advantages. Hair is easily and non-invasively sampled and its isotopic values correlate well with those in other body proteins. Moreover, hair keratin is an ideal isotopic archive because it is produced sequentially and is inert after synthesis14,15, provided that a sufficient number of follicles is sampled to limit the potential bias due to the presence of a small proportion of hair in the telogen phase, i.e. not growing15,16,17. Considering an average hair growth rate of 1 cm per month17,18 and a one-week delay between hair synthesis and bulb exit19, the 5 mm of hair closest to the scalp contains isotopic information for the period between −3 and −1 weeks before sampling.
Moreover, it is now recognized that the isotopic discrimination between the body and the diet (i.e., the trophic step) varies between subjects according to their particular metabolic orientation, leading to changes in δ13C and δ15N in body proteins. For example, an anabolic shift, as observed during pregnancy, is associated with a decrease in hair δ15N due to a decrease in the nitrogen trophic step20. Conversely, a catabolic shift with weight loss, as observed during anorexia nervosa or in women experiencing nausea during early pregnancy, has been associated with an increase in δ15N and a decrease in δ13C in hair14,15,21. In rats submitted to prolonged caloric restriction with maintained protein intake, we recently evidenced tissue δ15N and δ13C variations resulting from metabolic adaptations; in particular, we observed that increased amino acid orientation towards the transamination and deamination pathways fueling gluconeogenesis, and the mobilization of muscle 15N-enriched amino acids, resulted in an increase in δ15N22. Thus, beyond simple markers of dietary exposure, hair δ13C and δ15N measurements could also be used to identify a catabolic state characterized by the mobilization of body proteins for new protein synthesis, which is believed to be part of the natural history of acute malnutrition in children.
Early childhood is a period of dietary transition, with the gradual shift from infant-specific, milk-based feeding to family foods. In low-income countries, weaning is known to be a high-risk period for malnutrition, in particular because of the introduction of inadequate complementary foods with low protein content and low energy density. In these countries, poor sanitary conditions are associated with a high risk of infection during early childhood, which further increases the risk of malnutrition23,24,25,26,27. Malnutrition can occur in two forms: (1) wasting (i.e., acute malnutrition) is a rapid loss of fat and muscle mass due to recent food deprivation and/or disease; (2) stunting (i.e., chronic malnutrition) is the consequence of a progressive alteration in linear growth, caused by long-term insufficient nutrient intake and recurrent infections. Stunting has been recently described as a consequence of repeated episodes of wasting28. Although archaeologists frequently use δ13C and δ15N measurements in hair or bone collagen to identify weaning practices in ancient civilizations29,30,31,32, few data are available on the evolution of δ13C and δ15N during this period in contemporary populations33,34. Additionally, to what extent hair δ13C and δ15N values are affected by wasting or stunting during the weaning period remains to be defined.
In this context, the aim of the present study was to assess the association between hair δ13C and δ15N, the diet and the severity of wasting or stunting in a representative population of young (6–59 months) children in Bangladesh.
Results
Population description
The final number of children with hair isotopic measurements was 255, with a mean age of 33.7 months, a sex ratio close to 50% and approximately one third of the population partially or exclusively breastfed (Table 1). Moreover, ~20% of the population was wasted (~7% severely) and ~36% was stunted (~10% severely). The characteristics of our study population were similar to those of the representative sample of children surveyed during the overarching nutritional survey (n = 654), from which our population was randomly sub-sampled (Supplementary Table S1), except for a higher proportion of children with severe acute malnutrition (7.1% vs. 4.3%).
In accordance with the respective anthropometric criteria by which they were diagnosed, wasted children had a lower mid-upper arm circumference (MUAC) and/or weight-for-height Z-score (WHZ) than non-wasted children, while stunted children had a lower height-for-age Z-score (HAZ) than non-stunted children (Table 2). In addition, compared to non-wasted children, wasted children were also younger, more often boys and fully or partially breastfed, and had a lower dietary diversity score (DDS), a lower HAZ and a lower weight-for-age Z-score (WAZ). In contrast, compared to non-stunted children, stunted children were similar in terms of age, sex ratio and DDS but had a lower WAZ and MUAC (for severely stunted children only).
In bivariate logistic regression, age was weakly and negatively associated with the risk of wasting while still being breastfed was a strong determinant for wasting. Neither age nor weaning status were associated with the risk of stunting (Supplementary Table S2).
Hair δ15N and δ13C: links with anthropometric parameters
The measured C/N ratios in hair (3.14 ± 0.17, mean ± SD) were close to the theoretical value of keratin35 (confirming that sample preparation, i.e., cleaning and delipidation, was carried out with care) and were not statistically different across conditions (breastfeeding, wasting or stunting).
For the 255 children included, hair δ15N and δ13C values were 8.74 ± 1.25‰ and −22.18 ± 0.75‰ (mean ± SD), respectively, and did not vary between boys and girls (Supplementary Table S3). For the 7 exclusively breastfed children (breastfed and DDS = 0), the δ15N and δ13C values (11.45 ± 0.69‰ and −22.01 ± 0.44‰, respectively) were significantly higher compared to those of the 170 weaned children (8.19 ± 0.78‰ and −22.32 ± 0.76‰, Supplementary Table S3). Both δ15N and δ13C were negatively correlated with age, height and weight (Table 3). Hair δ15N was also negatively correlated with head circumference and MUAC. Moreover, both δ15N and δ13C were positively correlated with HAZ.
Hair δ15N and δ13C: trajectories during weaning
Plotting δ15N or δ13C against age showed an exponential decay between 6 and 60 months (Fig. 1). These decreases were fit using the following 3-parameter equation:
where X stands for either 15N or 13C, δX∞ (‰) represents the plateau δ15N or δ13C value at the final isotopic steady state (i.e. the expected value in adults), Δ (‰) is the difference between the δ15N or δ13C value measured at 6 months of age and the corresponding expected value in adults (i.e., the weaning trophic level decrease), and k (%/month) represents the rate of decrease in δ15N or δ13C (i.e., the isotopic turnover rate).
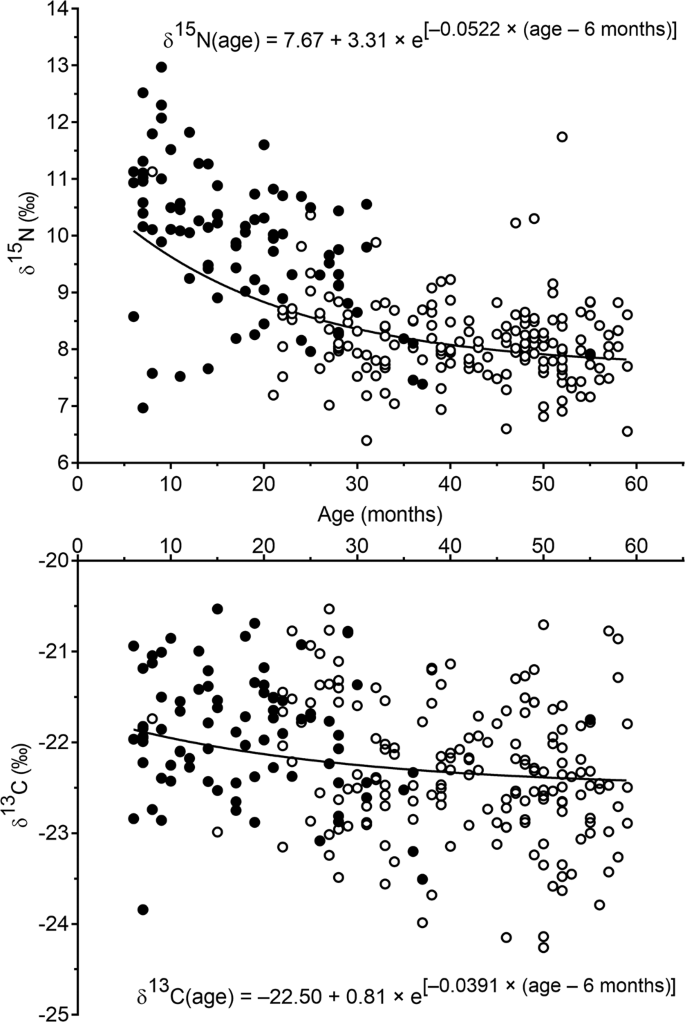
δ15N and δ13C in hair as a function of age in children aged 6 to 60 months (n = 255). Empty circles represent children who were fully weaned and filled circles represent children who were partially or exclusively breastfed.
Because the dispersion of δ13C values at a given age was large compared to the variation of δ13C with age, a two-step procedure was used to estimate the 3 parameters for 13C. The δ13C∞ value was first estimated as the mean δ13C value for fully weaned children ≥48 months of age (our closest proxy for the value in adults) and this value was then forced into the model to estimate the other two parameters.
The weaning trophic level decrease (Δ) was much higher for δ15N than for δ13C (3.31‰ vs. 0.81‰) but the isotopic turnover rate (k) rate was similar for the two isotopes (Table 4). The time needed to reach 90% of the final isotopic equilibrium \((t0.9=-\,{\rm{l}}{\rm{n}}(1-0.9)/\text{k})\) was 52 months, from the initial age of 6 months, on average, for both isotopes.
After adjustment for age, δ15N was lower in fully weaned children compared to children fully or partially breastfed (8.42 ± 0.08 vs. 9.39 ± 0.13, P < 0.0001) while no difference was observed for δ13C, indicating that at least for δ15N, the effects of age and breastfeeding status were not statistically confounded.
Hair δ15N and δ13C: effects of wasting and stunting
Before adjustment for age and breastfeeding status, hair δ15N was higher in wasted children and lower in stunted children compared to non-wasted and non-stunted children, respectively. Hair δ13C was also lower in severely stunted children compared to non-stunted children (Supplementary Table S3). After adjustment for age and breastfeeding status, there was no difference in hair δ15N and δ13C between wasted children and their controls. However, both δ15N (−0.57‰, P < 0.01) and δ13C (−0.44‰, P < 0.01) were significantly lower in stunted children (Fig. 2).

Effect of wasting and stunting on age- and breastfeeding-adjusted δ15N and δ13C in hair of children (6–60 months). Data are least-square means ± SE. *Different from control (non-wasted or non-stunted) children, P < 0.01.
In bivariate logistic regression, δ15N but not δ13C was weakly and positively associated with the risk of being wasted. This association was no longer observed in multi-adjusted models. In contrast, δ15N, and to a lesser extent δ13C, were negatively associated with the risk of being stunted. In multi-adjusted models, δ15N was still negatively associated with the risk of being severely stunted whereas the association was marginally significant for δ13C (Supplementary Table S4).
Discussion
In the present study, we showed, with high statistical power due to the large sample of children, that hair δ15N and δ13C values decreased between 6 months and 4 years of age, with little variation thereafter—a consequence of the weaning process and the gradual switch from breast milk to plant-based family meals of lower δ15N and δ13C values11,36. In this population of young children, we failed to observe any association between hair δ15N and δ13C and wasting, but highlighted that both were associated with stunting, a new result that has not been reported so far. Indeed, compared to non-stunted children, severely stunted children exhibited lower hair δ15N (−0.6‰) and δ13C (−0.4‰) values that likely reflect chronic exposition to diets low in animal source food (ASF).
One of the most important results of this study is our report of an exponential decrease in hair δ15N and δ13C between 6 months and 5 years of age, which was more pronounced for 15N than for 13C. Although many archaeological studies rely on the hypothesis of a decrease in protein δ15N and δ13C during weaning to reconstruct the practices of ancient civilizations6,29,30,31,37,38, there are very few data on the evolution of hair δ15N and δ13C with age in contemporary children. Fogel et al., using periodic fingernail clippings sampled from mother-infant pairs, were among the first to report a δ15N increase between birth and 6 months of age due to breastfeeding, followed by a gradual δ15N decrease after weaning initiation33. More recently, and again using fingernail clippings from mother-infant pairs collected during breastfeeding versus formula-feeding, Fuller et al. reported that breastfeeding resulted in gradual increases in both δ15N and δ13C until weaning onset, when infants’ enrichments (relative to their mothers’) reached 2–3‰ for 15N and a 1‰ for 13C, followed by gradual decreases during weaning, which were more pronounced for 15N than for 13C34. However, these two studies remain largely qualitative, as the limited number of participants did not allow for statistical analysis, and the follow-up periods were restricted to the early phase of weaning (up to 1.5 years of age) and not to complete weaning. Even though we did not measure hair δ15N and δ13C values in mothers, nor in children under 6 months of age, our data shed light on the impact of breastfeeding and weaning on δ15N and δ13C variations during infancy and early childhood (up to 5 years of age). Firstly, aside from age, we observed that hair δ15N and δ13C were higher in fully breastfed children than in weaned children no longer receiving breast milk. Secondly, analysis of hair δ15N and δ13C kinetics between 6 months and 5 years of age supports the hypothesis of an underlying trophic level effect. Considering that the isotopic values at the plateau correspond with those of adults, and assuming that data from children at 6 months of age are a proxy for the maximum values reached at the end of breastfeeding period, the Δ parameters in our equations correspond to the maximum isotopic enrichment in infants relative to their mothers (i.e., the breastfeeding trophic level shift equivalent to the weaning trophic level decrease). The second assumption is supported by the lack of difference between our model predictions (by curve-fitting) for δ15N and δ13C at 6 months and our observations in the 7 exclusively breastfed children in our study population. Our estimates for Δ (i.e., 3.3‰ [2.8–3.8] for 15N and 0.8‰ [0.6–1.0] for 13C) correspond with the magnitude of a trophic level shift reported in the literature (i.e., 3–4‰ for 15N and 1‰ for 13C)36. Therefore, our data support the hypothesis that after birth, exclusive breastfeeding induces gradual increases in δ15N and δ13C in infants compared to their mothers, up to a difference on the order of one trophic level around the age of 6 months. These increases are then reversed during weaning, as the proportion of breastmilk in the infant diet is gradually reduced. A state close to isotopic equilibrium with the family diet is reached around 4 years of age, with little change in δ15N and δ13C afterwards. 13C and 15N bioaccumulation, which leads to Δ13C and Δ15N trophic steps, is in large part due to discrimination against these heavy isotopes during the formation of respiratory CO2 and N waste. Δ15N has been shown to vary slightly based on the quality of dietary protein and efficiency of its anabolic use39,40. This effect of dietary protein quality is sometimes confused with the effect of the δ15N value of the diet, as plant proteins, compared to animal proteins, are of poorer nutritional quality and lower δ15N values. The nutritional quality of breast milk protein is characteristic of the species and is independent of maternal diet quality41. Because of this, the Δ15N trophic step between children’s hair and their mother’s breast milk is independent of the quality of the family diet and its δ15N value. Therefore, the magnitude of decrease in δ15N and δ13C we observed in children during weaning is applicable to all current and past dietary conditions, regardless of their nature and quality, provided that children are weaned on the same diet as their mothers.
While the dietary transition associated with weaning is undoubtedly the underlying cause of the δ15N and δ13C decrease with age, the effects of age and breastfeeding status were not fully confounded in our study, at least for δ15N, for two reasons. First, we assume that in our study, breastmilk consumption varied in partially breastfed children—and children were likely to receive less and less breast milk with age. Second, after a diet transition, hair progressively integrates the isotopic signature of the new diet because endogenous amino acids released during the renewal of body proteins (mainly muscle) represent a significant supply to the keratin precursor pool42; at the time of dietary transition, these endogenous amino acids still carry the isotopic signature of the former diet. The isotopic differences between endogenous and exogenous amino acids mitigate the signature of the new diet detectable in hair, at least until a new isotopic steady state is reached in muscle tissue42. It should be also noted that, in our study, the ratio between the SD of the isotopic abundance for the whole population and the predicted weaning trophic level was higher for 13C (0.93) compared to 15N (0.38). This indicates that our exponential models left more variability unexplained for δ13C than for δ15N. The significant variability in δ13C (in children of all ages) likely reflects variability in the proportion of 13C-rich C4 plants in the family diets in our sample. Rice (a C3 plant) is the staple food consumed by resource-poor Bangladeshis. Yet, some families may have received food aid in the form of corn (a C4 plant). However, we do not know the proportion of corn consumption in the diet of each family. In fully or partially breastfed children, the proportion of C4 plants in the family diet has an indirect effect by modifying the level of 13C enrichment of breast milk. Last, it is also worth noting that in our study, δ15N and δ13C estimates at the plateau were lower than those previously reported by Fuller et al. in adults34, but close to those previously reported for modern vegetarians and vegans5,12—suggesting a low consumption of ASF in this low-income Bangladeshi population43. Regarding hair δ15N, the adult values estimated by our δ15N trajectory fit are very close to those reported for a rural Kenyan population whose livelihood also relies on agriculture44. However, hair δ13C values notably differ between these two populations, due to differential consumption of foods derived from C4 plants. Corn and millet (C4 plants) are the major cereals in the Kenyan diet44 whereas the major staple food in Bangladesh is rice (C3)45.
Assuming that isotopic variations in δ15N and δ13C values between 6 months and 5 years reflect a progressive dietary shift during the weaning process, the correlations between these isotopic values and age-related parameters (e.g., height, weight, head circumference, and MUAC) are likely indirect consequences of this diet shift as well. This explanation is consistent with the fact that hair δ15N and δ13C values were not correlated with anthropometric parameters that are weakly or not related to age (e.g., BMI, WHZ or WAZ) with the notable exception of HAZ. HAZ was found to be weakly and positively correlated with both δ15N and δ13C. Indeed, δ15N and δ13C values were significantly lower in severely stunted children (HAZ < −3) compared to control children (HAZ ≥ −2), even after adjusting for age and breastfeeding status. Despite strong statistical significance (P < 0.01), these effects remain small compared to the trophic level decrease during weaning, especially for δ15N. Consequently, the risk of archaeologically mischaracterizing a severely stunted child for a child in process of weaning is limited, but non-negligible. Conversely, in a contemporary population where children’s ages and breastfeeding statuses are known, δ15N and δ13C measurements in hair could help identify those with severe chronic malnutrition. Such low isotopic values observed in severely stunted children could be due to the consumption of a diet of low isotopic value by either: (1) children after weaning; and/or (2) their mothers during pregnancy and lactation. A dietary explanation is likely, since diets consisting mainly of plant protein (i.e., poor in ASF) have low δ15N and δ13C values46, and very low dietary diversity with almost no ASF consumption has been identified as a risk factor for stunting47. In the present study, we found no difference in dietary diversity scores (DDS) between severely stunted and non-stunted children. However, DDS assessment was based on caretaker declaration and did not take into account the quantities consumed for each of the groups declared. Therefore, it is not possible to rule out a lower ASF consumption in severely stunted children compared to non-stunted children. In this regard, hair δ15N and δ13C measurements could be used as alternatives to assess sub-optimal breastfeeding practices, DDS and ASF consumption which occurred in the past, with a lower risk of bias. Alternatively, the early origin of severe stunting could also constitute a possible explanation for the low values of δ15N and δ13C. Intrauterine growth retardation (IUGR) linked to the poor nutritional status of mothers is recognized as a risk factor for severe stunting25,48. Low dietary diversity in pregnant women could lead to IUGR and low δ15N and δ13C values in newborns, although experimental evidence of this is not available to date. These low values at birth may, in part, explain the low values observed after 6 months of age in our population. These two potential causes are not mutually exclusive and could both contribute to the low hair δ15N and δ13C values measured in severely stunted children.
Quite surprisingly, in this study, we failed to observe a specific isotopic signature for wasted children. Yet, it has been previously reported that muscle wasting in anorexia was associated with an increase in hair δ15N14,15 because of a higher trophic step due to a metabolism more oriented towards catabolism. A first possible explanation is that, in our population, because acute malnutrition mostly occurred between 6 and 24 months of age, at a period of rapid decline in δ15N in hair due to the introduction of plant foods during weaning, any δ15N increase due to muscle wasting was blurred by an antagonistic δ15N decrease due to weaning. Wasted children, just like stunted children, are likely to be weaned on a diet of poor nutritional quality, almost devoid of ASF, and become wasted as a consequence of recent diseases or deprivation. The hypothesis of an antagonistic effect of diet quality and muscle wasting on natural isotopic abundances in hair is supported by the observation that, compared to children with severe stunting, children with severe wasting have similar low δ13C values that are characteristic of ASF-poor diets, but higher δ15N values. In addition, it has been shown that in children with non-edematous acute malnutrition, food deprivation is not associated with an increase in body protein breakdown beyond that measured in well-nourished children49. The mechanisms responsible for wasting are thus quite different from those involved in weight loss in adolescents or adults with anorexia, whose lean body mass is initially much higher than that of children. These two hypotheses could explain why, unlike in anorexia in adolescents and adults, acute malnutrition in children is not associated with an increase in hair δ15N.
The main strength of this study is the sample size and age distribution that, for the first time, models the evolution of δ15N and δ13C across the entire weaning period in humans. In addition, the high prevalence of chronic malnutrition in our population provides sufficient power to highlight its isotopic signature in hair. This study has also some limitations. Information on children’s food consumption is limited, qualitative and caretaker-reported. Additionally, we did not measure the natural 15N and 13C abundances in locally consumed staple foods. This limits our ability to ascertain the links between hair δ15N and δ13C values and dietary diversity and ASF consumption. Lastly, since each 5 mm segment corresponds to a 2-week period, it would have been interesting to have isotopic measurements over a greater number of consecutive segments along the hair follicle—to trace each child’s nutritional history and to highlight, at the individual level, the isotopic trajectory related to dietary transition during weaning, and its possible deviation by an episode of acute malnutrition.
Methods
Ethical considerations
Ethical approval was obtained from the Ethics Committee at the University Hospital of Antwerp and the University of Antwerp (B300201627243) and the National Research Ethics Committee (NREC) at the Bangladesh Medical Research Council (BMRC) (BMRC/NREC/2016–2019/1463). All parents and/or legal guardians of participants were asked to sign an informed consent form and those who were illiterate indicated consent by inked thumbprint in the signature space. All research described in this manuscript was performed in accordance with relevant guidelines and regulation.
Population
This observational, cross-sectional study was conducted on a sub-sample of children randomly drawn from a larger nutritional survey following the Standardized Monitoring and Assessment of Relief and Transitions (SMART) methodology and conducted in Ukhiya and Teknaf Upazillas, in the Cox’s Bazar District, Bangladesh. Sample size was calculated based on the SMART two-stage sampling methodology, using ENA software, in order to produce a precise estimate of the prevalence of Global Acute Malnutrition (GAM, defined as WHZ < −2 SD and/or bilateral pitting edema)50. A total of 1,095 households and 728 children were reached in the SMART survey; in this study, only 665 caretakers agreed that their children participate in the stable isotope analysis (SIA) sub-study, of which only 655 children had hair at the time of the investigation. A random sample of 255 children was selected from these 665 participants for isotopic analysis. However, because the number of severely wasted children in the SMART study was very low (28 or 4.3%, Supplementary Table 1), we decided to oversample this category of children to reach a sufficient group size to allow for statistical comparisons. Therefore, all severely wasted children recruited in the SMART survey with enough hair to perform isotopic analyses (n = 18) were included in the final sample. The prevalence of stunting and wasting in the final sample were close to those measured in the SMART survey, conducted on a representative sample of children in Cox’s Bazar, and close to the prevalence of the joint malnutrition estimates for south Asia issued by UNICEF/WHO/World Bank in 201951.
Data handling
All data were collected using structured questionnaires written in Bengali, and information was recorded on childhood morbidity and diet from immediate caregivers, which were usually mothers. The dietary diversity score (DDS) was calculated based on 7 food groups (grains, roots and tubers, legumes and nuts, dairy products, flesh foods, eggs, vitamin A-rich fruits and vegetables, other fruits and vegetables) by summing the number of unique food groups eaten by the child during the last 24 hours. Breastfeeding status was assessed based on current breastfeeding and DDS over the past 24 hours, as follows: (1) exclusive breastfeeding: currently breastfed and DDS = 0; (2) partial breastfeeding: currently breastfed and DDS > 0; (3) fully weaned: not currently breastfed. Anthropometric measurements were conducted by trained investigators based on WHO standardized procedures52. Naked or minimally clothed children were weighed to the nearest 0.1 kg using portable Salter spring scales while recumbent length or standing height was measured to the nearest 0.1 cm using standard UNICEF height boards. MUAC was measured on the left arm to the nearest 1 mm using a standard MUAC tape. Data were recorded on a mix of hard-copy, paper print-outs (then entered into EPI Info and Microsoft Excel) and tablets using Open Data Kit (ODK). Anthropometric indices (i.e., BMI, HAZ, WAZ, and WHZ) were calculated using WHO Growth Standards53. Stunting (chronic malnutrition) was defined as HAZ < −2 SD and severe stunting as HAZ < −3 SD. Wasting (acute malnutrition) was defined as WHZ < −2 SD or MUAC < 125 mm and severe wasting as WHZ < −3 SD or MUAC < 115 mm.
Hair collection and measurement of isotopic natural enrichments
In these children, a sample of 50 hair follicles was covered in hair gel, twisted into a lock and cut as close to the patient’s scalp as possible with sharp, dissecting scissors. The gelled lock was then taped to a sheet of paper and the cut end was labeled and stored at room temperature before further analysis.
Two consecutive segment of 5 mm on the cut end of the lock were removed and transferred into Eppendorf tubes. Hair gel was removed by two consecutive immersions in 750 µL of ultrapure water for 2 minutes with gentle agitation. Hair samples were then delipidated in 1.5 mL of ether/ethanol (1:1) for 30 minutes, washed in 1.5 mL of ultrapure water for 2 minutes, delipidated once more for 30 minutes, and finally washed thrice consecutively for 2 minutes each, all while being gently agitated. Samples were dried overnight before being transferred into 2 mg tin capsules and analyzed by elemental analysis/isotope-ratio mass spectrometry, using an elemental analyzer (EA Vario Micro Cube, Elementar, Germany) coupled with an isotope-ratio mass spectrometer (Isoprime, VG instruments, Manchester, UK). Tyrosine (δ15N = 10‰ and δ13C = −23.20‰) was used for calibration and drift correction. The natural abundances of 15N and 13C in hair were expressed relative to standards (atmospheric N2 for 15N/14N and Vienna Pee Dee Belemnite for 13C/12C) using the delta notation, according to the following equation: δ (‰) = 1000 × (Rsample − Rstandard)/Rstandard, where Rsample and Rstandard stand for the ratio between heavy and light isotope (15N/14N and 13C/12C) in the sample and standard, respectively. The measurement precision was very good, as assessed by repeated measurements of standards with SD of 0.07‰ for both δ15N and δ13C.
Data analysis
All statistical analyses were performed using statistical analysis software (SAS 9.4, Cary, NC, USA). Unless otherwise specified, all data are presented as means ± SD or as n (frequencies). The only exceptions are data adjusted for age and/or breastfeeding status. In this case, we present least-square means estimated from linear models where age and/or breastfeeding status were included as covariates, and their associated standard error (that estimate the accuracy of the estimation of these least-square means). Frequency comparisons between non-stunted/wasted children (controls) and (severely) stunted/wasted children were conducted using χ2 tests. Pearson bivariate correlations were used to assess the associations between isotopic measurements and the anthropometric characteristics of subjects. Bivariate and multivariate logistic regression was used to assess the link between age, weaning status, δ15N and δ13C and the odds of being (severely) stunted or wasted. The Gauss-Newton method was used for non-linear adjustment of δ15N and δ13C with age. The effect of (severe) stunting or wasting on continuous variables was assessed using analysis of variance with post-hoc Tukey-Kramer tests. Regarding the effect of (severe) stunting or wasting on δ15N and δ13C, age and breastfeeding status were included as covariates in the model as they are major determinants of hair δ15N and δ13C. The validity of covariance analyses was verified by inspecting the normality of model residuals using the Shapiro-Wilk tests. Significance tests were two-sided and performed at the α = 0.05 or α = 0.01 levels.
Statistical analyses for δ15N and δ13C were performed using isotopic data obtained from the 5 mm hair segment closest to the scalp and the mean of the two adjacent 5 mm segments closest to the scalp. These two analyses lead to very similar numerical results and identical conclusions. Therefore, only results from the analysis of isotopic data on the 5 mm segment closest to the scalp are presented in this article. A mixed model for repeated data was also used to analyze the evolution of δ15N and δ13C along the hair follicle and look for a possible influence of stunting or wasting on this evolution. This analysis and its main results are described in the Supplementary analyses section of Supplementary Material.
Data availability
Individual data on age, sex, height, weight, mid-upper arm circumference, breastfeeding status as well as δ15N, δ13C, and the C/N ratio of each hair segment (proximal & distal) are available in the Supplementary Table S7. The use of these data must only be made with reference to the present publication. Other data are available from the corresponding author on reasonable request.
References
De Niro, M. J. & Epstein, S. Influence of diet on distribution of carbon isotopes in animals. Geochim. Cosmochim. Acta 42, 495–506 (1978).
Minagawa, M. & Wada, E. Stepwise enrichment of 15N along food chains: Further evidence and the relation between δ15N and animal age. Geochim. Cosmochim. Acta 48, 1135–1140 (1984).
Layman, C. A. et al. Applying stable isotopes to examine food-web structure: an overview of analytical tools. Biol. Rev. Camb. Philos. Soc. 87, 545–562, https://doi.org/10.1111/j.1469-185X.2011.00208.x (2012).
Wada, E., Mizutani, H. & Minagawa, M. The use of stable isotopes for food web analysis. Crit. Rev. food Sci. Nutr. 30, 361–371, https://doi.org/10.1080/10408399109527547 (1991).
Macko, S. A. et al. Documenting the diet in ancient human populations through stable isotope analysis of hair. Philosophical transactions of the Royal Society of London. Series B, Biological sciences 354, 65–75; discussion 75-66, https://doi.org/10.1098/rstb.1999.0360 (1999).
Makarewicz, C. A. & Sealy, J. Dietary reconstruction, mobility, and the analysis of ancient skeletal tissues: Expanding the prospects of stable isotope research in archaeology. J. Archaeol. Sci. 56, 146–158, https://doi.org/10.1016/j.jas.2015.02.035 (2015).
Fakhouri, T. H. et al. Serum carbon isotope values change in adults in response to changes in sugar-sweetened beverage intake. J. Nutr. 144, 902–905, https://doi.org/10.3945/jn.113.186213 (2014).
MacDougall, C. R. et al. The delta13C Value of Fingerstick Blood Is a Valid, Reliable, and Sensitive Biomarker of Sugar-Sweetened Beverage Intake in Children and Adolescents. J. Nutr. 148, 147–152, https://doi.org/10.1093/jn/nxx017 (2018).
O’Brien, D. M. et al. A Stable Isotope Biomarker of Marine Food Intake Captures Associations between n-3 Fatty Acid Intake and Chronic Disease Risk in a Yup’ik Study Population, and Detects New Associations with Blood Pressure and Adiponectin. J. Nutr. 144, 706–713, https://doi.org/10.3945/jn.113.189381 (2014).
Patel, P. S. et al. Serum carbon and nitrogen stable isotopes as potential biomarkers of dietary intake and their relation with incident type 2 diabetes: the EPIC-Norfolk study. Am. J. Clin. Nutr. 100, 708–718, https://doi.org/10.3945/ajcn.113.068577 (2014).
Petzke, K. J., Boeing, H., Klaus, S. & Metges, C. C. Carbon and nitrogen stable isotopic composition of hair protein and amino acids can be used as biomarkers for animal-derived dietary protein intake in humans. J. Nutr. 135, 1515–1520, https://doi.org/10.1093/jn/135.6.1515 (2005).
Petzke, K. J., Boeing, H. & Metges, C. C. Choice of dietary protein of vegetarians and omnivores is reflected in their hair protein 13C and 15N abundance. Rapid Commun. mass. spectrometry: RCM 19, 1392–1400, https://doi.org/10.1002/rcm.1925 (2005).
Yun, H. Y. et al. Serum Nitrogen and Carbon Stable Isotope Ratios Meet Biomarker Criteria for Fish and Animal Protein Intake in a Controlled Feeding Study of a Women’s Health Initiative Cohort. J. Nutr. 148, 1931–1937, https://doi.org/10.1093/jn/nxy168 (2018).
Hatch, K. A. et al. An objective means of diagnosing anorexia nervosa and bulimia nervosa using N-15/N-14 and C-13/C-12 ratios in hair. Rapid Commun. mass. spectrometry: RCM 20, 3367–3373, https://doi.org/10.1002/rcm.2740 (2006).
Mekota, A. M., Grupe, G., Ufer, S. & Cuntz, U. Serial analysis of stable nitrogen and carbon isotopes in hair: monitoring starvation and recovery phases of patients suffering from anorexia nervosa. Rapid Commun. Mass. Sp. 20, 1604–1610, https://doi.org/10.1002/rcm.2477 (2006).
Eerkens, J. W. et al. Stable C and N isotope analysis of hair suggest undernourishment as a factor in the death of a mummified girl from late 19th century San Francisco, CA. PLoS one 12, e0184921, https://doi.org/10.1371/journal.pone.0184921 (2017).
Saitoh, M., Uzuka, M. & Sakamoto, M. Human hair cycle. J. Investig. dermatology 54, 65–81, https://doi.org/10.1111/1523-1747.ep12551679 (1970).
Pecoraro, V., Astore, I., Barman, J. & Araujo, C. I. The normal trichogram in the child before the age of puberty. J. Investig. dermatology 42, 427–430 (1964).
Valkovic, V. Trace elements in human hair. (Garland STPM Press, New York, 1977).
Fuller, B. T. et al. Nitrogen balance and delta15N: why you’re not what you eat during pregnancy. Rapid Commun. mass. spectrometry: RCM 18, 2889–2896, https://doi.org/10.1002/rcm.1708 (2004).
Fuller, B. T. et al. Nitrogen balance and delta15N: why you’re not what you eat during nutritional stress. Rapid Commun. mass. spectrometry: RCM 19, 2497–2506, https://doi.org/10.1002/rcm.2090 (2005).
Huneau, J. F. et al. Natural Isotope Abundances of Carbon and Nitrogen in Tissue Proteins and Amino Acids as Biomarkers of the Decreased Carbohydrate Oxidation and Increased Amino Acid Oxidation Induced by Caloric Restriction under a Maintained Protein Intake in Obese Rats. Nutrients 11, https://doi.org/10.3390/nu11051087 (2019).
Golden, M. H. The development of concepts of malnutrition. J. Nutr. 132, 2117S–2122S, https://doi.org/10.1093/jn/132.7.2117S (2002).
Prentice, A. M. et al. New challenges in studying nutrition-disease interactions in the developing world. J. Clin. investigation 118, 1322–1329, https://doi.org/10.1172/JCI34034 (2008).
Danaei, G. et al. Risk Factors for Childhood Stunting in 137 Developing Countries: A Comparative Risk Assessment Analysis at Global, Regional, and Country Levels. PLoS Med. 13, e1002164, https://doi.org/10.1371/journal.pmed.1002164 (2016).
Bhutta, Z. A. et al. Severe childhood malnutrition. Nature reviews. Dis. Prim. 3, 17067, https://doi.org/10.1038/nrdp.2017.67 (2017).
Millward, D. J. Nutrition, infection and stunting: the roles of deficiencies of individual nutrients and foods, and of inflammation, as determinants of reduced linear growth of children. Nutr. Res. Rev. 30, 50–72, https://doi.org/10.1017/S0954422416000238 (2017).
Schoenbuchner, S. M. et al. The relationship between wasting and stunting: a retrospective cohort analysis of longitudinal data in Gambian children from 1976 to 2016. Am J Clin Nutr, https://doi.org/10.1093/ajcn/nqy326 (2019).
Jay, M., Fuller, B. T., Richards, M. P., Knusel, C. J. & King, S. S. Iron Age breastfeeding practices in Britain: isotopic evidence from Wetwang Slack, East Yorkshire. Am. J. Phys. Anthropol. 136, 327–337, https://doi.org/10.1002/ajpa.20815 (2008).
Prowse, T. L. et al. Isotopic and dental evidence for infant and young child feeding practices in an imperial Roman skeletal sample. Am. J. Phys. Anthropol. 137, 294–308, https://doi.org/10.1002/ajpa.20870 (2008).
Tsutaya, T. et al. Infant Feeding Practice in Medieval Japan: Stable Carbon and Nitrogen Isotope Analysis of Human Skeletons From Yuigahama-Minami. Am. J. Phys. Anthropol. 156, 241–251, https://doi.org/10.1002/ajpa.22643 (2015).
Tsutaya, T. & Yoneda, M. Reconstruction of Breastfeeding and Weaning Practices Using Stable Isotope and Trace Element Analyses: a Reveiw. Yearb. Phys. Anthropol. 156, 2–21 (2015).
Fogel, M. L., Tuross, N. & Owsley, D. W. Nitrogen isotope tracers of human lactation in modern and archeological populations 111–117 (Carnegie Institution of Washington, Washington DC, 1989).
Fuller, B. T., Fuller, J. L., Harris, D. A. & Hedges, R. E. Detection of breastfeeding and weaning in modern human infants with carbon and nitrogen stable isotope ratios. Am. J. Phys. Anthropol. 129, 279–293, https://doi.org/10.1002/ajpa.20249 (2006).
O’Connell, T. C. & Hedges, R. E. Investigations into the effect of diet on modern human hair isotopic values. Am J Phys Anthropol 108, 409–425, doi:10.1002/(SICI)1096-8644(199904)108:4<409::AID-AJPA3>3.0.CO;2-E (1999).
O’Brien, D. M. Stable isotope ratios as biomarkers of diet for health research. Annu. Rev. Nutr. 35, 565–594 (2015).
Katzenberg, M. A., Saunders, S. R. & Fitzgerald, W. R. Age differences in stable carbon and nitrogen isotope ratios in a population of prehistoric maize horticulturists. Am. J. Phys. Anthropol. 90, 267–281, https://doi.org/10.1002/ajpa.1330900302 (1993).
Tsutaya, T. & Yoneda, M. Reconstruction of Breastfeeding and Weaning Practices Using Stable Isotope and Trace Element Analyses: A Review. Am. J. Phys. Anthropol. 156, 2–21, https://doi.org/10.1002/ajpa.22657 (2015).
Cantalapiedra-Hijar, G. et al. Diet-animal fractionation of nitrogen stable isotopes reflects the efficiency of nitrogen assimilation in ruminants. Br. J. Nutr. 113, 1158–1169, https://doi.org/10.1017/S0007114514004449 (2015).
Poupin, N. et al. The nature of the dietary protein impacts the tissue-to-diet 15N discrimination factors in laboratory rats. PLoS one 6, e28046, https://doi.org/10.1371/journal.pone.0028046 (2011).
Bravi, F. et al. Impact of maternal nutrition on breast-milk composition: a systematic review. Am. J. Clin. Nutr. 104, 646–662, https://doi.org/10.3945/ajcn.115.120881 (2016).
Poupin, N., Mariotti, F., Huneau, J. F., Hermier, D. & Fouillet, H. Natural isotopic signatures of variations in body nitrogen fluxes: a compartmental model analysis. PLoS computational Biol. 10, e1003865, https://doi.org/10.1371/journal.pcbi.1003865 (2014).
Thorne-Lyman, A. L. et al. Household dietary diversity and food expenditures are closely linked in rural Bangladesh, increasing the risk of malnutrition due to the financial crisis. J. Nutr. 140, 182S–188S, https://doi.org/10.3945/jn.109.110809 (2010).
Correia, M. A., Foley, R., O’Connell, T. C., Ramirez-Rozzi, F. & Mirazon Lahr, M. Carbon and nitrogen isotopic signatures of hair, nail, and breath from tropical African human populations. Rapid Commun. mass. spectrometry: RCM 33, 1761–1773, https://doi.org/10.1002/rcm.8524 (2019).
Arsenault, J. E. et al. Very low adequacy of micronutrient intakes by young children and women in rural Bangladesh is primarily explained by low food intake and limited diversity. J. Nutr. 143, 197–203, https://doi.org/10.3945/jn.112.169524 (2013).
Schoeller, D. A., Minagawa, M., Slater, R. & Kaplan, I. R. Stable Isotopes of Carbon, Nitrogen and Hydrogen in the Contemporary North-American Human Food Web. Ecol. Food Nutr. 18, 159–170, https://doi.org/10.1080/03670244.1986.9990922 (1986).
Krasevec, J., An, X., Kumapley, R., Begin, F. & Frongillo, E. A. Diet quality and risk of stunting among infants and young children in low- and middle-income countries. Maternal & child nutrition 13 Suppl 2, https://doi.org/10.1111/mcn.12430 (2017).
Christian, P. et al. Risk of childhood undernutrition related to small-for-gestational age and preterm birth in low- and middle-income countries. Int. J. Epidemiol. 42, 1340–1355, https://doi.org/10.1093/ije/dyt109 (2013).
Jahoor, F., Badaloo, A., Reid, M. & Forrester, T. Protein metabolism in severe childhood malnutrition. Ann. tropical paediatrics 28, 87–101, https://doi.org/10.1179/146532808X302107 (2008).
Action Against Hunger. Integrated SMART Survey: Ukhiya and Teknaf Upazilas, Cox’s Bazar District, Bangladesh (2017).
United Nation Children’s Fund. The World Health Organization. International Bank for Reconstruction & Development. The World Bank. Levels and trends of child malnutrition: key finding of the 2019 edition of the Joint Child Malnutrition Estimates (World Health Organization, Geneva, 2019).
World Health Organization. Recommendations for data collection, analysis and reporting on anthropometric indicators in children under 5 years old (2019).
World Health Organization. WHO child growth standards: length/height-for-age, weight-for-age, weight-for-length, weight-for-height and body mass index-for-age: methods and development (2006).
Acknowledgements
T.D.-C. is supported by Action Against Hunger France and the French National Association for Research and Technology (ANRT, CIFRE #2014/1157). The data presented in this article are part of the OptiDiag study, funded by Action Against Hunger France with financial support from the Humanitarian Innovation Fund (ELRHA/HIF) and the European Union (DH-ECHO). The views expressed herein should not be taken, in any way, to reflect the official opinion of the European Union, and the European Commission is not responsible for any use that may be made of the information it contains. We thank Md. Musfikus Salehin, Meeves-Yoni Hassler, Nadezda Khodorova and the OptiDiag research staff and nurses for their contribution to this study.
Author information
Authors and Affiliations
Contributions
Study conception: B.G., T.D.-C., P.K., J.F.H. and H.F.; Submission to ethics committees: P.K., T.D.-C., B.G., M.R.M., M.A.A., M.A.H.K. and M.M.S.T.K.; Supervision of recruitment and data collection: T.D.-C., M.R.M., M.A.A., M.A.H.K. and M.M.S.T.K.; Isotopic measurements: V.M., T.D.-C. and H.F.; Data analyses: J.F.H., F.M. and H.F.; Manuscript drafting: J.F.H. and H.F.; Manuscript reviewing and editing: all co-authors.
Corresponding authors
Ethics declarations
Competing interests
The authors declare no competing interests.
Additional information
Publisher’s note Springer Nature remains neutral with regard to jurisdictional claims in published maps and institutional affiliations.
Supplementary information
Rights and permissions
Open Access This article is licensed under a Creative Commons Attribution 4.0 International License, which permits use, sharing, adaptation, distribution and reproduction in any medium or format, as long as you give appropriate credit to the original author(s) and the source, provide a link to the Creative Commons license, and indicate if changes were made. The images or other third party material in this article are included in the article’s Creative Commons license, unless indicated otherwise in a credit line to the material. If material is not included in the article’s Creative Commons license and your intended use is not permitted by statutory regulation or exceeds the permitted use, you will need to obtain permission directly from the copyright holder. To view a copy of this license, visit http://creativecommons.org/licenses/by/4.0/.
About this article

Cite this article
Dailey-Chwalibóg, T., Huneau, JF., Mathé, V. et al. Weaning and stunting affect nitrogen and carbon stable isotope natural abundances in the hair of young children. Sci Rep 10, 2522 (2020). https://doi.org/10.1038/s41598-020-59402-8
Received:
Accepted:
Published:
DOI: https://doi.org/10.1038/s41598-020-59402-8
This article is cited by
Comments
By submitting a comment you agree to abide by our Terms and Community Guidelines. If you find something abusive or that does not comply with our terms or guidelines please flag it as inappropriate.
