
Abstract
Run-of-river dams are often considered to have lower environmental impacts than storage dams due to their smaller reservoirs and low potential for flow alteration. However, this has been questioned for projects recently built on large rivers around the world. Two of the world’s largest run-of-river dams—Santo Antônio and Jirau—were recently constructed on the Madeira River, a major tributary to the Amazon River in Brazil. Here we evaluate the effects of the creation of the Santo Antônio dam on the water chemistry and thermal structure of the Madeira River mainstem and back-flooded valleys of tributaries within the reservoir inundated area. In contrast to the mainstem river, some back-flooded tributaries periodically developed thermal stratification, which is associated with higher water residence times. Additionally, biochemical oxygen demand, partial pressure of CO2, and organic carbon all increased in the tributary valleys inundated by the reservoir, possibly due to increased input of allochthonous organic matter and its subsequent mineralization upon back-flooding—a common feature of newly flooded impoundments. The mainstem did not show detectable dam-related changes in water chemistry and thermal structure. Although the majority of the reservoir area maintained riverine conditions, the lateral valleys formed upon back-flooding—corresponding to ~30% of the Santo Antônio reservoir area—developed lake-like conditions akin to a typical reservoir of a storage dam.
Introduction
Run-of-river hydropower plants have smaller reservoirs with limited water storage potential, unlike storage dams, which generally form large reservoirs with lacustrine conditions and variable water volumes. Inflowing water typically passes through a run-of-river reservoir quickly, and the electricity generation is a function of the flow of the river at a given time. Run-of-river dams are often considered to have lower environmental impacts due to their smaller reservoirs and lower potential for flow alteration1,2, although this has been questioned for projects recently built on large rivers around the world3,4. Considering that most new dam construction is of the run-of-river design5, there is an urgent need to more fully document the effects of this dam design on river systems.
Two of the world’s largest run-of-river dams—Santo Antônio and Jirau—have recently been constructed on the Madeira River, the largest tributary to the Amazon River in terms of water and sediment discharge6,7. The Jirau dam is immediately upstream of the reservoir created by the Santo Antônio dam, and the combined installed capacity of these two projects is equivalent to ~30% of the installed capacity of China’s Three Gorges dam, the largest in the world. Unlike some smaller run-of-river projects, these two large dams created reservoirs, inundating a total of ~900 km2 8. The Santo Antônio and Jirau dams were built so that, after being flooded, the reservoir is kept at bankfull stage throughout the year, with very little variation in the water level (70.5 to 71.3 m a.s.l. at Santo Antônio).
The Madeira dams were approved for construction after a great deal of controversy9. The Madeira River carries large amounts of suspended sediments that control downstream geomorphology10 and support highly productive fringing floodplains7. For these reasons, there has been much concern regarding how the Madeira dams could affect the natural flow of sediments and associated nutrients in the Madeira River10,11,12. Now, a few years after the dams were built, studies are starting to reveal decreases in downstream suspended sediment concentrations and fisheries yields13,14,15. These new studies have focused on downstream impacts, but the extent to which the dam has modified upstream water chemistry and thermal structure, and how the changes affect the biota of the newly formed aquatic environments, is not known. Consideration of upstream impacts is especially important considering that remote sensing has revealed that the flooded area estimated in the pre-dam environmental impact assessment may have been ~60% too low8, which may be in part related to changes in project design—reservoir level is currently 80 cm higher than that considered in pre-dam assessments.
Considering that the vast majority of the hydropower dams constructed in Brazil over the past decade have been of the run-of-river design, purportedly to minimize adverse ecological impacts16,17, a solid understanding of the ecological effects of these projects is crucial to inform future planning and management strategies. This is especially true considering the expected proliferation of hydropower dams of the run-of-river type throughout the Amazon basin18,19,20. Here, we evaluate the upstream effects of the creation of the Santo Antônio reservoir on the water chemistry and thermal structure of the Madeira River mainstem and its back-flooded tributaries. We compare pre- and post-dam patterns of ten ecologically and biogeochemically relevant variables: conductivity, turbidity, total phosphorus, total organic carbon, dissolved organic carbon, dissolved inorganic carbon, pH, partial pressure of CO2 (pCO2), dissolved oxygen, and biochemical oxygen demand (BOD). We sampled stations in the mainstem river and in back-flooded tributary valleys; because the back-flooded tributaries have longer water residence times21,22, we hypothesized that they would display more marked changes in water quality.
Results
Water depth
Analysis of water depths before and after damming indicates that the dam shifted both the mainstem and tributaries in its area of influence to a permanent high-water condition. The lower reaches of the tributaries that flow into the Madeira River within the reservoir area were permanently back-flooded upon damming, forming lateral drowned valleys that account for nearly 30% of the reservoir area (Fig. 1). In the mainstem, the average depth increased from 10 ± 3 (standard deviation) m to 22 ± 8 m during low-water phases (Student’s t-test, t = −4.2, df = 18, P < 0.05), but there was not a significant difference between pre- (21 ± 5 m) and post-dam (24 ± 6 m) depths during high-water phases (Student’s t-test, t = 1.2, df = 18, P = 0.23). The same occurred in the back-flooded tributaries, where depth increased from 1.3 ± 0.7 m (pre-dam) to 6.9 ± 0.8 m (post-dam) during low water phases (Student’s t-test, t = −15.9, df = 18, P < 0.05), but not during high-water phases (9.3 ± 1.2 m pre-dam versus 8.9 ± 1.5 m post-dam) (Student’s t-test, t = 0.7, df = 18, P = 0.49).
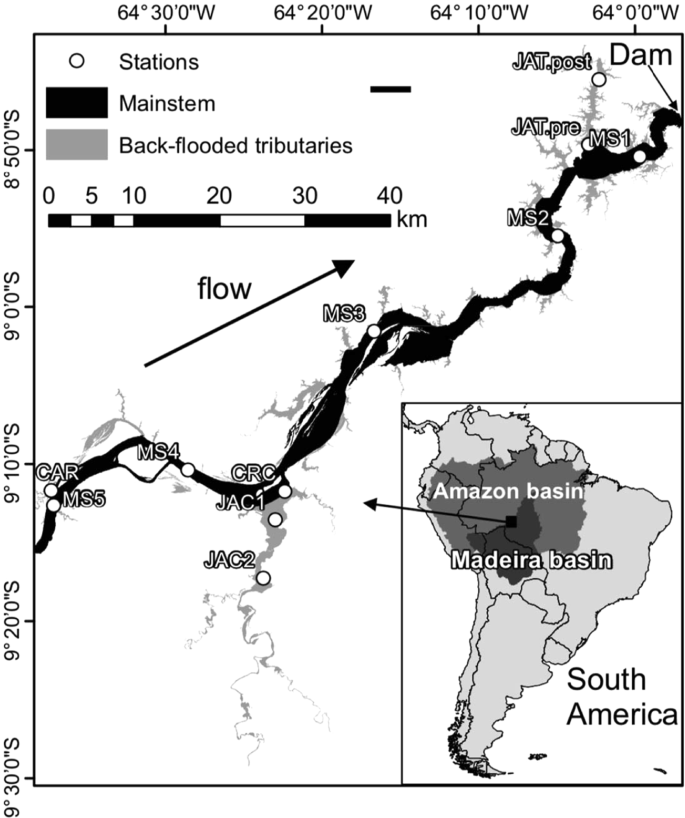
Map of the Santo Antônio reservoir, with black and grey areas depicting the area covered by the mainstem (70%) and back-flooded tributary valleys (30%), respectively, based on a total inundated area of 471 km2. Our sampling station in the tributary JAT was moved upstream after damming. Figure adapted from42.
Thermal profiles
The dam resulted in the formation of lacustrine conditions in some of the back-flooded tributaries, whereas lotic conditions were maintained in the mainstem. Two of the back-flooded tributary valleys occasionally developed thermal stratification after damming, whereas the water column in the mainstem remained isothermal as before (Fig. 2). The stratification of the back-flooded tributaries is a response to the increased water residence time caused by dam closure. The tributary valley that was most strongly stratified (JAT) has the highest residence time in the reservoir area (up to 36 days). In the mainstem, the post-dam residence time was short (mean: 2.4 days) and the water flow was too fast (mean: 0.33 m s−1) to allow thermal stratification.

Depth-time isotherms (°C) in the mainstem (MS1) and in back-flooded valleys of tributaries (CAR, CRC, JAC1, JAC2, and JAT) within the Santo Antônio reservoir before and after damming. The vertical black line indicates dam closure. Note that the JAT station was moved further upstream after damming (see Fig. 1). Figure adapted from42.
Water chemistry
The overall water chemistry changed substantially after damming in the back-flooded tributary valleys, but not in the mainstem (Fig. 3). A PERMANOVA analysis indicated that the overall water chemistry of the mainstem did not significantly differ before and after dam closure (r2 = 0.01, P = 0.34), whereas a significant difference was observed in the tributaries (r2 = 0.07, P < 0.05). After dam closure, the back-flooded valleys of the tributaries became chemically more similar to the Madeira River, which is illustrated by the NMDS polygon with post-dam tributary samples moving towards the mainstem polygons— although their lower conductivity shows that they remained relatively diluted in total ionic content, as is characteristic of lowland Amazonian rivers compared to those of Andean origin (Fig. 3). The “stress” of the NMDS was <0.20, which indicates good representation for ecological data.

Non-metric multidimensional scaling (NMDS) ordination showing the clustering in water chemistry between the mainstem and back-flooded tributary samples from the Santo Antônio reservoir before and after dam closure. There was no pre- versus post-dam difference in the mainstem (PERMANOVA, r2 = 0.01, P = 0.34), but a significant difference was observed in the back-flooded tributaries (PERMANOVA, r2 = 0.07, P < 0.05). Figure adapted from42.
In the mainstem, we found that the concentrations of dissolved inorganic carbon decreased significantly after damming, but we could not find significant alterations for BOD, total organic carbon, dissolved organic carbon, dissolved oxygen, pCO2, electrical conductivity, turbidity, total phosphorus, and pH (Figs 4 and 5). Prior to damming, the downstream-most mainstem station (MS1) had higher oxygen concentrations than the others, as there was a waterfall between MS2 and MS1. With reservoir creation, the waterfall was inundated and DO concentrations became longitudinally homogenous along the reservoir mainstem.

Box-plots depicting pre- (white) and post-dam (grey) comparisons of (a) biochemical oxygen demand (BOD); (b) total organic carbon (TOC) concentrations; (c) dissolved organic carbon (DOC) concentrations; (d) dissolved oxygen percent saturation (DO); and (e) partial pressure of CO2 (pCO2). The graphs in the first column are for the five mainstem stations and the graphs in the second column depict results for the five stations in back-flooded valleys of the tributaries. The red stars indicate significant differences between pre- and post-dam periods (p < 0.05). The horizontal line inside the box indicates the median and the boundaries indicate the 25th and 75th percentiles. Outliers are not shown for improved visualization.

Box-plots depicting pre- (white) and post-dam (grey) comparisons of (a) electrical conductivity (EC); (b) pH; (c) turbidity; (d) total phosphorus (total P); and (e) dissolved inorganic carbon (DIC) concentrations. The graphs in the first column are for the five mainstem stations and the graphs in the second column depict results for the five stations in the back-flooded valleys of the tributaries. The red stars indicate significant differences between pre- and post-dam periods (p < 0.05). The horizontal line inside the box indicates the median and the boundaries indicate the 25th and 75th percentiles. Outliers are not shown for improved visualization.
In the back-flooded valleys of the tributaries, dissolved oxygen, turbidity, total phosphorus, and pH did not differ between pre- and post-dam samplings, but we found that BOD, total organic carbon, dissolved organic carbon, pCO2, electrical conductivity, and dissolved inorganic carbon all increased significantly after damming (Figs 4 and 5). DO showed a peculiar pattern in the tributaries, with decreases in CAR, JAC1 and JAC2 being counterbalanced by increases in CRC and JAT, whereas the opposite trend was observed for pH and pCO2 (Fig. 4).
For variables displaying significant pre- versus post-dam differences in the back-flooded valleys of the tributaries, we further analyzed interaction between hydrological season (i.e., low, rising, high, and receding waters) and project stage (pre- and post-dam). We found that differences between pre- and post-dam periods occurred regardless of the hydrological season for BOD, TOC and conductivity (Fig. 6). For DOC, pCO2 and DIC, pre- and post-dam differences depended on the hydrological season, with rising-water periods not presenting pre- versus post-dam differences (Fig. 6).

Box-plots depicting pre- (white) and post-dam (grey) comparisons of biochemical oxygen demand (BOD; a) total organic carbon (TOC; b) dissolved organic carbon (DOC; c) partial pressure of dissolved CO2 (pCO2; d) dissolved inorganic carbon (DIC; e) and electrical conductivity (EC; f) for each of the four phases of the hydrological cycle in the five stations located in back-flooded valleys of the tributaries (CAR, JAC1, JAC2, CRC, and JAT). The red stars indicate significant interactions (p < 0.05) between project stage (pre- and post-dam) and hydrological season (low, rising high, and receding waters) for DOC, pCO2, and DIC. The horizontal line inside the box indicates the median and the boundaries indicate the 25th and 75th percentiles. Outliers are not shown for improved visualization.
Discussion
This study investigated the upstream effects of the creation of the Santo Antônio reservoir on the water chemistry and thermal structure of the Madeira River mainstem and tributary valleys flooded by the reservoir. We found minimal effects on the mainstem of the river and more pronounced effects on the lateral valleys. Impoundments typically change the condition of the water body upstream of the dam from lotic to lentic, increasing the water residence time. This hydrological change affects physical, chemical, and biological characteristics of the water body, often leading to thermal stratification and modifications in biogeochemical cycles23. The water slowdown may increase particle settling, decreasing turbidity and nutrient concentrations24,25. Dissolved oxygen concentrations can decrease, and CO2 production can increase following organic matter enrichment. None of these changes generally observed after damming was observed in the mainstem of the Santo Antônio reservoir, which accounts for ~70% of the reservoir surface area. However, dam-induced changes were observed in the lateral valleys formed by back-flooded tributaries (30% of the reservoir surface area), where many variables exhibited significant changes in pre- to post-dam comparisons (Figs 4 and 5). Our findings suggest that, in reservoirs of some run-of-river dams, even though the mainstem may largely maintain river-like conditions, the lateral drowned tributary valleys formed upon back-flooding may develop lake-like conditions akin to a typical reservoir of a storage dam. These changes in back-flooded valleys of tributaries are likely associated with their higher water residence times, which have been shown to be strongly correlated with a variety of functional metrics in both lotic and lentic ecosystems such as organic matter decomposition and chemistry26, internal metabolism27 and hypoxia development28, and nutrient uptake and delivery rates29.
We could not detect a significant reduction in turbidity or in total phosphorus, which is primarily particle-bound in the Madeira River11, within the Santo Antônio reservoir. This is probably because the water residence time is short, precluding the degree of particle sedimentation that is typically observed for large reservoirs of storage dams25,30,31. Two recent studies have found reductions of 20–30% in the concentrations of fine suspended sediments downstream of the Madeira dams13,14. However, a concomitant reduction of >30% was observed upstream of the dams13, which suggests that it is not possible to attribute the changes in fine suspended sediment concentrations to the creation of the dams. It remains unclear to what extent the Madeira dams have altered the sediment dynamics of the Madeira River. Although near-surface results do not show detectable reductions in turbidity and fine suspended sediments13, we note that the dams may still be trapping coarser sediments.
Our results for the thermal structure of the Santo Antônio reservoir corroborate a modelling study that estimated the densimetric Froude number for the mainstem of the Santo Antônio reservoir21. The Froude number is a dimensionless number that indicates the likelihood that the main body of a reservoir will develop thermal stratification; Froude values above 1 indicate that thermal stratification is unlikely. Monthly Froude values of the mainstem of the Santo Antônio reservoir ranged from 10 (lowest discharge) to 62 (highest discharge)21. Indeed, we found a well-mixed water column in the mainstem. In addition, we found occasional thermal stratification in the back-flooded valleys of the tributaries, which is especially likely during low discharge21, when the water residence time increases and flushing rates decrease. Thermal stratification was stronger and more persistent in JAT (Fig. 2), the back-flooded tributary valley with the largest residence time22.
Dissolved inorganic carbon was the only mainstem variable that displayed significant change between pre- and post-dam comparisons (Fig. 5). Previously reported measurements made at Porto Velho over four pre-dam years (2004–2007) showed high interannual variability in concentrations of HCO3−, the primary component of dissolved inorganic carbon in these waters, with annual means ranging from 142–519 μM32. The difference we report between pre- and post-dam concentrations of dissolved inorganic carbon is well within this range of natural interannual variability (Fig. 5), and thus it is possible that the lower concentrations of dissolved inorganic carbon concentrations after damming are related to a naturally occurring variation among years. Our study does not provide evidence for major changes in the water chemistry of the mainstem that can be unambiguously attributed to damming of the river.
While the NMDS and pre- versus post-dam comparisons did not indicate a large effect of the dam on the water chemistry of the mainstem, there were substantial changes in the back-flooded tributaries (Figs 3, 4 and 5). We attribute the alterations observed in the back-flooded tributaries to two different causes. First, changes in conductivity and dissolved inorganic carbon after damming indicate that the back-flooded valleys of the tributaries still contained water of largely local origin but became chemically more similar to the mainstem (Figs 4 and 5); this is corroborated by the NMDS ordination showing that the polygon representing post-dam tributary samples moving towards the mainstem polygons (Fig. 3). Second, increases in BOD, pCO2, total organic carbon and dissolved organic carbon are likely a result of increased organic matter mineralization of terrestrial carbon upon back-flooding, as is common for the initial years after damming33. As a reservoir ages, the mineralization of organic matter typically slows down, as does CO2 production34,35,36, so it is likely that CO2 supersaturation will decrease over time as the newly created Santo Antônio reservoir ages. Concentrations of dissolved oxygen did not show a significant difference after damming, but the magnitude of the difference in median values is consistent with the increased CO2 from respiration of organic matter. Both DO and pCO2 varied distinctly when comparing pre- and post-dam measurements in different back-flooded tributary valleys (Fig. 4), which may be associated with different inundated landscapes33. In addition, changes in phytoplankton biomass among the back-flooded valleys of the tributaries may explain spatial variations in DO and pCO237.
Amazonian reservoirs are typically large sources of carbon emissions to the atmosphere34,38,20. Our results suggest that the creation of the Santo Antônio reservoir did not result in a net increase of CO2 supersaturation in the mainstem. In three sampling stations in back-flooded valleys of the tributaries we found a consistent net increase in CO2 supersaturation after dam closure. This is consistent with the findings of a recent study indicating that the lateral drowned valleys of Amazonian reservoirs that have short overall water residence times are hot spots for CO2 emissions21, and also with findings suggesting that methane emissions from back-flooded tributaries of the Santo Antônio reservoir are substantially higher than from the mainstem39,40. Hence, our results build on previous work, reinforcing that while CO2 emissions may not increase in the mainstem of run-of-river Amazonian reservoirs41, they can be higher in relatively stagnant lateral valleys and back-flooded valleys of tributaries.
In summary, the lateral valleys created by back-flooding occupy about 30% of the Santo Antônio reservoir area. We found that this run-of-river dam had a larger effect on the water chemistry and thermal structure of back-flooded tributaries than on the mainstem river within the reservoir. We detected evidence of incursion of mainstem water into the back-flooded tributaries, as indicated by conductivity and dissolved inorganic carbon. In addition, these lateral valleys were more prone to developing thermal stratification due to residence times that can exceed 30 days22, unlike the mainstem that retained lotic conditions as is generally expected for dams of the run-of-river design. We also found that organic matter input and subsequent mineralization increased in the lateral valleys after damming, as indicated by higher concentrations of total organic carbon, dissolved organic carbon, BOD, and pCO2. It is likely that tributary waters flooding soils rich in organic matter rather than inputs via mainstem water are responsible for the observed increases in organic carbon, BOD, and pCO2 in the back-flooded valleys of tributaries, as these increases persisted during the majority of the hydrological cycle (Fig. 6). Because of their greater differences in physical and chemical characteristics, it is likely that back-flooded areas of run-of-river dams produce a different habitat for the aquatic biota compared to the mainstem waters, creating conditions that are favorable to freshwater species adapted to lentic environments37. Our study advances the scarce understanding of the environmental impacts of large run-of-river dams. We provide evidence that the lateral valleys potentially created by back-flooding should be considered priority areas when designing protocols for environmental impact assessments and monitoring programs for run-of-river dams.
Methods
Study site
The Santo Antônio dam is a run-of-river hydropower plant located on the Madeira River, in the state of Rondônia, Brazil (Fig. 1). The dam is 60-m tall and 2.5-km wide. The official area of the reservoir is 471 km2, although remote sensing indicates a larger flooded area8; throughout this study, we use the official reservoir area. The reservoir volume is 2075 × 106 m3, the length of the reservoir is 130 km, and the average depth is 11 m. The total installed capacity of 3,568 MW is provided by 50 bulb turbines. The environmental licensing of the Santo Antônio dam was characterized by much controversy—particularly with respect to sediment accumulation in the reservoir—and a detailed overview is provided in9. The dam was completed in September 2011, and the average water residence time of the reservoir is 2.4 days42. The average velocity of the Madeira River at Porto Velho prior to damming was 1.3 m s−1 (SO-HyBAm, http://www.ore-hybam.org/), which indicates that the natural (pre-damming) time for the water to travel through the reservoir length was about one day. A hydrodynamic and water quality model (CE-QUAL-W2) developed during the environmental licensing of Santo Antônio dam22 indicated that water residence times in drowned tributary valleys are about five times larger than in the Madeira mainstem, reaching up to 35 days in the Jatuarana (JAT) valley (Fig. 1), the back-flooded valley with the highest residence time in the reservoir. Throughout the reservoir, residence times peak in the dry season, typically between August and October. The hydrodynamic model also estimated annual average discharges in two of the back-flooded tributaries, JAT (1 m3 s−1) and Jaci-Paraná (JAC, 165 m3 s−1).
The Madeira River basin drains parts of Bolivia, Peru, and Brazil. With an area of 1.4 × 10⁶ km2, it covers 23% of the Amazon basin and 35% of the Andean Amazon43. The Madeira River has the third largest suspended sediment load among tropical rivers, behind the Amazon and Brahmaputra rivers6. The Madeira River is the largest tributary to the Amazon River and the world’s fourth largest tropical river in terms of discharge6, contributing 15, 14, and 50% of the Amazon River’s water, organic carbon, and suspended sediment transport, respectively6,44. Due to its origin in the high Andes, the Madeira River is rich in sediments and associated nutrients, as opposed to the small tributaries that flow into the reservoir, which are clear-water systems draining older terrains. The climate of the Madeira River basin is humid tropical – Am in the Köppen classification45. The mean annual precipitation is ~2,000 mm44, which is unevenly distributed across the year46. Discharge in the Madeira River can vary by an order of magnitude between low and high flow months, averaging 19,000 m3 s1 downstream of the dam at Porto Velho11 and 31,000 m3 s−1 at the river’s confluence with the Amazon River44. The largest cities within the Madeira River basin are La Paz and Santa Cruz de la Sierra in Bolivia, and Porto Velho in Brazil. Together, these three cities comprise a population of ~3.5 million people; otherwise, the Madeira River basin is sparsely populated.
Sampling and analytical procedures
We sampled five stations along the Madeira River mainstem within the reservoir and five stations in tributaries (Igarapé Caripuna, CAR; Jaci-Paraná River, JAC; Caracol River, CRC; Igarapé Jatuarana, JAT) that drain into the reservoir (Fig. 1); these tributaries were back-flooded upon damming and all our sampling stations are located within the reservoir inundated area. Sixteen field sampling campaigns were performed quarterly between 2009 and 2013, encompassing all major phases of the flooding cycle. The field campaigns were preferentially conducted in October (low water), January (rising water), April (high water), and June-July (receding water). Our study comprises eight field campaigns performed prior to damming (2009–2011) and eight field campaigns performed after damming (2012–2013). The filling of the reservoir started in September 2011 and it reached full pool in January 2012.
Measurements and samples were taken from ~0.5 m below the water surface. Water depth was measured at the time of sampling with a Garmin GPSmap sounder. Water temperature, conductivity, turbidity, dissolved oxygen and pH were measured at the time of sampling with a multiparameter sonde (YSI, model 6920) previously calibrated according to the manufacturer’s instructions. Five-day biochemical oxygen demand (BOD) measurements were made via incubations started within a day after sampling; dissolved oxygen was measured initially and after five days, and the BOD was computed from the difference between initial and final dissolved oxygen. Subsamples were filtered through GF/C glass-fiber filters (effective pore size ~0.7 μm) for analysis of DOC. Filtered and unfiltered water samples for laboratory analysis were kept refrigerated in the dark at 4 °C until analysis. The analyses were performed within a week of completion of each field campaign. Total phosphorus was measured by the colorimetric molybdate blue method11. Total organic carbon, dissolved inorganic carbon, and dissolved organic carbon were analyzed on a Tekmar-Dohrmann TC Analyzer (Model Phoenix 8000). Partial pressure of CO2 (pCO2) was calculated from measurements of pH and dissolved inorganic carbon47,48. In addition, we measured depth profiles of temperature to understand how the reservoir affected stratification and mixing in the mainstem and in back-flooded tributary valleys. Because all five mainstem stations remained vertically isothermal, we only present data for the station immediately above the dam.
Data analysis
We first quantified changes in the overall water chemistry of the mainstem and back-flooded valleys of the tributaries in response to the dam closure. We used non-metric multidimensional scaling (NMDS) based on a Bray-Curtis distance to visualize clustering in water chemistry among the mainstem and tributary samplings before and after dam closure, followed by permutational multivariate analysis of variance (PERMANOVA) to test for differences among groups. Two PERMANOVAs were run, one for the mainstem (pre- vs. post-dam) and one for the tributaries (pre- vs. post-dam). Although NMDS is often used to analyze differences in community composition across sites, here we use our various response variables in place of species abundances, which would traditionally drive the NMDS. Both NMDS and PERMANOVA were completed with the vegan package, using the metaMDS and adonis functions, respectively49 in the R Statistical Software version 3.3.250.
We used linear mixed-effects models to evaluate the effect of the dam on the response variables using the lmer function of the package lme451 in the R software. We log-transformed response variables (except pH) to meet normality and homoscedasticity assumptions. For all response variables, sampling station was considered as a random effect to avoid problems associated with multiple pairwise testing52.
Data availability
Supplementary information is available for this paper (spreadsheet with raw data used for the analyses).
References
Csiki, S. & Rhoads, B. L. Hydraulic and geomorphological effects of run-of-river dams. Progress in Physical Geography 34, 755–780, https://doi.org/10.1177/0309133310369435 (2010).
Egré, D. & Milewski, J. C. The diversity of hydropower projects. Energy Policy 30, 1225–1230, https://doi.org/10.1016/S0301-4215(02)00083-6 (2002).
Anderson, D., Moggridge, H., Warren, P. & Shucksmith, J. The impacts of ‘run-of-river’ hydropower on the physical and ecological condition of rivers. Water and Environment Journal 29, 268–276, https://doi.org/10.1111/wej.12101 (2015).
Hoover, R. Dams lite? Run-of-river projects no panacea. World Rivers Review 16, 8–9 International Rivers (2001).
Kibler, K. M. & Tullos, D. D. Reply to comment by Henriette I. Jager and Ryan A. McManamay on “Cumulative biophysical impact of small and large hydropower development in Nu River, China”. Water Resources Research 50, 760–761, https://doi.org/10.1002/2013WR014629 (2014).
Latrubesse, E. M., Stevaux, J. C. & Sinha, R. Tropical rivers. Geomorphology 70, 187–206, https://doi.org/10.1016/j.geomorph.2005.02.005 (2005).
McClain, M. E. & Naiman, R. J. Andean influences on the biogeochemistry and ecology of the Amazon River. BioScience 58, 325–338, https://doi.org/10.1641/B580408 (2008).
Cochrane, S. M. V., Matricardi, E. A. T., Numata, I. & Lefebvre, P. A. Landsat-based analysis of mega dam flooding impacts in the Amazon compared to associated environmental impact assessments: Upper Madeira River example 2006–2015. Remote Sensing Applications: Society and Environment 7, 1–8, https://doi.org/10.1016/j.rsase.2017.04.005 (2017).
Fearnside, P. M. Viewpoint – Decision Making on Amazon Dams: Politics Trumps Uncertainty in the Madeira River Sediments Controversy. Water Alternatives 6, 313–325 (2013).
Constantine, J. A., Dunne, T., Ahmed, J., Legleiter, C. & Lazarus, E. D. Sediment supply as a driver of river meandering and floodplain evolution in the Amazon Basin. Nat Geosci 7, 899–903, https://doi.org/10.1038/Ngeo2282 (2014).
Almeida, R. M. et al. Phosphorus transport by the largest Amazon tributary (Madeira River, Brazil) and its sensitivity to precipitation and damming. Inland Waters 5, 275–282, https://doi.org/10.5268/Iw-5.3.815 (2015).
Fearnside, P. M. Impacts of Brazil’s Madeira River Dams: Unlearned lessons for hydroelectric development in Amazonia. Environ Sci Policy 38, 164–172, https://doi.org/10.1016/j.envsci.2013.11.004 (2014).
Ayes Rivera, I. et al. Decline of Fine Suspended Sediments in the Madeira River Basin (2003–2017). Water 11, 514, https://doi.org/10.3390/w11030514 (2019).
Latrubesse, E. M. et al. Damming the rivers of the Amazon basin. Nature 546, 363–369, https://doi.org/10.1038/nature22333a (2017).
Santos, R. E., Pinto-Coelho, R. M., Fonseca, R., Simões, N. R. & Zanchi, F. B. The decline of fisheries on the Madeira River, Brazil: The high cost of the hydroelectric dams in the Amazon Basin. Fisheries Management and Ecology 0, https://doi.org/10.1111/fme.12305 (2018).
Abbud, O. A. & Tancredi, M. Transformações recentes da matriz brasileira de geração de energia elétrica - causas e impactos principais. (Brasília: Núcleo de Estudos e Pesquisas/CONLEG/Senado, Brasília, 2010).
Cerqueira, G. A. A Crise Hídrica e suas Consequências. (Brasília: Núcleo de Estudos e Pesquisas/CONLEG/Senado, Brasília, 2015).
Anderson, E. P. et al. Fragmentation of Andes-to-Amazon connectivity by hydropower dams. Science Advances 4, eaao1642, doi:10.1126/sciadv Science Advances (2018).
Finer, M. & Jenkins, C. N. Proliferation of Hydroelectric Dams in the Andean Amazon and Implications for Andes-Amazon Connectivity. Plos One 7, e35126, https://doi.org/10.1371/journal.pone.0035126 (2012).
Almeida, R. M. et al. Reducing greenhouse gas emissions of Amazon hydropower with strategic dam planning. Nature Communications 10, 4281, https://doi.org/10.1038/s41467-019-12179-5 (2019).
de Faria, F. A. M., Jaramillo, P., Sawakuchi, H. O., Richey, J. E. & Barros, N. Estimating greenhouse gas emissions from future Amazonian hydroelectric reservoirs. Environ Res Lett 10, 124019, https://doi.org/10.1088/1748-9326/10/12/124019 (2015).
Santo Antônio Energia. Prognóstico da qualidade da água do futuro reservatório da UHE Santo Antônio no rio Madeira através de modelagem matemática, SAE 003/2011. 158pp (2011).
Friedl, G. & Wüest, A. Disrupting biogeochemical cycles - Consequences of damming. Aquatic Sciences 64, 55–65, https://doi.org/10.1007/s00027-002-8054-0 (2002).
Fantin-Cruz, I., Pedrollo, O., Girard, P., Zeilhofer, P. & Hamilton, S. K. Changes in river water quality caused by a diversion hydropower dam bordering the Pantanal floodplain. Hydrobiologia 768, 223–238, https://doi.org/10.1007/s10750-015-2550-4 (2016).
Zhou, J., Zhang, M. & Lu, P. The effect of dams on phosphorus in the middle and lower Yangtze river. Water Resources Research 49, 3659–3669, https://doi.org/10.1002/wrcr.20283 (2013).
Catalán, N., Marcé, R., Kothawala, D. N. & Tranvik, L. J. Organic carbon decomposition rates controlled by water retention time across inland waters. Nat Geosci 9, 501, https://doi.org/10.1038/ngeo2720 (2016).
Gómez-Gener, L. et al. Low contribution of internal metabolism to carbon dioxide emissions along lotic and lentic environments of a Mediterranean fluvial network. J. Geophys. Res. Biogeosci. 121, 3030–3044, https://doi.org/10.1002/2016jg003549 (2016).
Blaszczak, J. R., Delesantro, J. M., Urban, D. L., Doyle, M. W. & Bernhardt, E. S. Scoured or suffocated: Urban stream ecosystems oscillate between hydrologic and dissolved oxygen extremes. Limnol. Oceanogr. 64, 877–894, https://doi.org/10.1002/lno.11081 (2019).
Bernal, S. et al. Supply, Demand, and In-Stream Retention of Dissolved Organic Carbon and Nitrate During Storms in Mediterranean Forested Headwater Streams. 7, https://doi.org/10.3389/fenvs.2019.00060 (2019).
Forsberg, B. R. et al. The potential impact of new Andean dams on Amazon fluvial ecosystems. Plos One 12, e0182254, https://doi.org/10.1371/journal.pone.0182254 (2017).
Kunz, M. J., Wüest, A., Wehrli, B., Landert, J. & Senn, D. B. Impact of a large tropical reservoir on riverine transport of sediment, carbon, and nutrients to downstream wetlands. Water Resources Research 47, W12531, https://doi.org/10.1029/2011WR010996 (2011).
Leite, N. K. et al. Intra and interannual variability in the Madeira River water chemistry and sediment load. Biogeochemistry 105, 37–51, https://doi.org/10.1007/s10533-010-9568-5 (2011).
Teodoru, C., Prairie, Y. & del Giorgio, P. Spatial Heterogeneity of Surface CO2 Fluxes in a Newly Created Eastmain-1 Reservoir in Northern Quebec, Canada. Ecosystems, 1–19, https://doi.org/10.1007/s10021-010-9393-7 (2010).
Barros, N. et al. Carbon emission from hydroelectric reservoirs linked to reservoir age and latitude. Nat Geosci 4, 593–596, https://doi.org/10.1038/Ngeo1211 (2011).
Prairie, Y. T. et al. Greenhouse gas emissions from freshwater reservoirs: What does the atmosphere see? Ecosystems, https://doi.org/10.1007/s10021-017-0198-9 (2017).
Teodoru, C. R. et al. The net carbon footprint of a newly created boreal hydroelectric reservoir. Global Biogeochemical Cycles 26, https://doi.org/10.1029/2011GB004187 (2012).
Appel, E. Efeitos do barramento tipo fio d'água sobre as comunidades fitoplanctônicas do Rio Madeira e seus tributários na área de influência da Usina Hidrelétrica Santo Antônio, RO, Brasil PhD thesis, Museu Nacional, Universidade Federal do Rio de Janeiro, (2017).
Almeida, R. M., Barros, N., Cole, J. J., Tranvik, L. & Roland, F. Emissions from Amazonian dams. Nat Clim Change 3, 1005 (2013).
Grandin, K. Variations of methane emissions within and between three hydroelectric reservoirs in Brazil, Uppsala University, (2012).
Hällqvist, E. Methane emissions from three tropical hydroelectrical reservoirs, Uppsala University, (2012).
de Araújo, K. R. et al. Carbon dioxide (CO2) concentrations and emission in the newly constructed Belo Monte hydropower complex in the Xingu River, Amazonia. Biogeosciences 16, 3527–3542, https://doi.org/10.5194/bg-16-3527-2019 (2019).
Almeida, R. M. Respostas biogeoquímicas de um grande rio amazônico a mudanças ambientais PhD thesis thesis, Federal University of Juiz de Fora, (2017).
Guyot, J. L., Filizola, N., Quintanilla, J. & Cortez, J. Dissolved solids and suspended sediment yields in the Rio Madeira basin, from the Bolivian Andes to the Amazon. Iahs-Aish P, 55–63 (1996).
Moreira-Turcq, P., Seyler, P., Guyot, J. L. & Etcheber, H. Exportation of organic carbon from the Amazon River and its main tributaries. Hydrological Processes 17, 1329–1344, https://doi.org/10.1002/Hyp.1287 (2003).
Alvares, C. A., Stape, J. L., Sentelhas, P. C., de Moraes Gonçalves, J. L. & Sparovek, G. Köppen’s climate classification map for Brazil. Meteorologische Zeitschrift 22, 711–728, https://doi.org/10.1127/0941-2948/2013/0507 (2013).
Villar, J. C. E. et al. Spatio-temporal rainfall variability in the Amazon basin countries (Brazil, Peru, Bolivia, Colombia, and Ecuador). International Journal of Climatology 29, 1574–1594, https://doi.org/10.1002/Joc.1791 (2009).
Almeida, R. M., Pacheco, F. S., Barros, N., Rosi, E. & Roland, F. Extreme floods increase CO2 outgassing from a large Amazonian river. Limnol. Oceanogr. 62, 989–999, https://doi.org/10.1002/lno.10480 (2017).
Weyhenmeyer, G. A., Kortelainen, P., Sobek, S., Muller, R. & Rantakari, M. Carbon Dioxide in Boreal Surface Waters: A Comparison of Lakes and Streams. Ecosystems 15, 1295–1307, https://doi.org/10.1007/s10021-012-9585-4 (2012).
vegan: Community Ecology Package. R package version 2.3-5 (2016).
R: A language and environment for statistical computing v. 3.3.2 (R Foundation for Statistical Computing, Vienna, Austria, 2016).
Bates, D., Machler, M., Bolker, B. M. & Walker, S. C. Fitting Linear Mixed-Effects Models Using lme4. J Stat Softw 67, 1–48 (2015).
Bolker, B. M. et al. Generalized linear mixed models: a practical guide for ecology and evolution. Trends Ecol Evol 24, 127–135, https://doi.org/10.1016/j.tree.2008.10.008 (2009).
Acknowledgements
We thank Santo Antônio Energia and the technical staff of Ecology Brasil and Universidade Federal de Juiz de Fora for support with field work and laboratory analysis. The results of this manuscript are part of R.M.A.’s PhD thesis42. R.M.A. was supported by Brazil’s Programa Ciência Sem Fronteiras (CNPq 201848/2015-5) and a Cary Institute Award for Graduate Student Research (Bentley Holden scholarship), and is currently funded by a Cornell Atkinson Center for Sustainability postdoctoral fellowship.
Author information
Authors and Affiliations
Contributions
R.M.A., A.J.R., E.J.R., S.K.H. and F.R. conceived this study. R.M.A., A.G., D.C., G.B., J.D.A.-Jr., L.H.S.S., M.L., N.B., P.C.J. and V.L.M.H. conducted field work and laboratory analyses. R.M.A., A.J.R., F.P. and P.C.J. ran the statistics and data analysis. All authors worked on the interpretation of the data. R.M.A. wrote the manuscript in close collaboration with S.K.H., and with substantive revision by all authors.
Corresponding author
Ethics declarations
Competing interests
The data used in this research come from the Limnological Monitoring Program conducted under the environmental licensing process of the Santo Antônio dam. R.M.A., A.G., D.C., G.B., L.H.S.S., N.B., P.C.J. and V.L.M.H. have participated in field work and laboratory analyses under this monitoring program.
Additional information
Publisher’s note Springer Nature remains neutral with regard to jurisdictional claims in published maps and institutional affiliations.
Supplementary information
Rights and permissions
Open Access This article is licensed under a Creative Commons Attribution 4.0 International License, which permits use, sharing, adaptation, distribution and reproduction in any medium or format, as long as you give appropriate credit to the original author(s) and the source, provide a link to the Creative Commons license, and indicate if changes were made. The images or other third party material in this article are included in the article’s Creative Commons license, unless indicated otherwise in a credit line to the material. If material is not included in the article’s Creative Commons license and your intended use is not permitted by statutory regulation or exceeds the permitted use, you will need to obtain permission directly from the copyright holder. To view a copy of this license, visit http://creativecommons.org/licenses/by/4.0/.
About this article

Cite this article
Almeida, R.M., Hamilton, S.K., Rosi, E.J. et al. Limnological effects of a large Amazonian run-of-river dam on the main river and drowned tributary valleys. Sci Rep 9, 16846 (2019). https://doi.org/10.1038/s41598-019-53060-1
Received:
Accepted:
Published:
DOI: https://doi.org/10.1038/s41598-019-53060-1
This article is cited by
-
Functional responses of amazonian frogs to flooding by a large hydroelectric dam
Biodiversity and Conservation (2024)
-
How a mega-dam in the Amazon’s largest tributary altered the drivers of planktonic communities
Hydrobiologia (2024)
-
Phytoplankton species composition as bioindicator in the largest fragmented channel of the Pearl River, China
Environmental Monitoring and Assessment (2024)
-
Changing temporal and spatial patterns of methane emission from rivers by reservoir dams: a review
Environmental Science and Pollution Research (2023)
-
Taxonomic and functional responses of bats to habitat flooding by an Amazonian mega-dam
Biodiversity and Conservation (2022)
Comments
By submitting a comment you agree to abide by our Terms and Community Guidelines. If you find something abusive or that does not comply with our terms or guidelines please flag it as inappropriate.
